The default pipeline reductions for the Tomo-e dataset can leave small zero-point offsets between measurements made on different nights in the database. As shown in Tech Note 24, applying ensemble analysis to a group of measurements made on different dates can remove some of these zero-point offsets, yielding photometry with a smaller scatter from epoch to epoch. In this note, I will describe tests of one method to insert a sort of ensemble photometry into the pipeline, so that the measurements made by the regular operations might be somewhat better.
After the telescope acquires an image, that image goes through a pipeline of software which performs a number of different actions: cleaning the image, identifying stars, measuring their positions and brightnesses in instrumental units, and then converting the instrumental units, such as (x, y) in pixels, to standard ones, such as (RA, Dec). The final step in the photometric calibration is to convert the instrumental magnitudes for stars in the image into magnitudes on some standard scale.
The current method, as implemented in the measure.py script, selects all the instrumental measurements for stars in a single chip from a single image. It searches for stars in the Pan-STARRS and Gaia catalogs which match those in the image. It discards catalog stars which are outside some range of colors, then (optionally) applies a color-based term to the remaining stars to convert their standard V or R or G magnitudes into something closer to the Tomo-e instrumental passband. It computes the differences between each Tomo-e measurement and (possibly transformed) catalog value, selects the median, and treats this as the zero-point offset to be applied to all instrumental magnitude values in the image.
Note that the action taken in this final step is simple: compute a single shift in magnitude to convert the instrumental quantities to "standard" magnitudes which are stored in the database for future use. The goal of photometric calibration is to find this single shift, the zero-point offset. No matter what methods are used, the result is one number.
If one compares multiple measurements of a star made on different nights (or different images within a night), one ought to find that -- aside from uncommon variable stars -- the magnitudes are the same; most stars do not vary in their brightness. However, my analysis of repeated measurements of stars in a small region have shown that there is an epoch-to-epoch scatter of around 0.04 or 0.05 magnitudes, even for bright, unsaturated stars which ought to have much higher precision. If one applies ensemble analysis to these repeated measurements of many stars in a field, one can reduce the scatter considerably, to about 0.01 magnitudes. Therefore, it appears that the issue is small night-to-night errors in the zero-point offset chosen during the calibration process.
I suspect that most of these zero-point errors derive from the fact that the Tomo-e instruments do not measure light through the same passbands as the instruments used to create the catalogs. Because of this passband mismatch, two stars of different color, but the same (for example) G-band magnitude, will appear to have different instrumental magnitudes when measured by Tomo-e. In addition, from one epoch to the next,
My application of the ensemble analysis was performed long after each image was acquired: I selected all the measurements of stars in a small region from the database, matched up measurements of each star at all the epochs, and performed the ensemble calculations. Interacting with the database in this way requires considerable time, as do some of the ensemble calculations. This straightforward method would not fit into a regular pipeline, to be run immediately after data acquisition.
So, is there a way to achieve the benefits of ensemble analysis in a quick and timely manner, which would fit into a pipeline?
After having run some tests, I believe that the answer is "yes." Let me describe a plan for improving the Tomo-e photometry. The key point is that we replace the method of determining zero-point values for each image: instead of comparing (say) Gaia magnitudes to Tomo-e magnitudes, we compare Tomo-e magnitudes to Tomo-e magnitudes. This allows us to make better relative image-to-image zero-point corrections. It is still necessary, at some point, to move these Tomo-e magnitudes to a standard scale, but we can do so ONCE, using a single, uniform shift applied to all the images in exactly the same way. Thus, the epoch-to-epoch scatter should be smaller.
This plan does require two large-ish efforts. The first step must be performed just once: creating a set of photometric templates for each region inside the survey area. This work doesn't affect the pipeline at all -- it just creates a new set of tables to be placed into the database. The second step is the one which would be run during the regular analysis pipeline, every time a new image is acquired.
Just as one combines 10 or 20 or 50 images to create a deeper, less-noisy super-image to use as a template for image subtraction, one can combine the photometric measurements from many nights to find a "high-quality" set of relative Tomo-e magnitudes for stars in some small area. The method is to select a set of measurements of stars from the Tomo-e database -- which could be either in instrumental or calibrated form(*) --
(*) which choice is better? The answer requires further work and discussion.in an image-sized region, from as many nights as possible (there are hundreds of nights covering the years 2019-2023 in the auto_zmr column). Run basic ensemble analysis on this set of measurements to yield a set of "master" relative magnitudes for the stars in the image.
Then, one can compare these "master" magnitudes to the magnitudes of matching stars in a standard catalog, such as Gaia. One can apply whatever criteria one wishes to select a sub-set of the "master" magnitudes, and apply whatever color slices or corrections are desired to the catalog values; and finally compute an offset between the "master" and "catalog" stars. One then applies this offset to the "master" magnitudes.
The result is a set of magnitudes which have high-precision RELATIVE magnitudes in the natural Tomo-e system, and which are CALIBRATED as well as possible to some standard system. Let's call these "template" magnitudes in discussions within this document. The "template" values can be stored into a table in the Tomo-e database for easy use at later times.
After the regular pipeline has measured instrumental magnitudes for stars in an image, it can add a new step: determining a single offset between the instrumental and "template" magnitudes for stars in the image. This involves several smaller steps
In the end, one can then apply that offset in magnitudes to all the instrumental values.
Another way to look at this is that we have replaced a single zero-point offset calculation -- instrumental Tomo-e magnitudes vs. (say) Gaia magnitudes -- with two offsets.
Many of the systematic factors which introduce errors from one night to the next will have smaller effects when we compare instrumental-to-instrumental magnitudes (in step 2 above) than when, in the current pipeline, we compare instrumental-to-Gaia magnitudes.
In order to test this idea, I performed the following end-to-end test. It isn't perfect, because it doesn't include any of the color-dependent terms that are important in the real data.
The result from each iteration is a mean error between the input and output values for the stars in one image. After running the simulation R times, one can examine the distribution of these errors. If the method works well, the mean values should be close to zero; if not, they may exhibit a broad spread.
I ran tests on my laptop, a Dell 9360 built in 2016 with an Intel(R) Core(TM) i7-7560U CPU @ 2.40GHz. I used
There is one detail that may not be relevant to a real application of this method to the Tomo-e analysis pipeline. The method I chose for step 4 in procedure,
was to run one of my ensemble programs, the one called solvepht. This program does proper weighting to bright stars and faint stars, which was good; but by default, it gives equal weights to measurements in all input images. Thus, using it to compare just two images -- template and observation -- would yield a set of "optimal" magnitudes for stars in the field which were half-way between the template's values and the observation's values. But the point here was to shift the observations so that they matched the input values, not simply approached them half-way.
Therefore, I gave greater weight to the template values in the following (somewhat strange) manner: I created C copies of the template, and sent them all, together with a single copy of the observation's measurements, as input to the solvepht program. This somewhat silly technique of giving greater weight to the template is certainly not the best way to perform this comparison; one could write a new piece of software which would handle the calculations properly with just a single copy of each file.
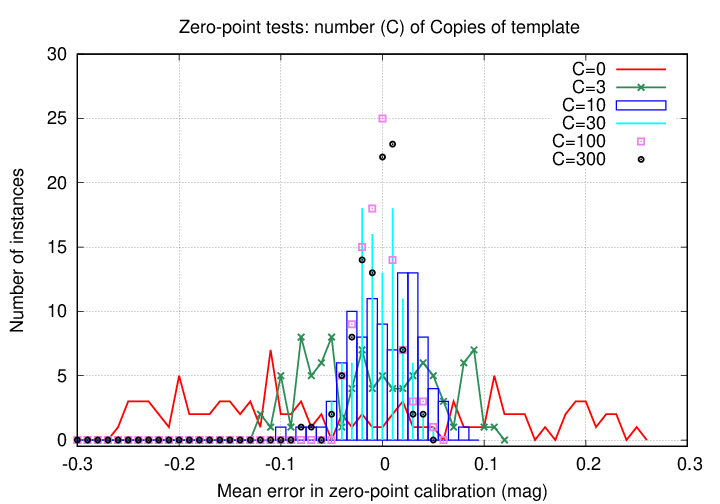
I will present my results in both table and graphical forms, showing the effect of this number of copies C. Again, the larger the value of C, the greater the weight given to the template in the comparison process.
 stars    epochs    copies      multipht      solvepht
   S       E          C           time          time
                                 (sec)          (sec)
------------------------------------------------------------
   30     300         0           0.009          0.002

   30     300         3           0.014          0.004

   30     300        10           0.009          0.004

   30     300        30           0.013          0.012

   30     300       100           0.015          0.052

   30     300       300           0.013          0.415
------------------------------------------------------------
We see that, using this particular method to perform the comparison vs. the template, it is necessary to include at least 30-50 copies of the template to achieve a high precision.
Note also that the time required to perform these calculations is very small, until the number of copies C goes above 100. Even so, the calculation takes less than one second on my laptop.
I also ran simulations to test how the number of stars in the image affected the final zero-point calibration. One might expect that if a field contains only a few stars, random errors in the measurements of those stars could lead to a relatively large scatter in the photometric calibration. For these tests, I kept the number of epochs at E = 300, the number of copies of the template at C = 100, and the number of repetitions of the simulation at R = 100; the number of stars in the field was set to S = 10, 30, 100.
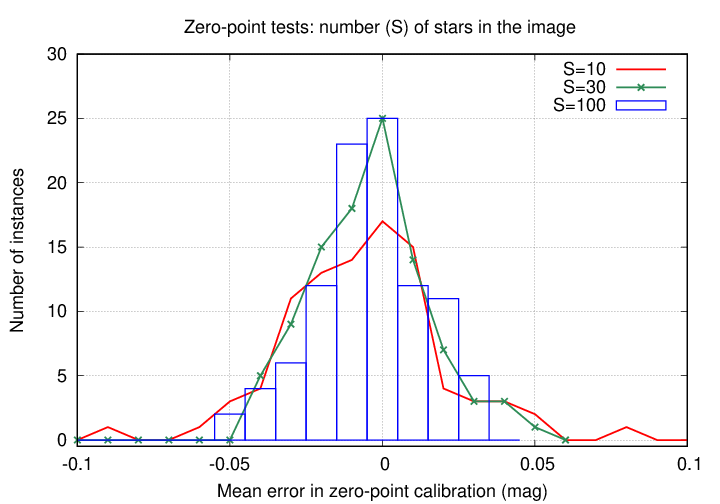
The number of stars in the field has a relatively weak effect on the results. That's good, because in the tests run on real Tomo-e data in the 10-square-degree field, I found that the number of stars per image which could be used for calibration varied widely, from around 30 to around 100.
Other tests I have run show that the number of stars in the field, N, does have a stronger effect on the time to perform the calculations than the number of epochs E.
CPU time ~ N2 E1
However, let me state again that the software I used to run these tests was in some ways not ideally suited for the task. It may well be possible to write code specifically for this purpose which is more efficient.