In order to test the method I have used for finding transient events in Tomoe data, I created a special dataset: I added artificial stars to real images taken on 20201214. After running the pipeline on this modified data, I compared the objects detected in the output with the events inserted into the images. The results are promising, with an efficiency over 90 percent for bright events.
The dataset "20201214" is based on images acquired during UT 2019 Dec 14, with PROJECT name 'FAST survey' and OBSERVER 'Y. Niino'. The images cover the span of time
2459197.871 ≤ JD ≤ 2459197.933
However, the camera was running in two different modes during this time:
  2459197.871  ≤ JD ≤ 2459197.887      120 x 0.5-sec exposures (2 Hz)

  2459197.888  ≤ JD ≤ 2459197.933       60 x 1.0-sec exposures (1 Hz)
For the purposes of this star-finding test, I analyzed only the 1-Hz images.
The FITS headers of one of these images states, in part:
OBJECT  = 'FASTsurvey'         / object name
EXPTIME =            59.994240 / [s] total exposure time
TELAPSE =            60.500020 / [s] elapsed time
EXPTIME1=             0.999904 / [s] exposure time per frame
TFRAME  =             1.000000 / [s] frame interval in seconds
DATA-FPS=             1.000000 / [Hz] frame per second
DATA-TYP= 'OBJECT'             / data type (OBJECT,FLAT,DARK)
OBS-MOD = 'Imaging'            / observation mode
FILTER  = 'BLANK'              / filter name
PROJECT = 'FAST survey'        / project name
OBSERVER= 'Y. Niino'           / observer name
PIPELINE= 'wcs,neo,stack,raw'  / reduction pipeline templete
The images were reduced and cleaned by others; I started with clean versions of the images. Each set of 60 images was packed into a single FITS file, covering a span of (60 * 1.0 sec) = 60 seconds. These "chunk" files were transferred to shinohara by me, and placed in
/gwkiso/tomoesn/richmond/work/work_20201214
with names like
rTMQ2202012140043557013.fits
These names can be decoded as follows:
       r             stands for    "reduced" ??
       TMQ2          means         "Tomoe data, part of quadrant 2"
       20201214      means         year 2020, month 12, day 14
       00435570      means         chunk index 00435570 (increases with time)
       13            means         chip 13
       .fits         means         a FITS file
I'll refer to each of these "composite" files as a "chunk".
There are typically 54 chunks for each chip in this subset. The chunk indices (also known as "exp_ids") range from 435518 to 435571.
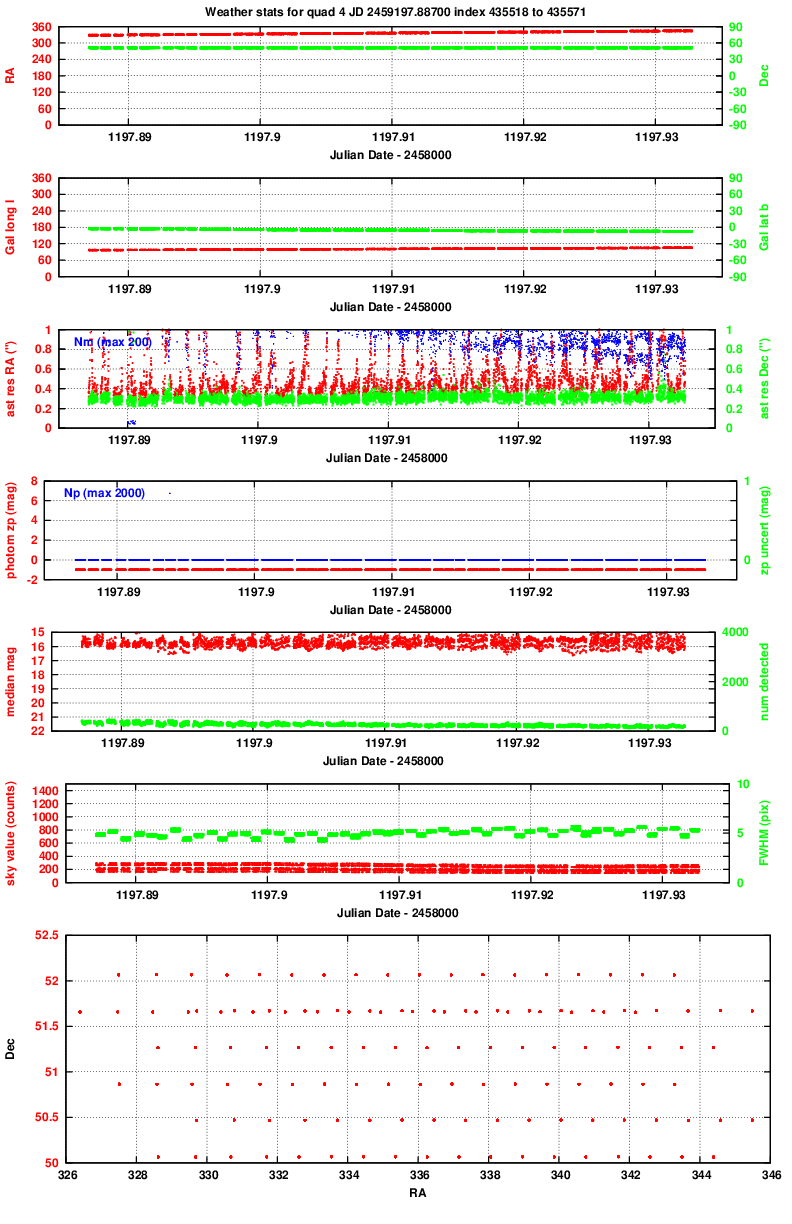
The figure below shows, in the bottom panel, the (RA, Dec) location of these observations. The fields are in the middle of the galactic plane, at galactic latitude 0 to -3 degrees (as shown in the second panel). in the constellation of Lacerta.
After running the pipeline to reduce the data, clean the images, find and measure stars, calibrate them astrometrically and photometrically, I used a script to look at properties of the data over the course of the night. You can read more about the "weather" in another note.
Below are links to the graphs produced for quadrant 4, which was the only one used for this test.
Quadrant 4:

These graphs show us that the night was a good one, with stable conditions. However, note
I created artificial transient events in the following manner: for every chunk of data (one minute of images from a single chip), I chose random values for
During its lifetime, this event maintained A CONSTANT BRIGHTNESS. In other words, it appears with the same magnitude in every frame. Real transient events would start as faint objects, grow brighter, then fade away again. So, this test is a very simplified one.
I examined the properties of real stars in all image of the chunk in order to measure two properties:
When the images showed elongation, it was along the RA direction; in other words, stars were wider in RA than in Dec.
I created artificial stars using the pstar command in the XVista package. It allows the user to set the FWHM, then creates a circularly-symmetric gaussian star with photon noise. I ran a second program, smooth, to transmogrify the circular gaussian of the fake star into an elongated object with (very roughly) the same elongation as the real stars. Finally, I added this artificial star into all the appropriate Tomoe images within the chunk. For example, if the starting image was chosen as "14", and the duration as "3 frames", then I would add the artificial star to images 14, 15, and 16 in the chunk.
Below is a set of small cutouts from one set of consecutive images, showing an artificial star of magnitude 16.1 added to eight images. The first and last images in the set show the images before and after the transient appeared.
![]()
These images are currently available for others to examine and copy. One can find them on the machine shinohara, in the directory
/gwkiso/tomoesn/richmond/work/work_20201214/quad_4
In that directory, there are a large number of sub-directories, one for each chunk, with names starting with "runDL_". For example,
      runDL_00435526_23
      runDL_00435526_26
      runDL_00435526_31
In each of these sub-directories, one can find a set of 60 images with names like
     Q_00435526_23_0000.fits
     Q_00435526_23_0001.fits
     Q_00435526_23_0002.fits
       ...
     Q_00435526_23_0059.fits
I have placed a list of all these FITS images into a single text file, to make it easier for others to copy them. The list is in
/gwkiso/tomoesn/richmond/work/work_20201214/quad_4/artificial_images.lst
There are a total of 378 chunks x 60 images/chunk = 22680 images.
The "key" to the artificial stars which were inserted into these images can be found in the file
/gwkiso/tomoesn/richmond/work/work_20201214/quad_4/generate_data.out
Here is a link to a local copy of "generate_data.out"
Each line in this file has lines which look like this:
# Fake dir runDL_00435518_12 Q 4 exp_id 00435518 chip 12 first 14 dur 8 row 1041.90 col 723.91 mag 16.165
The columns are
Note on "magnitudes" of stars added to images: the code which generated the artificial stars made a very rough guess at the magnitude those stars would have when they were properly calibrated by the pipeline. The guess turned out to be a little bit optimistic; in other words, the actual magnitudes of the artificial stars, calibrated against real stars in the images, turned out to be about 0.5 magnitudes fainter than the guess.
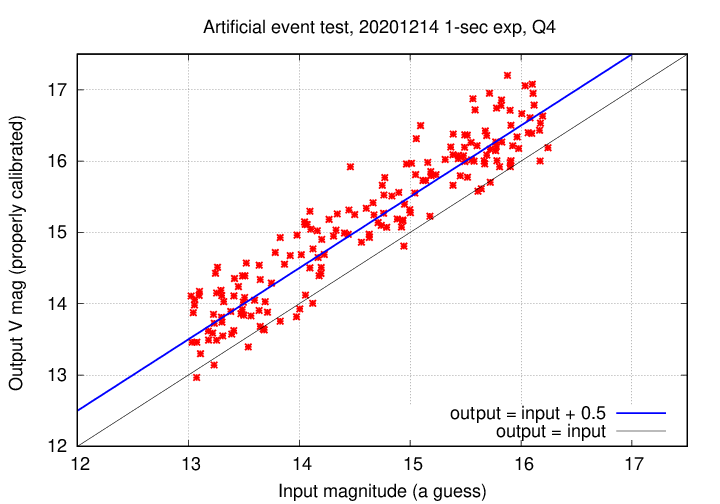
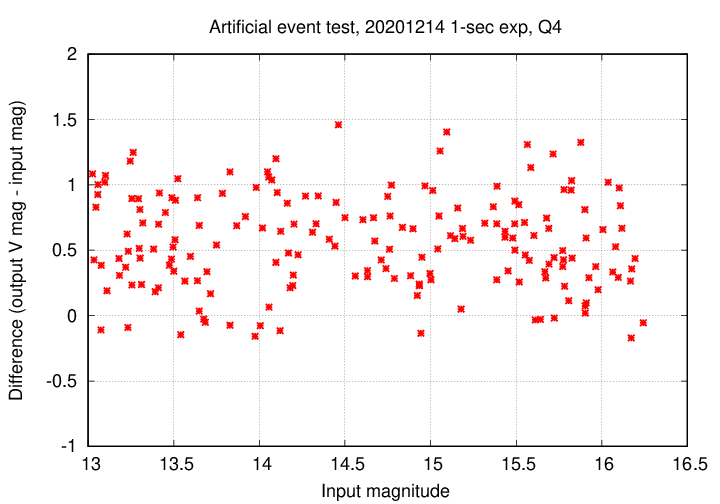
When discussing the completeness or efficiency of the transient-finding code, I will shift the input magnitudes by +0.5 mag in order to bring them approximately to their calibrated values.
I ran the transient-finding code, in the script transient_a.pl, on these images; that is the exactly the same code I have been using for all transient searches described in these Tech Notes, and the same code used for the analysis of Richmond et al. (PASJ 72, 3, 2020).
The link below shows small cutouts of all the candidates found by the algorithm; some of these are the artificial events added to the images, and some are the candidates found in the real data. One can use the "key" generate_data.out to pick out the artificial events.
I compared the list of transient candidates found by the algorithm against the "key", which showed all artificial stars added to the images. The graph below is one way to show the results: red symbols show added objects which were found, and blue symbols added objects which were not found.
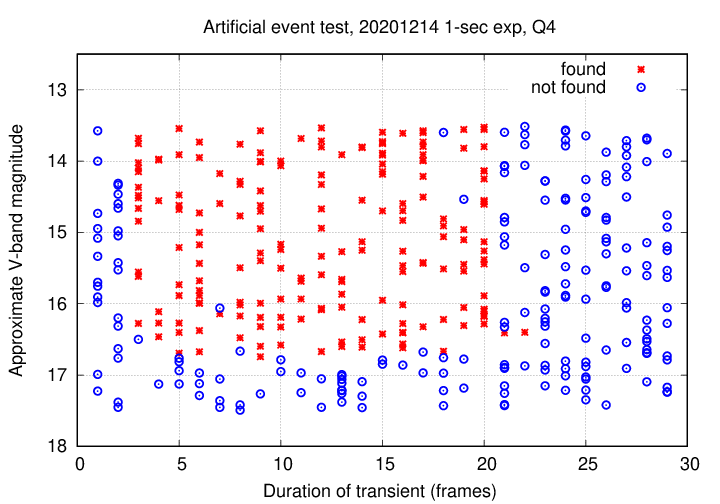
Now, the search algorithm was given the following rules for "valid" transient objects:
Note that all artificial events added to just 1 or 2 images were NOT found; that matches the rule. Hooray! Note that almost all artificial events with durations longer than 20 images were also not found; again, that is according to the rule. Hooray again! Now, two objects with durations greater than 20 images were counted as "found" -- but that's okay. Each of these was very faint, close to the detection limit, so the artificial star was not detected in 1 or 2 of the images; thus, the number of detections was within the limit of 20.
Almost all of the bright artificial objects were found, but starting around magnitude 16, the completeness starts to drop. I've computed the fraction of all artificial objects with durations of 3-20 images which were found, in bins by magnitude. The results are shown below.
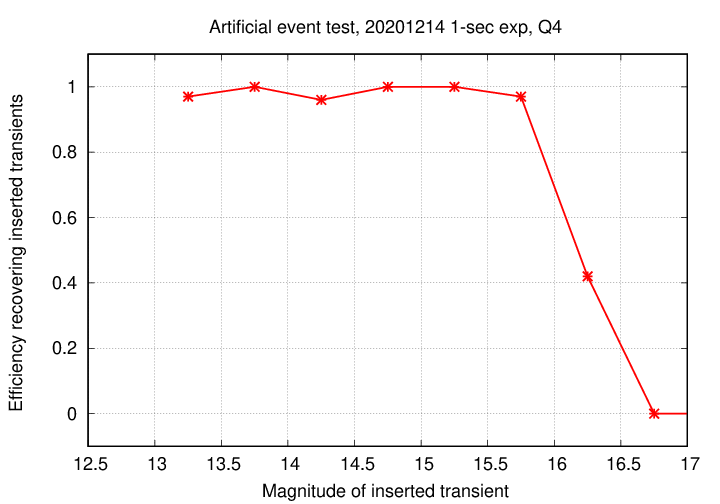
It seems that the completeness falls to 50 percent at a magnitude of around V = 16. If we look at the "weather" graph for this quadrant, we can see that this is roughly 1 magnitude brighter than the "depth" of the images; in other words, transients which are close to the detection limit in an image will very likely NOT be found.