The dataset "20160411" is based on images acquired during UT 2016 Apr 11. The images cover the span of time
2457490.00034 ≤ JD ≤ 2457490.27145
which cover about 6.6 hours.
The raw Tomoe "composite" files have names that look like:
    chip 0:   TMPM0108830.fits      -     TMPM0110080.fits
    chip 1:   TMPM0108831.fits      -     TMPM0110081.fits
           ...

    chip 7:   TMPM0108837.fits      -     TMPM0110087.fits
I'll refer to each of these "composite" files as a "chunk". For example, chunk 108840 is the second set of 360 FITS images collected by chip 0. A reference like "chunk 10884x" will refer to the data collected by all 8 chips during the period of time covered by chunk 108840.
There are 126 chunks for each chip, (11008x - 10883x), and so 126*8 = 1008 chunks in total for the night. The total size of the raw Tomoe composite files for this dataset is 1.7 GB.
After running the pipeline to reduce the data, clean the images, find and measure stars, calibrate them astrometrically and photometrically, I used a script to look at properties of the data over the course of the night. You can read more about the "weather" in another note.
Below are links to the graphs produced for each of the 8 chips.
Below is an animated GIF showing all 8 graphs in succession; it loops over them repeatedly.
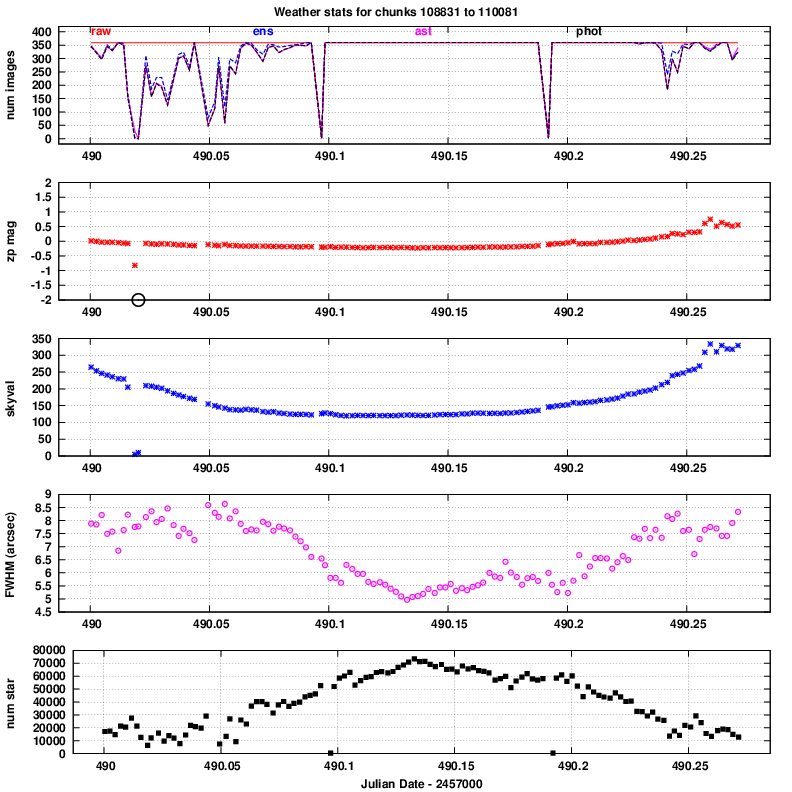
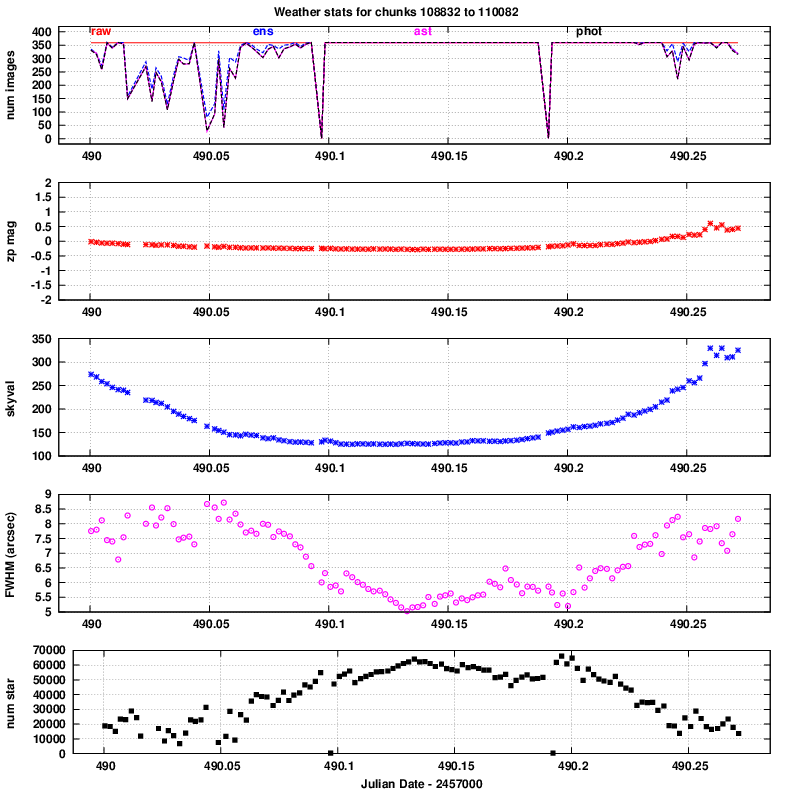
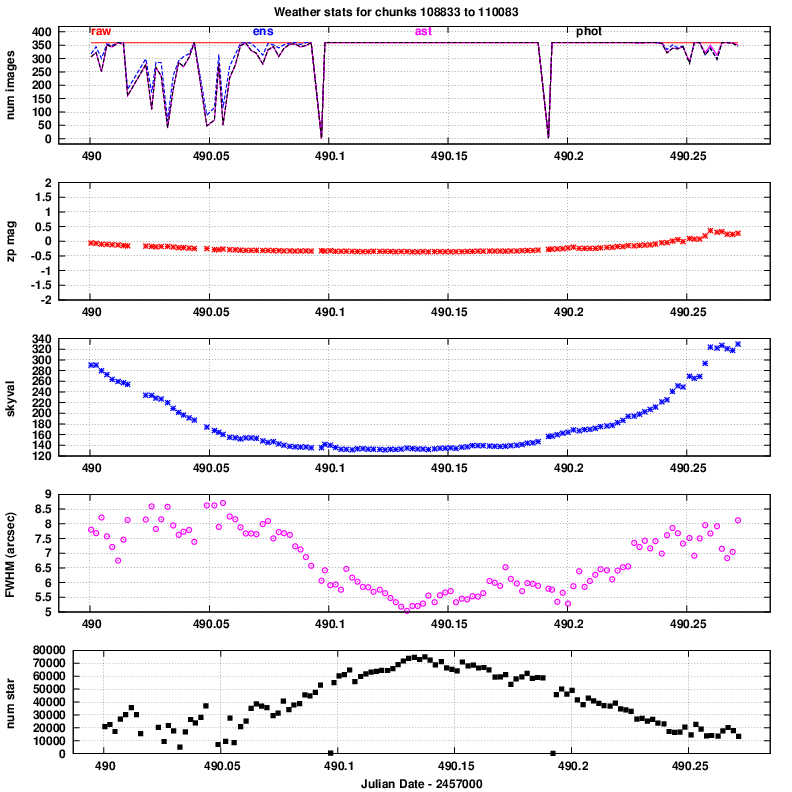
The primary -- and good! -- conclusion is that the properties of images in all 8 chips vary together: when one reports better seeing, they all report better seeing, for example. That confirms that the hardware is working properly.
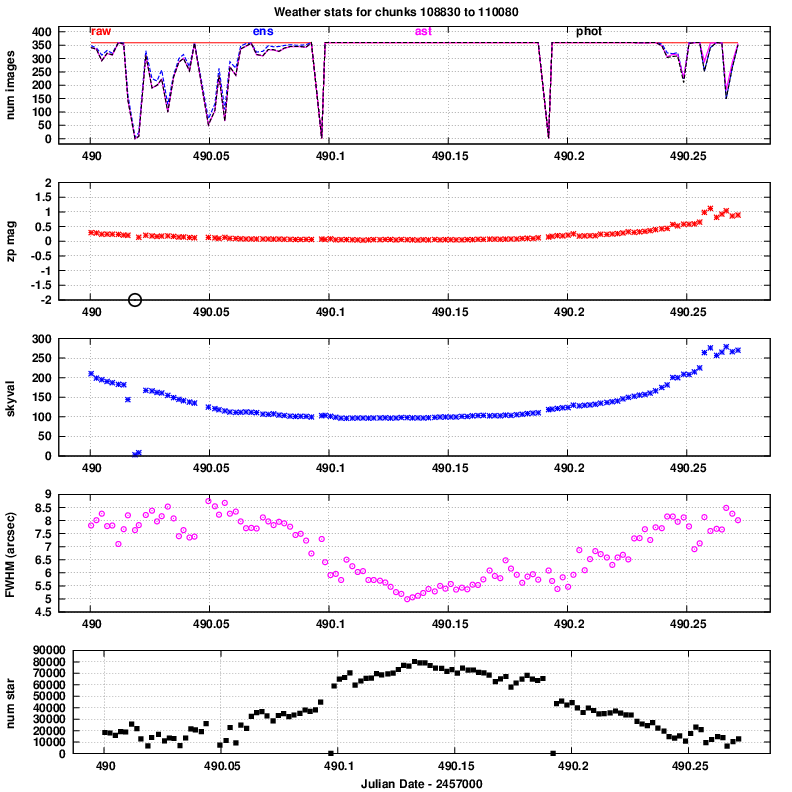
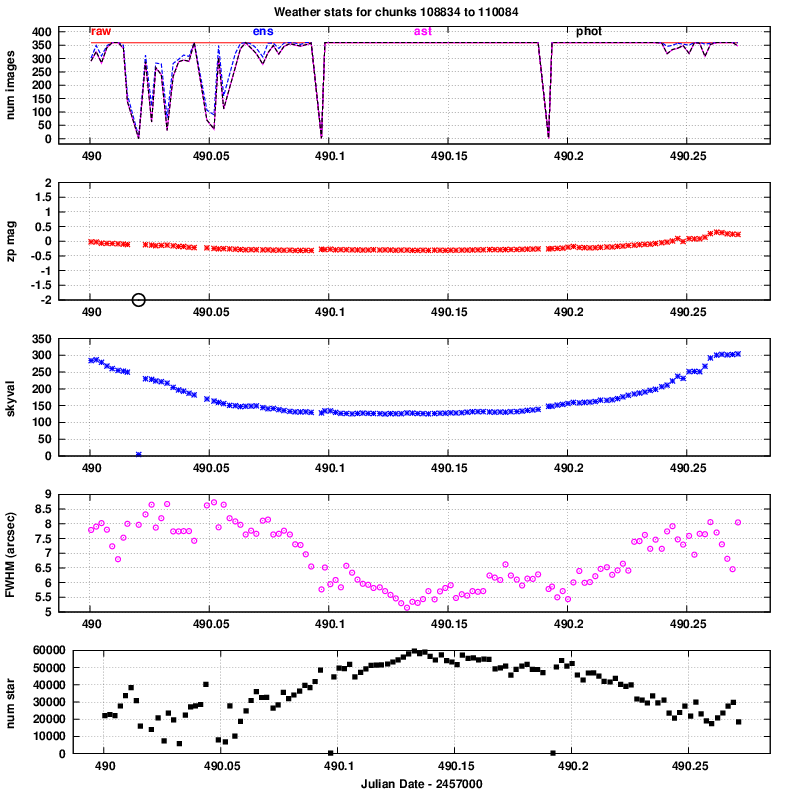
Let's go through the panels of these graphs, one by one, and comment on features of interest.
There are two times when just a single chunk has zero images; those may mark times when the telescope was moved, or the camera was briefly turned off, or ... ? Note that these cases appear in all 8 chips at the time times.
zp = (instrumental_mag) - (calibrated_mag)
Large positive values indicate extinction due to the atmosphere or clouds.
One can see that all the chips follow the same pattern: the zp decreases in the middle of the night, then increases near the end. No surprise.
However, note that the "central" chips 1,2,3,4,5,6 all have slightly lower values than the "outside" chips 0,7. This suggests that there is a small amount of vignetting in the optics; the difference is about 0.2 to 0.3 magnitudes.
Note again evidence of vignetting in the "outside" chips 0,7: their sky values are somewhat smaller than those in the other chips.
The number increases toward the middle of the night, reaches a peak, then decreases as the sky grows brighter and the seeing grows worse. Makes sense.
Note that the peak of 80,000 detections per chunk corresponds roughly to (80,000 / 360) = 222 stars in each image. The area of each image is
                2008 x 1140 pixels  =  1701 x 966  arcsec

                                    =  1.64 x 10^6  sq. arcsec

                                    =  456          sq. arcmin

                                    =    0.127      sq. degree
The typical distance between stars is about 86 arcsec, which means that the fields are sparse, not crowded. Aperture photometry should be fine for most stars.
I made a histogram showing the distribution of magnitudes for all detections during the night. This is not a count of unique stars: if a star appeared in 360 images, it will contribute "360 units" to the graph below. But the distribution of magnitudes is clear.
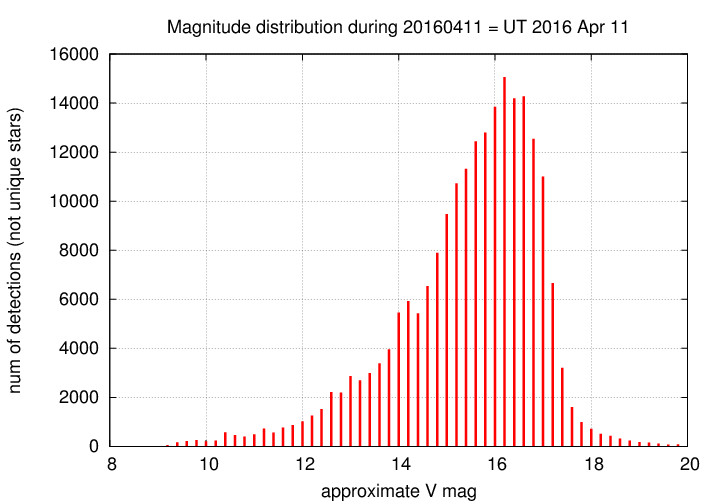
An independent method of determining the limiting magnitude for one chunk of data (in the transient-finding routine ) typically estimates a limiting magnitude of 14.5 to 16.0. That agrees pretty well with the data shown here.