On the night of Aug 09/10, 2005 EDT, Tracy Davis and I used the RIT Observatory's 12-inch Meade telescope and SBIG ST8 CCD camera to monitor the cataclysmic variable star EI Psc (also known as 1RXS J232953.9+062814) as it was near the peak of its outburst. We are acting on behalf of the Center for Backyard Astrophysics, VSNET, and all others who study these very interesting variable stars.
The plan:
Notes from the night
You can read about EI Psc in these articles:
The stars marked "A" and "B" were used as comparisons in the 2001 superoutburst, according to the Uemura et al. papers. Here is the rather poor information I can find about them:
                                                             USNO B1.0 mags
star  GSC_1.2_ID   USNO B1.0 ID         RA   (J2000) Dec       B        R
----------------------------------------------------------------------------
 A   0591.1689     0964-0601121      23:30:02.7  +06:24:37   13.64?  11.83?

 B   0584.366      0963-0598647      23:29:49.9  +06:22:11   12.4    12.85
----------------------------------------------------------------------------
I have used star "B" to set the zeropoint of my unfiltered measurements. I create a pseudo "V-ish" magnitude by the simple calculation (B+R)/2 based on the USNO B1.0 magnitudes, and end up with "V-band" mag = 12.63.
I measured the instrumental magnitude of each star with aperture photometry, using a radius of 4 pixels = 7.5 arcseconds and sky defined by an annulus around each star. Following the procedures outlined by Kent Honeycutt's article on inhomogeneous ensemble photometry, I used all stars available in each image to define a reference frame, and measured each star against this frame.
Below is a graph of the scatter in differential magnitude versus magnitude.
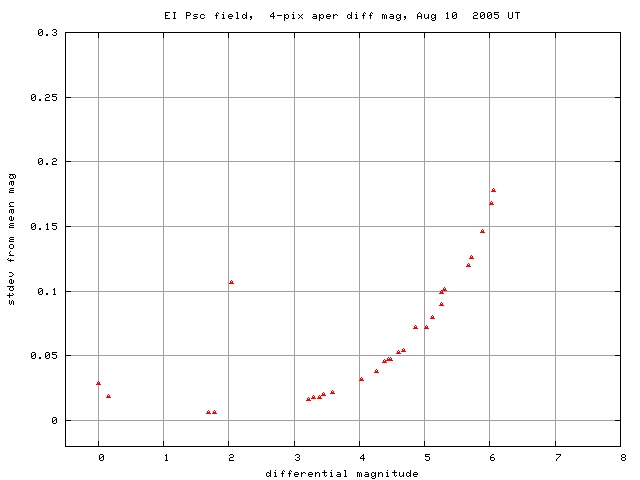
The two brightest stars -- which you can see between HD 221248 and star "A" in the chart above -- are both saturated in our 30-second images. The outlier at differential mag approx 2.0 is EI Psc. The formal scatter for the brightest unsaturated stars, "A" and "B", is about 0.006 mag.
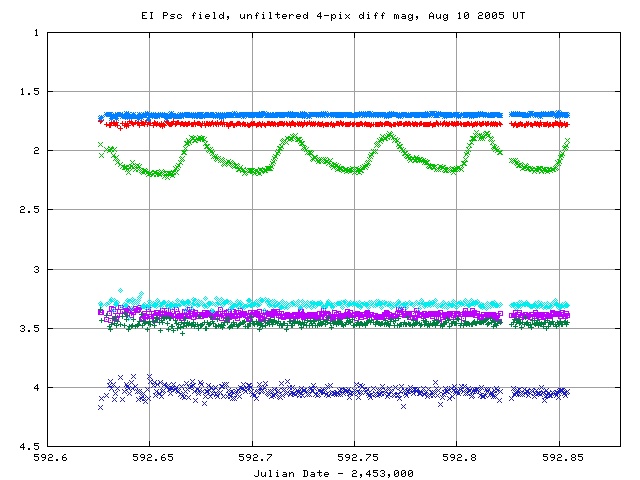
Light curves for selected stars in the field are shown below. EI Psc, shown by light green crosses near the middle, is clearly variable.
Here's a closeup of the variation in EI Psc itself, with the comparison stars "A" (in red) and "B" (in blue). The amplitude of the variations has grown greatly from its value two nights ago!
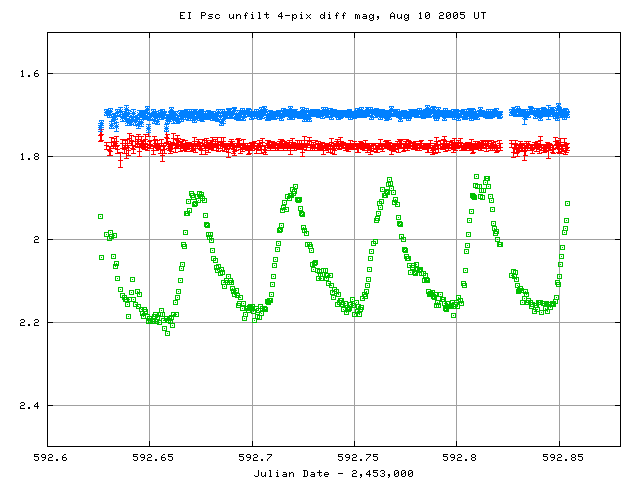
Note that a few thin clouds moved through the area at the time of the final maximum light, around JD 592.81; those clouds are reponsible for the scatter visible in the light curve near the top of this final peak.
I've made a table of the measurements themselves, with three different flavors of time. The differential unfiltered magnitudes from the ensemble solution has been shifted so that star "B" in my chart, has value 12.63, matching a very rough guess at its V-band magnitude, based on B and R mags in the USNO B1.0 catalog.
Here's the start of the table.
# Measurements of EI Psc made at RIT Obs, Aug 10, 2005 UT,
#   made by Michael Richmond and Tracy Davis.
# All data taken with 12-inch LX-200 + no filter + SBIG ST-8 CCD
#    no focal reducer, so at native f/10
# Each exposure 30 seconds long; tabulated times are midexposure
#    and accurate only to +/- 1 second.
# 'mag' is a differential magnitude based on ensemble photometry
#    which has been shifted so USNOB1.0 0963-0598647 has mag=12.63
#    (a rough guess = (B+R)/2 and the USNO B1.0 magnitudes).
#
# UT day      JD-2,450,000  HJD-2,450,000   mag    uncert
Aug10.12590      3592.62590   3592.63045  12.877  0.057
Aug10.12645      3592.62645   3592.63100  12.976  0.106
Aug10.12860      3592.62860   3592.63315  12.920  0.074
Last modified 8/10/2005 by MWR.