 Copyright © Michael Richmond.
This work is licensed under a Creative Commons License.
Copyright © Michael Richmond.
This work is licensed under a Creative Commons License.
Table of contents:
On Dec 25, 2005, Patrick Wiggins took part in a campaign to monitor the bright star Spica as it slid past the very edge of the Moon. Maps of the event are at Steve Preston's occultation predictions site.
Patrick's location for observing this event was not far from the town of Delta, Utah. A standalone GPS receiver, and the GPS unit attached to his video-time-insertion unit, both provided a position of
You can see Patrick's messages about the event at
It may also be useful to read David Dunham's brief description of the campaign.
Patrick's equipment included
Patrick digitized his videotape and provided several versions of the digital movie. Initially, I looked at an edited version of the tape, called SPICA25DEC2005.AVI, which had boring stretches of time removed. Later, I grabbed a copy of the complete record, called SPICA25DEC2005.MOV, which is 1,229,417 bytes in length. Each frame is 320x240 pixels in size.
Each video frame has a time stamped on it. Below is an example, frame number 265 in the sequence, which is the first one showing the Moon and Spica -- all the earlier frames were titles. The final frame showing Spica and the Moon is number 4370.
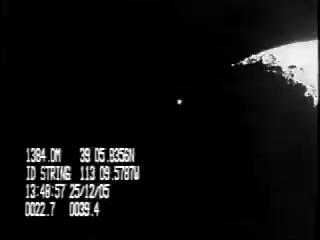
As far as I can tell, each frame in the movie file contains only one of every two fields of video data. By "field", I mean the light striking the camera during a period of about 1/60 of a second. It appears to me that Patrick's digitized movie shows only every other field; the interval between timestamps in consecutive frames is about 0.033 seconds.
The video time inserter malfunctioned in the middle of the event, so accurate times are present only in the first portion of the tape. After looking at several consecutive frames at the very start and very end of the movie file, I decided that
This yields a frame rate of about 29.97 frames per second, which is exactly what one would expect from ordinary NTSC video. Good.
I processed this movie file in the following manner:
The only star visible in the frames is Spica itself. The 8-bit digitized images had a small dynamic range, from 0 to 255 counts per pixel. The background pixel values, in regions of dark sky, are all 0. The central pixels in Spica are usually at the top level of 255, meaning that Spica was slightly saturated in the video. All photometry of the star will suffer from small (?) systematic errors as a result. The FWHM of Spica in this version of the video is about 3.3 pixels.
For each of the 4502 frames, I
After looking at the resulting light curves, I decided that a synthetic radius of 4 pixels produced a decent result. I'll use that aperture size for all the photometry discussed below.
To gauge the precision of the photometry, I calculated the mean flux and standard deviation from the mean for Spica over two sections of the record, both of which are outside an occultation.
      star                       mean counts    standard deviation
-------------------------------------------------------------------
frames 420-460
   Spica                          2644              194

frames 1750-1830
   Spica                          2563              191
--------------------------------------------------------------------
The precision of the photometry is not great: the fractional precision is about 7 percent. Some of the scatter could be due to the saturation of the central pixels.
Here are quick views of the results.
The entire light curve:
A closeup around the start of the tape:
A closeup around the middle of the tape. Notice the gradual re-appearance, but very sudden disappearance. This is possibly due to a different slope in the local topography of the lunar limb on two sides of a valley.
A closeup around the end of the tape:
You can grab the data in a multi-column ASCII text file below. The columns are
 col              quantity
------------------------------
  1              frame index

  2,3            flux of Spica in 3-pixel-radius aperture,
                     and estimate of uncertainty in that flux
  4,5            ditto 4-pixel aperture
  6,7            ditto 5-pixel aperture
  8,9            ditto 6-pixel aperture
  10,11          ditto 7-pixel aperture
Copyright © Michael Richmond.
This work is licensed under a Creative Commons License.