 Copyright © Michael Richmond.
This work is licensed under a Creative Commons License.
Copyright © Michael Richmond.
This work is licensed under a Creative Commons License.
Table of contents:
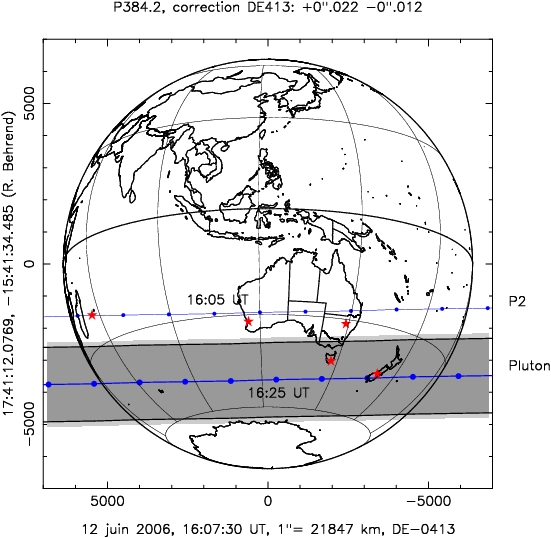
On June 12, 2006, UT, the planet Pluto was predicted to occult a faint star. Observers in Australia and New Zealand had the best vantage point:
Thanks to Bruno Sicardy and Wolfgang Beisker
The target star is known by several names:
It lies in a crowded field, as this chart from the Digitized Sky Survey shows:
Thanks to
Aladin for such nice charts!
The UCAC2 catalog includes a proper motion measurement, though it is only marginally significant, about 1.5 times the uncertainty. Using the proper motion, I computed the star's position on June 12, 2006, or epoch 2006.444:
   RA  =  265.3003098  =   17:41:12.07435
  Dec  =  -15.6929373  =  -15:41:34.574
The magnitude of the star is not measured very well; the USNO B1.0 lists B=15.6 and R=14.0. We might guess the star to have V=14.8 or so.
The JPL Horizons system provides an ephemeris for Pluto
which lists its visual magnitude as 13.8. We therefore expect that the combined light of the system should be about 1.4 times brighter than Pluto alone, or about 3.5 times brighter than the star alone. While the star is completely hidden by Pluto, the combined light should drop by about a factor of 40 percent, or about 0.36 magnitudes.According to the JPL ephemeris, Pluto's motion is 3.95 arcseconds per hour, or 0.001097 arcseconds per second. At a distance of 30.12 AU from Earth, Pluto's apparent angular diameter is (according to the JPL ephemeris) 0.109 arcseconds; but that doesn't agree with this calculation: given a radius of Pluto of R = 1137 +/- 8 km (from Elliot et al., Nature 424, 165, 2003), and a distance of 30.12 AU, I find the apparent angular diameter of Pluto should be 0.1041 arcsec. I'll adopt this smaller value from this point on. If the center of the planet were to pass directly over the star, the occultation would last about 95 seconds.
Dave Gee recorded the event from a location at latitude -33.6644, longitude E 150.6411, altitude 286 meters.
Dave wrote to me with some additional details:
25cm Newtonian on GEM (homemade) Meade Deep Sky Imager Pro Exposure time 1 second Time - I synced my PC to my GPS timer before observing. The time in the 'Properties' is accurate to 0.25 second, however it is in local time. ie... 13 June 2006, 2:25:18 AM = 12th June 16:25:18UT
Dave processed his raw video frames, subtracting a dark frame and dividing by a flatfield. He kindly sent the processed frames to me.
I had to convert the images from 32-bit floating-point FITS format into 16-bit integer FITS format to handle them, but that conversion did not incur any penalty: the original pixel values were integers, ranging from roughly 3200 counts to 6500 counts.
Below is a sample frame, index number 1.
I have oriented the image so that it matches the standard astronomical chart, with North up and East to the left. For future reference, I selected a small number of stars, ranging from some the brightest in the frame to some a bit fainter than the target. In the chart below, the circled object without a label at the center of the frame is the combined light of Pluto and the star.

The brighter stars are (mags from the USNO B1.0)
  star       USNO B1.0      Bmag   Rmag
-----------------------------------------
   A      0743-0456416      11.9    10.9

   B      0743-0454527      13.3    11.3

   C      0743-0455958      14.1    12.7
-----------------------------------------
Here's a closeup of the region around the target:
In order to process the data, I converted them from 32-bit floating-point FITS to 16-bit integer FITS using tools from HEAsoft, then analyzed each one with programs from the XVista astronomical image processing package.
For each of the frames, I
There were typically 200 stars detected in each frame.
After finding stars in 333 frames, I used the ensemble package to perform "inhomogeneous ensemble photometry" on the entire set. In effect, I used about 200 stars to define a mean light level for 333 frames, making small adjustments to each frame to bring it into best agreement with the average.
The end result is a set of "mean" magnitudes for each star, with associated standard deviation. A "sigma-versus-magnitude" plot for the ensemble shows the usual form: small scatter at the bright end, larger scatter at the faint end. Below is the plot for the measurements made through an aperture of radius 3 pixels:
Outliers on this plot are objects which vary more than most of their peers. The combined Pluto-plus-star object is the outlier at differential magnitude 2.5, with scatter 0.133 magnitudes. (The big outlier at differntial magnitude 1.9 is due to a cosmic ray and/or blend of two stars, I think)
Since the 3-pixel aperture provided the smallest scatter for faintish stars, I decided to use the 3-pixel aperture results for further work.
Here are sample light curves for the objects marked in the charts above:
As you can see, most of the objects have roughly constant brightness throughout the video record. The brighter objects have smaller scatter around their mean values. The magenta squares, star C, show a definite drop in brightness of about 0.10 mag at about the halfway point of the record; I suspect this is due to the star drifting into a dust donut which appears on the image.
The combined light of "Pluto-plus-star" is shown as the green crosses. Clearly, Dave recorded the occultation.
Let's look at a closeup of the "Pluto-plus-star" light curve by itself.
The combined light decreases by 0.4-0.5 magnitudes, just as predicted. Good.
You can grab the data in a multi-column ASCII text file below. The interesting columns are
 col              quantity
------------------------------
  4              frame index

  6              mean ensemble differential magnitude

  7              ensemble differential magnitude in each frame

  8              estimate of uncertainty in magnitude
Note that a few frames do not provide measurements, due to short trails or blurriness. There are only 329 measurements from the sequence of 333 images.
The frames occur at very nearly 2-second intervals. The times recorded in the FITS headers are rounded to the nearest second, so little jumps appear here and there.
Example line:
pluto_012.fts 11 16:17:57 2.432
The format is
Was this occultation central? That is, did the star pass directly behind the center of the disk of Pluto? There are two ways we can address this question.
First, we can use the best position of the star, and a recent ephemeris of Pluto, to predict the geometry of the event. Using the position of the star from the UCAC2, with proper motion as provided in that catalog, and using the ephemeris of Pluto provided by the JPL Horizons system (from a query made on June 29, 2006), I made the following graphs showing Pluto's motion relative to the star. First, a "wide-field" view, spanning 2 arcseconds:
A closeup shows more clearly that Pluto's center misses the star by a significant fraction of its radius:
Let's use the letter b to denote the angular separation between Pluto's center and the star at closest approach; this is the standard in discussions of this "impact parameter." Look at the left-hand position on the figure below.
A rough value read off my graphs is b = 0.038 arcsec. Using the angular radius of Pluto, r = 0.0545 arcsec, we can derive the angle θ = 44 degrees.
As a side note, it looks to me as if this prediction is not completely consistent with the figure of the shadow falling on the Earth, shown near the top of this document. Dave's location, if I read my maps correctly, should be close to the red star on the eastern coast of Australia, which lies outside the dark grey track of the planet's shadow. Hmmm.But please note that the exact location of the star is not known. The proper motion between 2000 and 2006, for example, is about 17 milliarcseconds, but with a formal uncertainty of about 11 milliarcseconds. On the scale of the chart above, each square of the dotted grid is 50 milliarcseconds on a side, and the distance between the southern limb of Pluto and the plotted track of the star is about 16 milliarcseconds.
Now, another way to derive the offset between the
track of Pluto's center and the star is to measure
the duration of the occultation.
My photometry suggests that the drop in
light starts at frame index 145 and ends
at frame index 198; the duration of the event
is thus 53 frames.
The prediction for a central occultation,
on the other hand, is 94.9 seconds.
The original text here was: "or, at an average cadence of 1.4 seconds per frame, 71 frames." However, this cadence is incorrect, so the main text now has the proper numbers.Dave's sequence of 333 frames starts at UT 16:17:34 and ends at 16:28:39. That's a duration of 665 seconds. The separation between each pair of successive frames is (665 sec) / (332 intervals) = 2.003 seconds per interval. Thus, we can use a cadence of 1 image every 2.003 seconds. We expect that a central occultation of 94.9 seconds should take (94.9 sec) / (2.003 sec/frame) = 47.4 frames.
Wait a minute! How can the light dim for 53 frames if even a perfectly central pass behind Pluto should require only 47 frames? The answer is (very probably) Pluto's atmosphere: previous occultations have revealed that the atmosphere is dense enough to produce measureable extinction at heights of 50-60 km above the surface. That increases the apparent diameter of Pluto-plus-atmosphere to about 1250 km, which translates into an apparent angular diameter of 0.1144 arcseconds. The duration of a central occultation would then be
      0.1144 arcsec
   -------------------  =  104.3 seconds
   0.001097 arcsec/sec
At the average rate of 2.003 seconds per frame, we expect a central occultation of Pluto-plus-atmosphere would take about 52 frames.
The ratio of durations (see the right-hand position on the figure above) is
    actual duration         s
  -------------------  =  ------  =  cos(θ)
   central duration         r

                            53
                       =  ------   -->  θ = 0 degrees
                            52
Hmmm. The timing information suggests that the occultation was very nearly central. This doesn't agree with my astrometry -- that indicates that Pluto's center passed quite a bit to the side of the star. I don't know how to resolve this discrepancy ...
In theory, if a planet with an atmosphere passes directly in front of a star, the light curve should show a central peak in brightness, due to the refraction of light through the atmosphere of the planet.
Figure 3 from
Elliot and Olkin, Annual Review of Earth and Planetary Science,
May 1996, Vol. 24, Pages 89-123
Dave's video does not show any evidence for such a central peak.
Observations of occultations by Pluto in the past with very high signal-to-noise ratio have in the past shown small "kinks" in the disappearance and re-appearance, due to clouds in the atmosphere. However, the present measurements lack the precision to show any such features.
Should we expect to see any evidence of diffraction phenomena in this light curve? Let's find out. In a document describing diffraction effects during a lunar occultation, we see that the size of fringes projected onto the Earth during an occultation is
fringe size = sqrt ( L * λ )
where L = 30.12 AU = 4.506E12 m is the distance between the occulting body (Pluto) and Earth, and λ = approx 600 nm = 6E-7 m is the wavelength of the light. The fringe spacing computed from these values is about fringe = 1644 m in width.
As Pluto moves in front of the star, the fringes sweep across the ground. How fast do the fringes move? The velocity on the ground is given by properties of the occulting body (Pluto):
 velocity  v  =  (distance from Earth ) * (angular speed)

              =  ( 4.506E12 m         ) * ( 0.001097 arcsec/sec )

              =  ( 4.506E12 m         ) * ( 5.318E-9 radians/sec )

              =  24,000 m/s
Each fringe will sweep past the observer in (fringe size) / (velocity) = approx 0.07 seconds. In Dave Gee's video, with exposure times of 1 second, any fringe effects will be smeared out and invisible.
In order to compare the observations to a model of starlight being absorbed by the atmosphere of Pluto, it is necessary to determine the intensity of the background star alone during the occultation. Here's my best attempt to do so ...
Ideally, one would use images showing Pluto and the background star well separated, taken on the same night as the occultation, to measure the brightness of each object alone. The data which Dave sent me did not include any images taken on June 12 far enough from the time of occultation to show the two objects separately (although Dave has indicated that he has such images). However, he did send a single image, the sum of five 4-second exposures, taken 4 nights later. In this image, the target star and Pluto are _very_ far apart:
Although this image was taken with the same instrumental setup as the images on June 12 (according to the FITS header values), it differs in a way from the images taken during the occultation: it covers the same field on the sky, but has a different aspect ratio: June 12 images are 508-by-489 pixels, while the June 16 composite is 648-by-489 pixels. I couldn't use my standard tools automatically to compare the photometry of objects in the later image with those from the night of the occultation; instead, I had to pick a small number of stars which appear in both images and compare their instrumental magnitudes by hand. Sigh.
The later image is deeper and has a slightly sharper PSF (2.5-2.8 pix FWHM versus 3.5 pix FWHM) than the occultation images. I used a circular aperture of radius 3 pixels to measure objects on both sets of images. I tried using two different sets of objects to determine the instrumental magnitude offset between the ensemble system (night of occultation) and the single deep later image: one was the set of labelled stars shown above, the other a set of bright stars. Each set gave me the same magnitude offset within the uncertainty -- which was about 0.040 mag.
What I found was that, in the magnitude scale of the ensemble solution, Pluto alone had a differential magnitude of 2.912 (+/- 0.043) and the background star 3.825 (+/- 0.048). The values in parantheses are the formal uncertainties in the magnitudes, but I suspect them to be underestimates of the true uncertainties. Translating these numbers into a ratio of intensities, this means that on the night of June 16, Pluto was 0.913 mag brighter than the background star; that's a factor of 2.32 times brighter.
Now, there are two ways we can look at the occultation light curve at this point, as we try to isolate the light of the star.
The difference between these two methods is small; if we follow the first method, we find that Pluto had to be about 3 percent brighter on June 12 than on June 16. I will follow the first option from this point on.
Now, look at the light curve of the event again:
You can see that the combined light of Pluto-plus-star seems to decrease very slightly over the course of the 333 frames. Let's deal with this.
First, I'll convert the measurements from a magnitude scale to an intensity scale with an arbitrary zero-point. Using the intensity values, I looked at mean values during three periods:
                                      linear counts
   frames        when                mean      stdev
 ----------------------------------------------------
   100-140    before occultation    10285      781

   160-180    in center of event     6717      649

   210-250    after occultation      9926      727
 ----------------------------------------------------
The average of the before-event and after-event values is 10105 counts, with an uncertainty of about 750 counts. I will not attempt to correct the slight linear decrease in overall light during the course of the observations.
Using the ensemble differential magnitude of the background star from the night of June 16, and converting to the same linear intensity scale, I find the star has 2951 +/- 127 counts. That means that the brightness of Pluto during the occultation must have been 10105 - 2951 = 7154 counts , with an uncertainty of about 877.
Had I chosen to use the measurement of Pluto's brightness from the night of June 16 at this point, I would have ended up with an intensity of 6842 counts for Pluto alone at this point. The two methods thus agree within the uncertainties....
Okay. I can now convert the observed occultation from differential magnitudes to linear intensity, and then subtract the brightness of Pluto, to yield a light curve of the background star alone during the occultation:
Now, note that I almost certainly didn't compute the contribution of Pluto correctly: during the central portion of the occultation, every datum is below zero intensity. One would expect a set of random fluctuations centered on zero intensity. It's likely, therefore, that my method slightly overestimated the light from Pluto. However, note that the formal uncertainty in the value I derived for Pluto's light is +/- 877 counts on this scale. The amount by which one must correct my over-subtraction in order to yield a mean value of zero intensity during the center of the occultation is somewhat less than this uncertainty.
Added 7/15/2006
Dave Gault sent me additional images: a set of coadded exposures taken on the same night as the occultation, but hours before the event. My job was to use these images -- in which Pluto and the target star appear as separated objects -- to measure the relative brightness of the two; I could then more accurately divide the combined light during the occultation into contributions from Pluto and from the star alone. In the end, I could derive a more accurate light curve of the star alone.
You can see Pluto's motion relative to the stars during the night of the occultation in some of the new images Dave sent me. Below is a sequence of four pictures taken at 2-hour intervals.
The very earliest images in Dave's observations showed Pluto most clearly separated from all other objects. Using the same aperture (radius 3 pixels) and sky annulus (inner radius 10 pixels, outer radius 20 pixels) as I used when measuring the occultation images, I determined the relative magnitudes of Pluto and the target star.
 UT of image     total exp    FWHM    instrumental mag
                time (sec)    (pix)     Pluto    target
----------------------------------------------------------
  10:45            44          3.1      15.107   15.989

  11:00            44          3.1      15.064   15.950

  11:15            48          3.1      15.031   15.919

  11:30            16          2.7      14.951   15.852

  11:45            16          2.9      15.036   15.894
-----------------------------------------------------------
In images taken at UT 11:45, Pluto's light starts to overlap with that of stars, so one cannot measure its light accurately.
Using these measurements, I derive an average difference of 0.883 +/- 0.016 magnitudes between Pluto and the target star. Note that this is a slightly smaller difference than the 0.913 magnitudes I found in an image taken 4 nights later; however, it is within the estimated uncertainties.
This difference in magnitudes implies a ratio of intensities: Pluto is 2.255 +/- 0.033 times brighter than the target star. In other words, when their light is combined, Pluto contributes 0.693 of the total intensity and the star 0.307 of the total intensity.
Now, I went back to my measurements of the combined light of Pluto-plus-star from the occultation and re-analyzed them. As shown in the section above, I assigned an arbitrary intensity of 10105 counts to the combined light of Pluto-plus-star, averaged over periods just before and just after the occultation. With the new ratio of intensities, we can break this total into pieces like so (I assign a 2 percent uncertainty to each contribution, based on the scatter of the relative magnitudes).
    total light   =   10105   counts

     Pluto        =    7001   counts  +/-  140

     star         =    3104   counts  +/-   62
This new value of 7001 counts for Pluto is slightly smaller than the value of 7154 counts I derived in my first attempt.
I then subtracted this constant light from Pluto from all the measurements of intensity during the occultation to make a light curve of the star alone. Note that it looks exactly like the first version in the section above, except for a constant shift of all points upwards by 53 units.
You can grab a table of the measurements below. The format is
          0    16:17:34  2.407      10894      3893
          1    16:17:37  2.498      10018      3017
          2    16:17:38  2.463      10347      3346
where the columns are
Note added 7/17/2006.and updated 7/18/2006.
Dave Gault has done a set of tests on his DSI Pro camera.
He finds, among other things,
- the effective exposure time for these observations was 1.5 seconds
- there is a dead time or image download time of 0.5 seconds.
- the timestamp written into the FITS header (and placed into datafile above) is the end of the exposure
Copyright © Michael Richmond.
This work is licensed under a Creative Commons License.