 Copyright © Michael Richmond.
This work is licensed under a Creative Commons License.
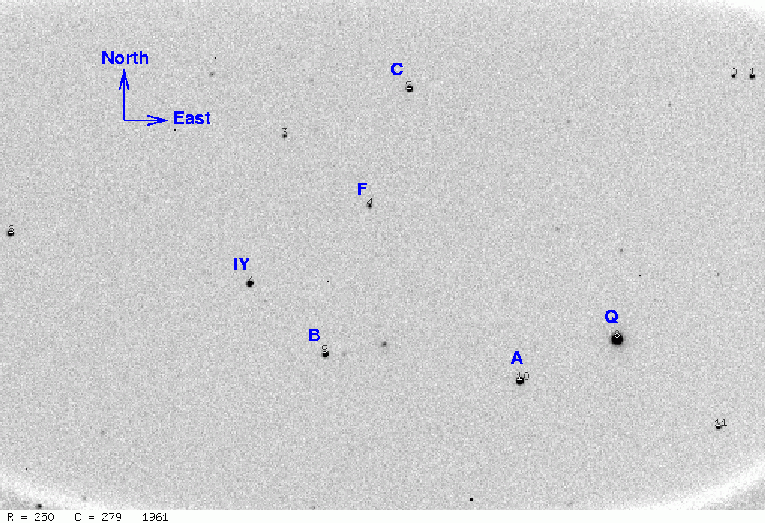
Aperture photometry is the measurement of light which falls inside a particular aperture; usually, we mean a circular aperture of some fixed size. I've chosen some images of the variable star IY UMa, taken on UT Apr 12, 2006, at the RIT Observatory.

Let's practice some aperture photometry. We'll measure the stars in the image above marked A, B and IY. The star marked IY is a known variable star; you can look up information about it by visiting SIMBAD .
Each pair of astronomers should pick ten consecutive images from the list below -- in the examples, I choose only five images, numbers 21 to 25. To download an image, right-click on it and save to the desktop. Then read it into the MIRA program to measure instrumental magnitudes of the four stars.
Write down the instrumental magnitudes for each of the stars in each of the images, making a table like this:
                            Raw magnitudes
      Image      index      A         B       IY
   --------------------------------------------------
      iyuma-021    21     -7.21     -8.20    -7.53
      iyuma-022    22
      iyuma-023    23
      iyuma-024    24
      iyuma-025    25
When you are finished, write your instrumental magnitudes in the space provided on the blackboard.
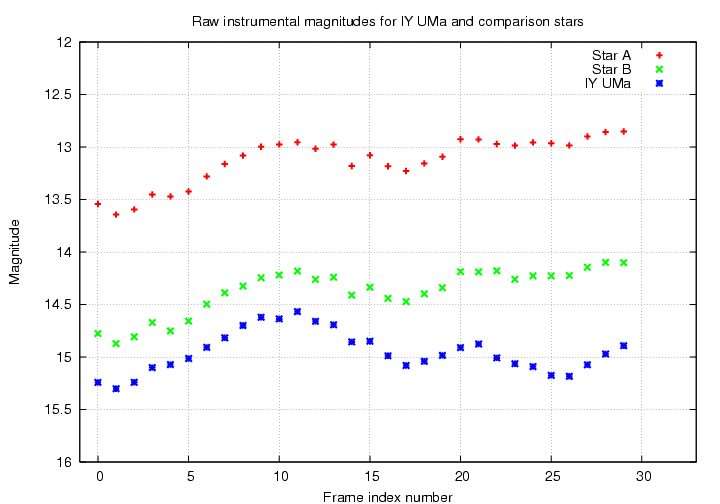
We will use these measurements to make a light curve -- a graph showing magnitude on the vertical axis (with bright at top, so smaller numbers at the top!) and time on the horizontal axis. After each group has provided its measurements, we will plot them all.
Do you see any patterns in the light curve?

All the stars seem to grow brighter and fainter simultaneously.
What could cause these common features?
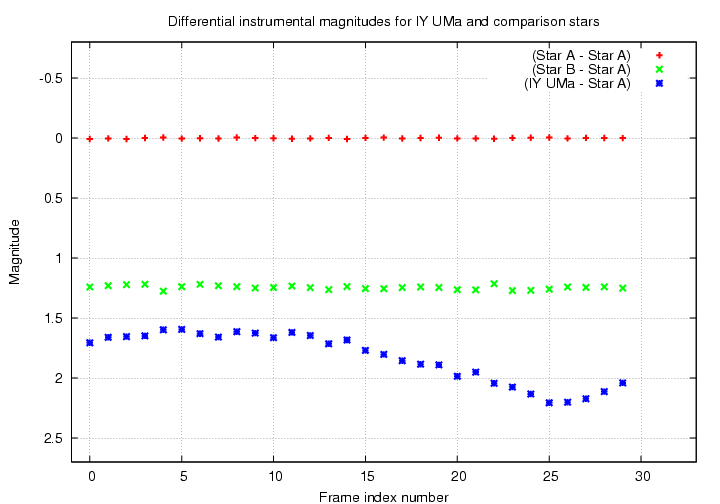
The cure for this symptom is to pick one star as a reference, and calculate the difference between this star and every other star in the field. For example, if you were to pick star "B" as a reference, you would calculate
(A - B) (B - B) (IY - B)
for each image. Then, instead of plotting the raw
magnitude versus image index number (or time)
to make a raw light curve,
plot the differential magnitude
versus image index (or time).
All the common patterns should disappear -- as long
as you picked a good reference star --
leaving only the intrinsic changes of each star.

So, let's try it! Use your raw measurements to create a table of differential magnitudes by subtracting the magnitude of star B from each of the other stars:
                            Differential magnitudes
      Image      index    (A-B)     (B-B)    (IY-B)
   --------------------------------------------------
      iyuma-021    21      0.99      0.00     0.67
      iyuma-022    22
      iyuma-023    23
      iyuma-024    24
      iyuma-025    25
Once again, we will make a light curve for the stars, but this time, we'll use the differential measurements. How will it turn out this time? ...
 Copyright © Michael Richmond.
This work is licensed under a Creative Commons License.