On Apr 11, 2002, EST, a number of people spent time at the RIT Observatory: Matt Aggleton, Michael Richmond Tracy Davis, Brad Conrad, Lara Crigger, George Brown, and Andrew Cutter, plus an entire lab section of the Introductory Solar System Astronomy course. High cirrus came and went during our observations, but never became too thick. We spent time on three projects:
All pictures were taken with the Meade 10-inch telescope, f/6.3 focal reducer, and SBIG ST-8 CCD. We used a "clear" filter for most of the work this night.
We acquired 5 sets of 50 images each of Lictoria. The asteroid should have decent signal in these 15-second unfiltered images.
Tests of the autoguiding facility of the CCDOPS software revealed that it worked properly -- it kept the telescope pointed at a star. Good! However, CCDOPS forces the user to save each autoguided image by hand: one cannot take a sequence of autoguided exposures. Bleah.
Tracy Davis tried the MaximDL software on his laptop. We discovered that it, too, guides the telescope accurately, AND it allows not only sequences of many exposures while guiding, but also permits the user to switch filters within each set. Hooray!
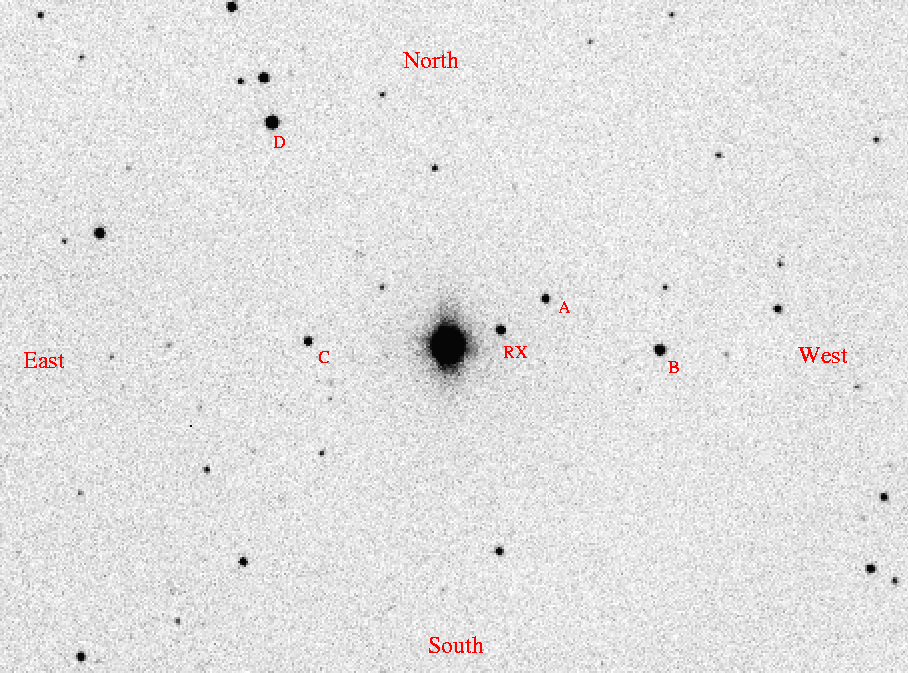
Finally, we turned to the variable star RXJ1643.7+3402, which we'd never observed before at RIT. We took a set of 15-second unfiltered exposures. Here's one example, about 18 by 14 arcminutes.

The very bright star near center is the sixth-magnitude star HD 151087. Just to its northwest is the variable star, marked "RX" on the chart. Also marked are several comparison stars. Two are in the Tycho catalog:
 marked     TYC ID          Bt      Vt        USNO ID
 --------------------------------------------------------------------
   D       2585-1980-1     12.56   11.15      1200-08012023
   B       2585-1631-1     13.78   12.31      1200-08006510
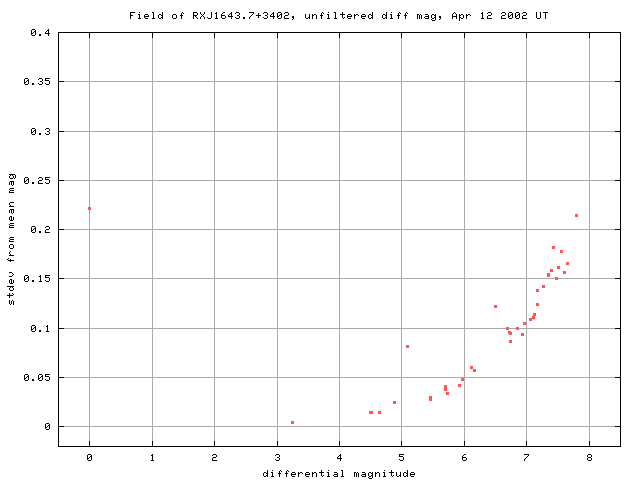
We acquired 150 images over the course of a bit more than one hour. We used an aperture of radius 10.8 arcsec to measure instrumental magnitudes, and subtracted the sky measured in an annulus of radii 19 and 32 arcsec. An inhomogeneous ensemble solution, via the method of Honeycutt (PASP 104, 435, 1992), yields fairly good results, as shown the plot of stdev of differential mag vs. differential mag below:

The variable star is the outlier at about 5.1 in the graph. The saturated sixth-magnitude star is the point at far left. It was not included in the ensemble solution.
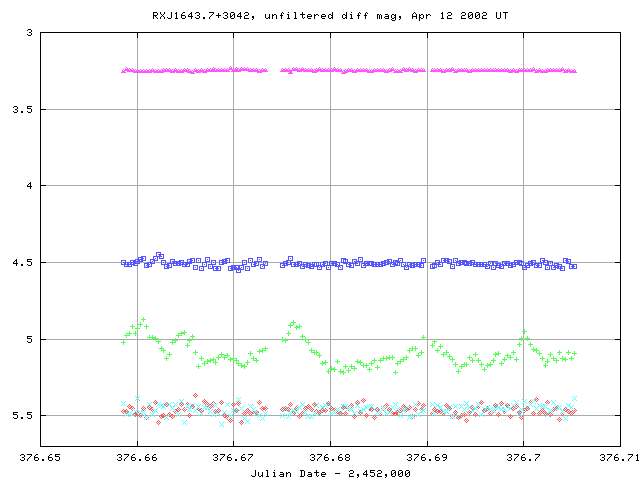
Here are light curves of the variable stars and several comparisons:

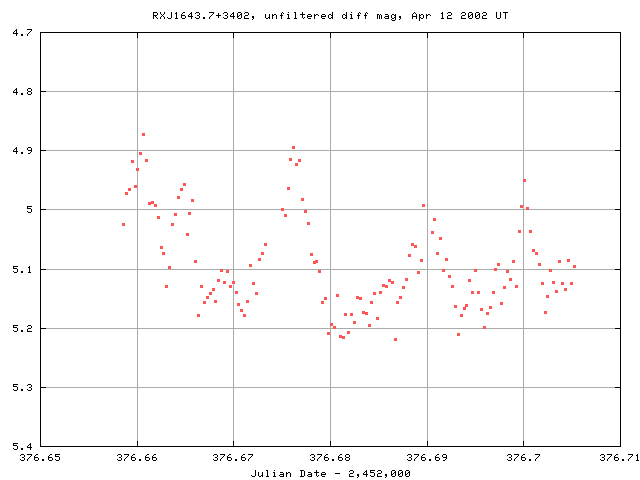
Here's the variable star by itself:

You can download a copy of the differential photometry, measured relative to star "D", below.
The file has some comments at the top, followed by data lines with 4 numbers per line, like this:
Apr_12.15858 2376.65858 2376.66111 1.775
The columns are:
Last modified 4/13/2002 by MWR.