
Image courtesy of NASA, ESA, CSA, STScI
One of the first images from the James Webb Space Telescope (JWST) released by NASA shows the five galaxies of the group known as Stephan's Quintet.
Image courtesy of
NASA, ESA, CSA, STScI
This group of five galaxies has caused quite a bit of confusion and even a bit of controversy over the past few decades. At issue is the question "Are all five galaxies physically close to each other?" The strong tidal features and long tails of several of the galaxies are strong evidence that they are close enough to exert strong forces on each other. However, a different piece of evidence -- redshift -- indicates that one of the five is NOT part of a physical group; instead, it suggests that the leftmost galaxy in the picture above, named NGC 7320, is far closer to us than the other four, and just happens to appear close to them in the sky by chance.
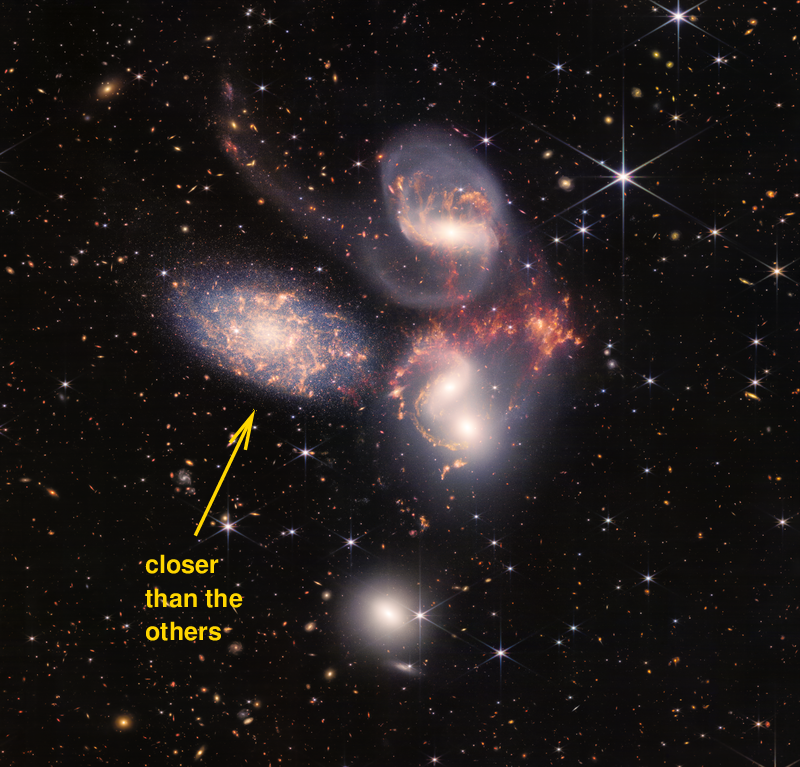
I think it's very nice that this press-release image from JWST, all by itself, provides another piece of evidence that NGC 7320 is closer to our own Milky Way than all the others. In fact, one can use measurements from this image to determine the distance to this galaxy in a relatively simple manner.
Let's do it!
Let's concentrate on just one portion of the galaxy in question, so that we can examine properties of the image more closely. Using the interactive version of NASA's image, one can zoom in and see more detail; we'll choose the area outlined in gold below.
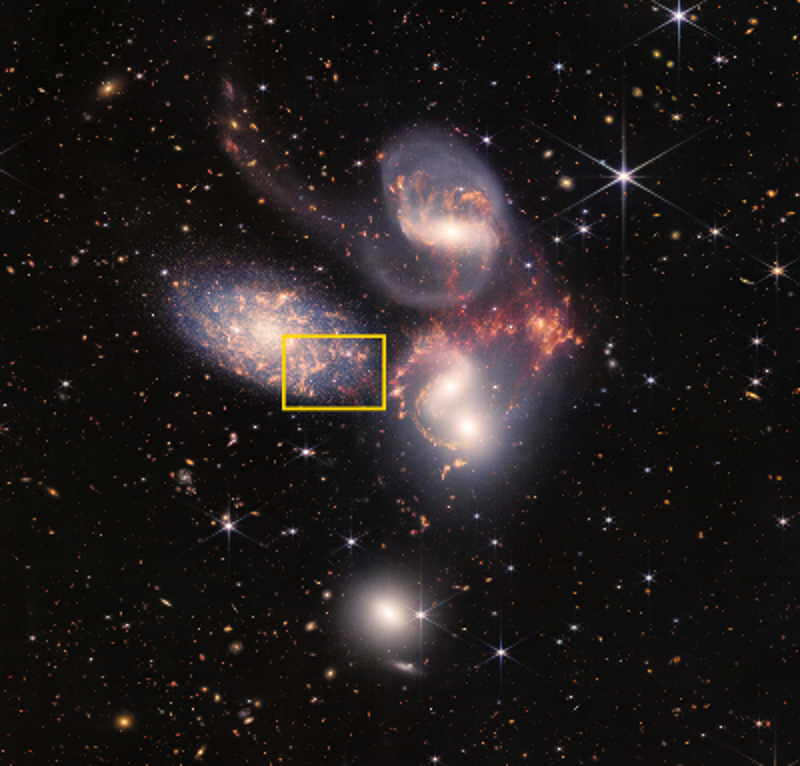
Here's the closeup version. What can you see in this region?
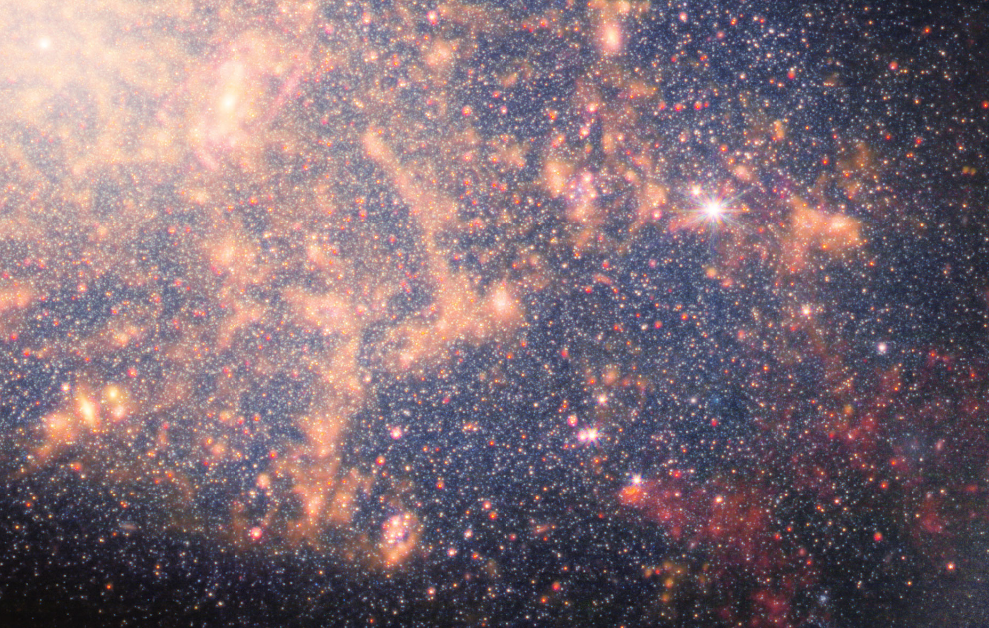
Stars! Lots and lots and LOTS of individual stars in the galaxy NGC 7320. The majority of them look relatively faint and either blue-ish or white-ish; there are a much smaller number of somewhat brighter and much redder objects.
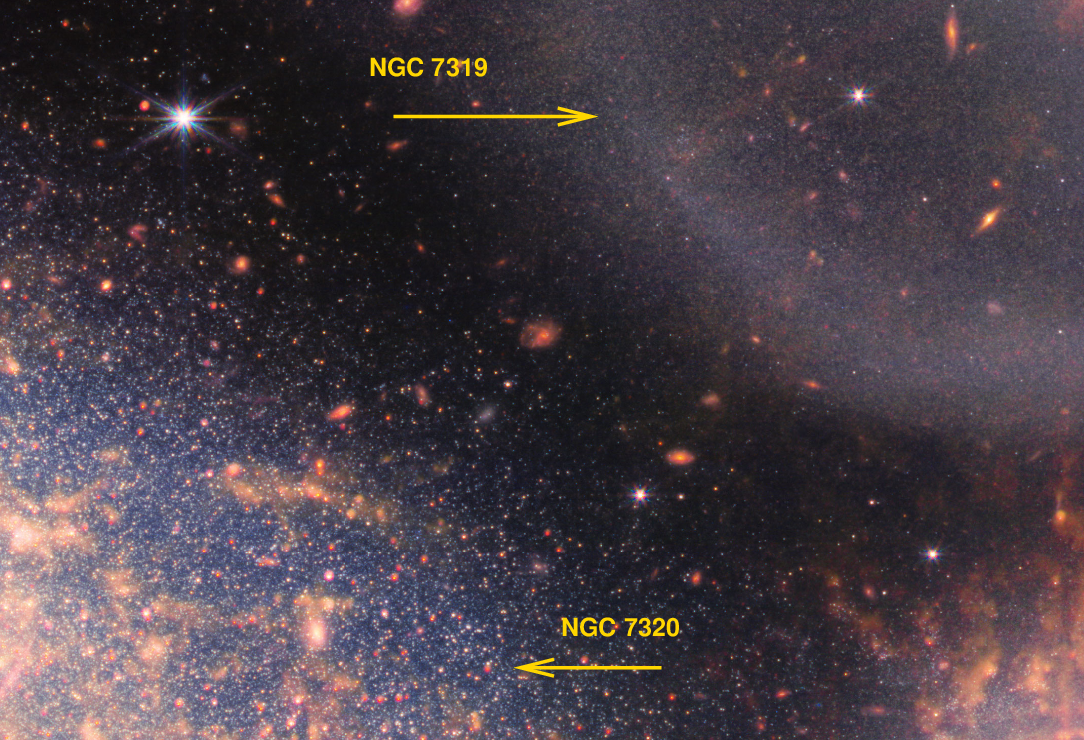
If we zoom in on the other galaxies in this image -- for example, the galaxy near the bottom -- we don't see a similar set of individual stars, easily distinguished from each other and far above the general background. Instead, the light from these other galaxies appears much more diffuse, a consequence of its production from a combination of mostly unresolved stars. It is possible to resolve -- barely -- some individual stars in the topmost galaxy in the image, NGC 7319, but they are much fainter, more indistinct, and packed much more closely together. Compare the appearance of these two galaxies in the closeup below.
So, just looking at this image gives us a very strong piece of evidence that NGC 7320 is much closer than the other galaxies in Stefan's Quintet. But that's a qualitative statement. Can we make it into a quantitative statement?
Yes! It turns out that a careful measurement of the apparent brightness of these resolved stars in NGC 7320 will allow us to compute the distance to the galaxy to a reasonable precision. Let's see how it's done ...
We'll begin by leaving the observations for a moment and turning to theory. Over the past century, astronomers and physicists have figured out how stars work: how they generate energy in their cores, how that energy works its way through the interior of the star and is emitted into space, and how the properties of a star change over millions and billions of years. The topic of stellar structure and evolution is a big one, so I'll describe just the tiny bit that we need to know for our distance-measuring goal. You can find more information in any number of good books and websites; for example,
Imagine that a VERY large cloud of gas collapses due to gravitational forces, with each particularly little dense region turning into a new star. These new stars will span a wide range of masses and sizes: some may be roughly the same mass as the Sun, a few may have more mass, but the great majority will contain less mass than the Sun. For simplicity's sake, let's pretend that they all form at exactly the same time. Theory predicts (and observations confirm) that these very young stars will have a simple relationship between mass, luminosity, and temperature. You can see it clearly in a Hertsprung-Russell or "HR" diagram, which plots luminosity as a function of temperature.
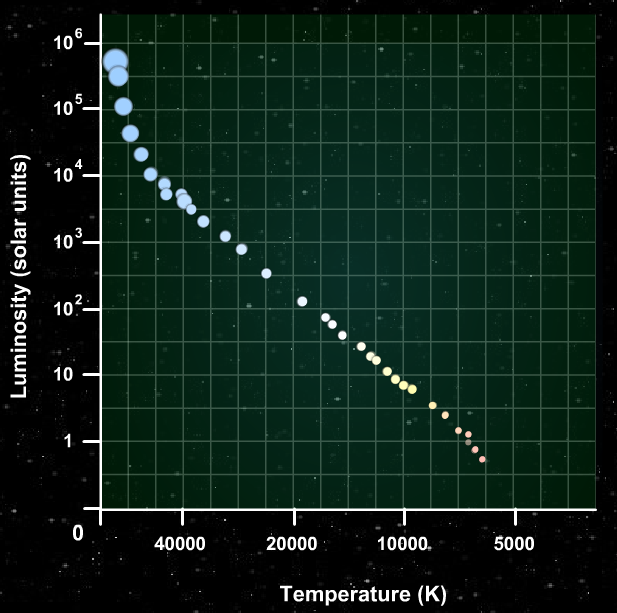
We call the diagonal line along which these newly born stars lie the main sequence.
  Q:  Suppose this group of stars were located very, very far
         from the Earth.  If we were able to take a picture
         of the group, what color would the brightest stars be?
A rather complex web of physics causes the high-mass stars to run through their fuel more quickly than the low-mass ones. After just a few tens of millions of years, the stars with highest mass will start to run out hydrogen in their cores, and -- following another long and complicated set of actions -- evolve off the main sequence. They grow cooler and slide to the right in the HR diagram. (Their original positions are shown faintly on this graph -- consider those their "ghosts", and ignore them for this discussion).
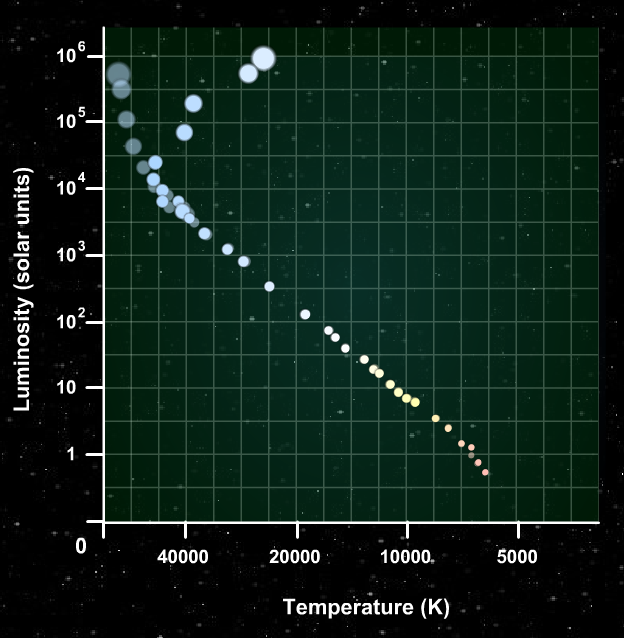
Eventually, those most massive stars run out of fuel completely and disappear, often in spectularly violent displays.
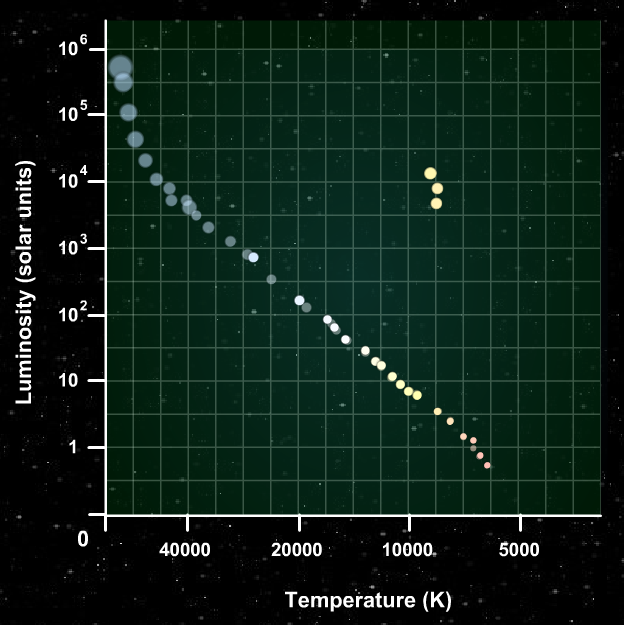
After hundreds of millions, or billions, of years, less massive stars begin to run out of fuel, and evolve off the main sequence. These stars change their size and temperature as they evolve, growing into very large and very cool objects. We often call them "red giants", for obvious reasons. As the diagram shows, they end up in the upper-right corner of the HR diagram. Those stars which remain on the main sequence are all relatively cool and dim.
  Q:  Suppose that we took a picture of this distant group
         of stars after it had aged for billions of years.
         What color would the brightest stars be now?
So, point number one: if we examine a galaxy which is sufficiently old, the brightest stars we will detect are the red giants.
Yes, yes, there are a very few types of uncommon stars, such as luminous blue variables, which might be as bright as the red giants; and, of course, transient sources such as novae and supernovae will be much brighter for a short time. However, the brightest stars that we are likely to detect in large numbers are the most luminous red giants.
But that's not all. There's a second aspect to this question of the brightest stars we will see in a galaxy. In order to illustrate this second point, let me move from a general discussion of stellar evolution to a very specific one. In place of the schematic HR diagrams shown earlier, I'm going to make an HR diagram for a very specific set of stars. The MIST project at CfA has generated models of stars following detailed stellar evolution codes, and then performed synthetic photometry on those models to calculate how such stars would appear when observed by specific telescopes; one of the instruments they chose is JWST.
I chose their model of stars with a metallicity of [Fe/H] = -0.5, which is not too dissimilar to the Milky Way or M31. Using their models, one can make an HR diagram showing the positions of stars in color and magnitude at various stages in their lives. In the diagram below, the red symbols show stars at an age of 10 million years, the green symbols stars at 100 million years, and so on. I've not shown the evolution of stars beyond the red giant branch, as they very quickly fade to levels we could not detect in distant galaxies.
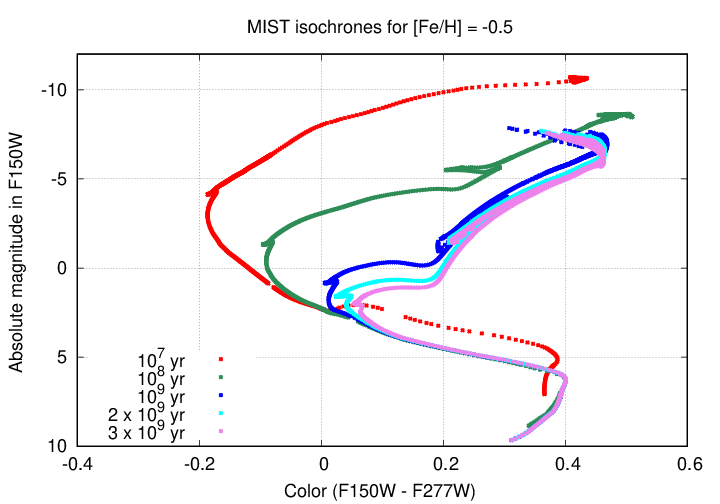
Note the general trend: as stars age, they disappear from the upper-left region (the high-mass end of the main sequence) and move to the upper-right area (the red giant branch). The pace of changes slows, too: note how large the difference is between the red and green symbols, representing just 90 million years of evolution, compared to the difference between the cyan and pink symbols, which are separated by 1000 million years.
Our second important lesson lurks in the upper-right portion of this diagram. Let's zoom in on that region of the graph to see it more clearly.
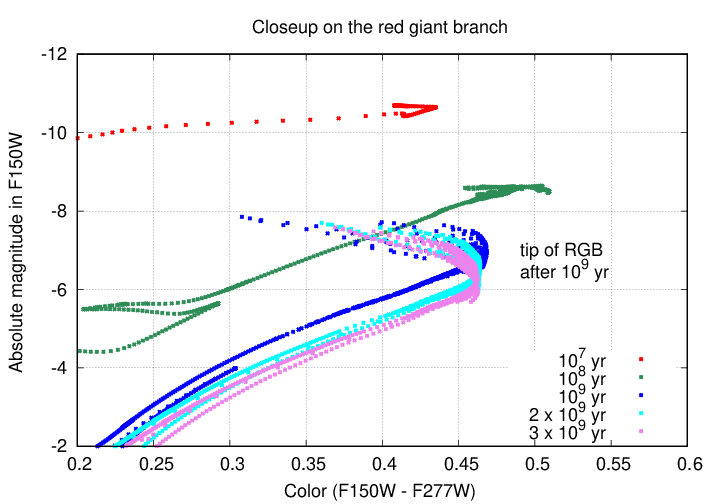
How bright are the brightest red giants in a group of stars? Well, the answer depends on their age.
Aha! If we wait long enough -- say, about 1 or 2 billion years -- then the Tip of the Red Giant Branch (TRGB) reaches a nearly constant value. Yes, it will fade a bit as time moves on, but only by small amounts.
In other words, point number two: if we look at the brightest stars in a galaxy which is anywhere over 1 billion-ish years old, which we might call a "middle-aged" galaxy, then we can expect the brightest stars to be red giants with a luminosity which doesn't change much over time. Models of stellar evolution, and measurements of the red giants in our own Milky Way and Local Group galaxies, can tell us what that luminosity is.
  Q:  Based on these stellar models, if we were to observe
           a middle-aged galaxy with the JWST through
           its F150W filter, what would the absolute magnitude
           of its brightest stars be?
Right! We'd expect the brightest stars in that galaxy to be red giants at the tip of the red-giant branch, with an F150W absolute magnitude of MF150W = -6.5 or so.
By simply looking at the JWST image of Stefan's Quintet, we were able to deduce that NGC 7320 must be much closer than the other galaxies; but with this extra information on stellar evolution, we can make a quantitative statement. Let's estimate the distance to this galaxy!
In order to do so, we'll need to find some measurements of the stars in NGC 7320. A good place to find real JWST data -- not just pretty pictures -- is the MAST Portal. Here one can look for images or spectra acquired by JWST, and many other space missions as well, both raw and calibrated. But wait -- there's more! In many cases, one can also find catalogs of objects in those images, or lines detected in those spectra. These catalogs may not be perfect, or properly designed for every sort of scientific project, but they are good enough for many simple purposes.
I grabbed catalogs for objects detected in JWST images of NGC 7320 taken with the Near-Infrared Camera (NIRCam) through two particular filters:
I started by choosing only objects which fell in the outer regions of one quadrant of NGC 7320, roughly the middle and right-hand portions of this area:
I chose objects which were detected in both filters, and which had shapes consistent with unresolved, or "point", sources. The result was a set of about 1400 objects with measurements in both passbands. The color-magnitude diagram of these objects is a bit messy. As usual, hot objects are to the left, cool objects to the right, bright stars at the top, faint stars at the bottom.
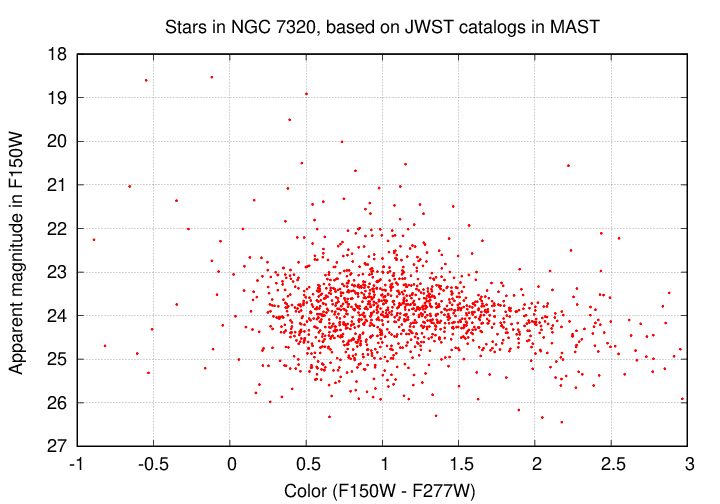
For our purposes, the important quantity is the vertical position of objects: their apparent magnitude in the F150W passband.
  Q:  What is the apparent magnitude of the very brightest stars?


  Q:  What is the apparent magnitude at which a WHOLE BUNCH of stars
            begins to appear?
Observations of nearby galaxies, and simulations of stellar evolution, both suggest that stars at the Tip of the Red Giant Branch (TRGB) should be very numerous -- much more common than a few rare types of supergiant stars. One way to identify the location of the TRGB in apparent magnitude is to examine a color-magnitude diagram visually and just eyeball it, as we did. But a better method is to make a histogram of the apparent magnitudes. The TRGB corresponds to the location in this histogram at which the number of stars increases most rapidly.
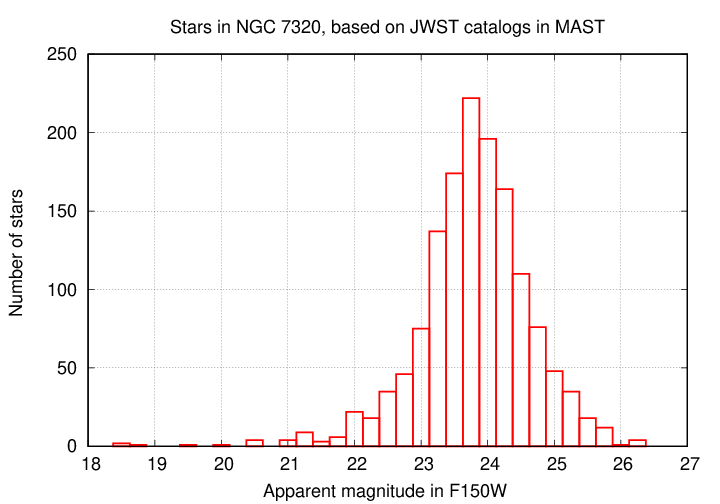
Q: At what apparent magnitude does this histogram increase most sharply?
This approach might be good enough for some purposes (such as ours), but if one wants to do the best possible job, one might follow the methods used by the Carnegie-Chicago Hubble Program. In their paper on the distance to NGC 1365 via the TRGB (Jang et al., ApJ 852, 60, 2018) (local) , they apply a Sobel filter to the histogram, which emphasizes the change in successive values. The magnitude at which this Sobel filter reaches its positive peak corresponds to the magnitude at which the number of stars is increasing most rapidly. Let's try that.
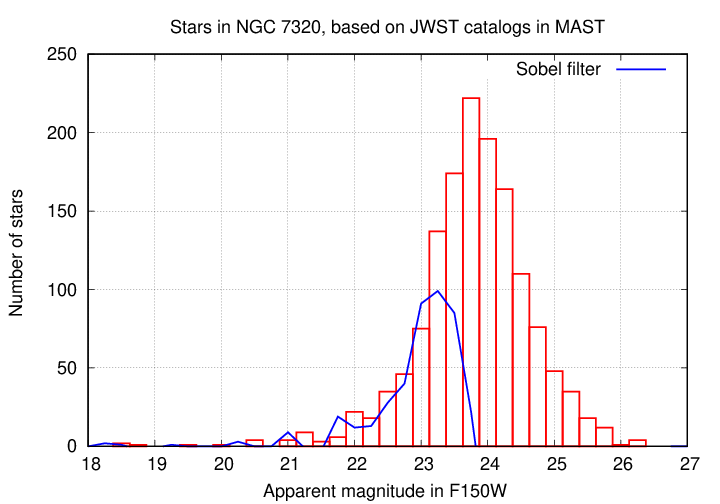
  Q:  At what apparent magnitude does the Sobel filter reach its
          maximum value?
But now, we know TWO magnitudes for these stars at the TRGB:
That means that we can compute the distance modulus to the galaxy:
     distance modulus  =    apparent_mag  -  absolute_mag


     distance modulus  =         m        -      M


     Q:  What is the distance modulus (m-M) to NGC 7320?
The distance modulus, in turn, can be used to compute the distance to this galaxy using the following relationship:
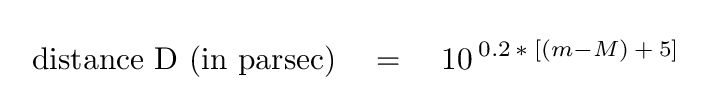
      What is the distance to NGC 7320 based upon our estimates
           of the absolute and apparent magnitudes of stars?
Is that right?
Well, one way to find out is to look up the distances measured by other astronomers in some reputable catalog or database. A good one is the NASA Extragalactic Database (NED). Let's look there (click on the image below to activate).
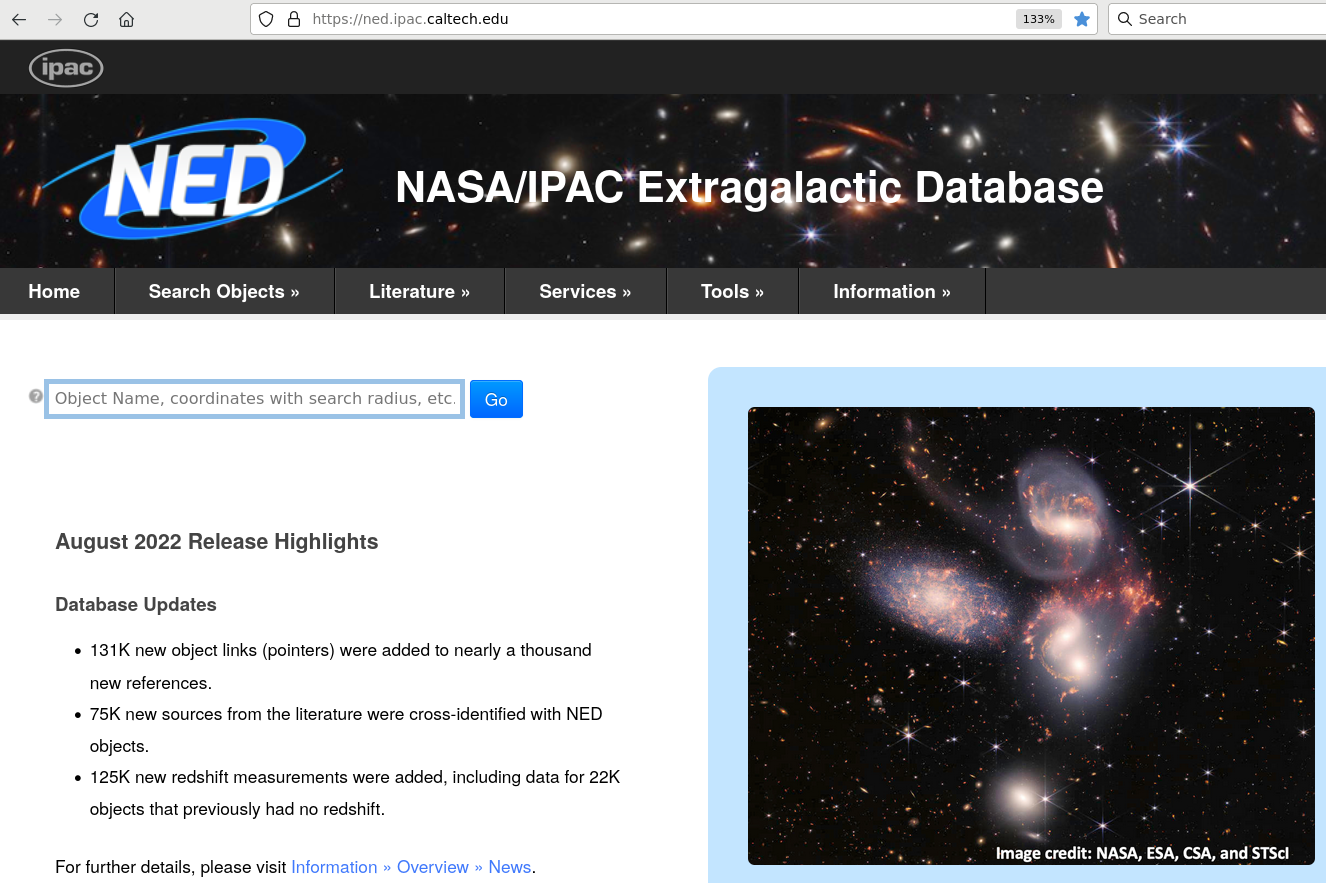
How close were our estimates?