 Copyright © Michael Richmond.
This work is licensed under a Creative Commons License.
Contents
As you may have heard, there is some evidence that the universe is expanding: not only are most galaxies flying away from each other, but their speed appears to increase with their distance from us.
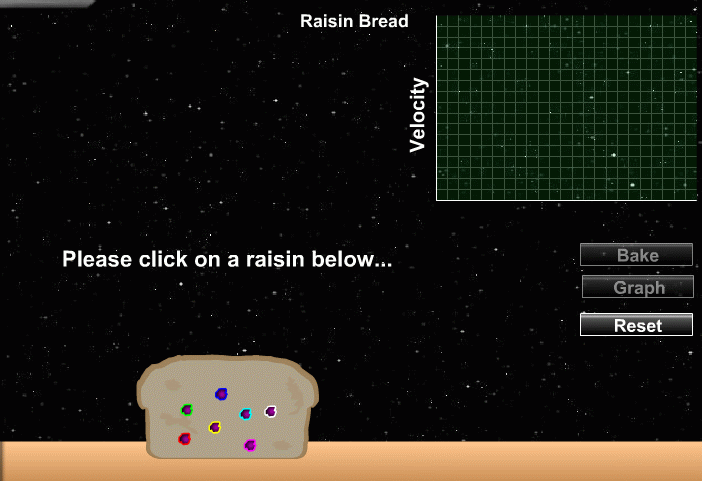
Why is that evidence for expansion? Well, forget about galaxies for a moment, and consider a humble lump of dough with raisins in it. Suppose that we put that dough into a warm place and let it rise for a few hours. The animation below measures the distance between raisins as the dough expands.
As you can see, all the raisins move away from each other. Close neighbors recede slowly, but very distant raisins move away each other at a rapid pace. There seems to be a linear relationship between velocity and distance. It turns out that this sort of connection between velocity and distance is a general property of expanding systems.
So, back in the nineteen-twenties, astronomers were just starting to point their big new telescopes (such as the Mount Wilson 60-inch and 100-inch reflectors) at faint little galaxies. Among them were Edwin Hubble and Milton Humason.
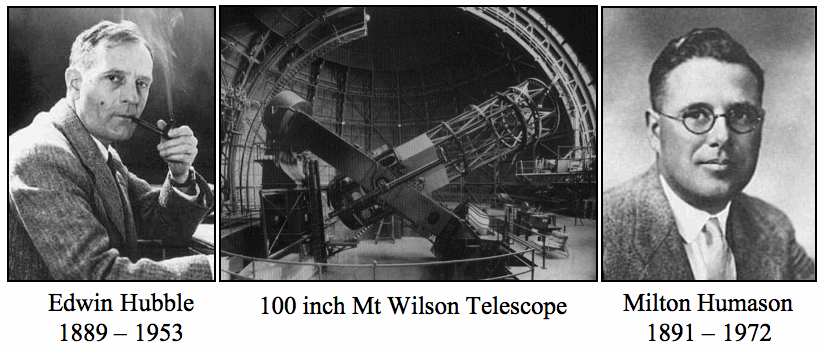
Many of the crucial measurements were taken with the 100-inch (2.5 meter) telescope at Mount Wilson. As an example, consider the spectrum of NGC 7619. Humason took two photographs:
During the past year two spectrograms of N. G. C. 7619 were obtained with Cassegrain spectrograph VI attached to the 100-inch telescope. This spectrograph has a 24-inch collimating lens, two prisms, and a 3-inch camera, and gives a dispersion of 183 Angstroms per millimeter at 4500. The exposure times for the spectrograms were 33[h] and 45[h], respectively.
Based on the two spectra, Humason estimated the velocity of NGC 7619 to be 3828 and 3754 km/s; he found a weighted average of 3779 +/- 100 km/s.
Below are samples of other spectra taken by Humason with the 100-inch telescope and similar equipment.
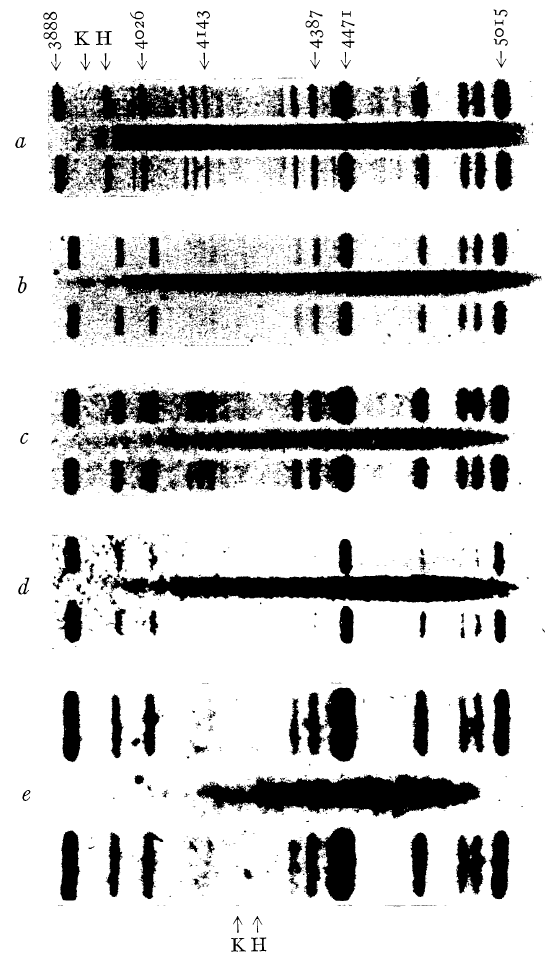
Figure taken from
Humason, ApJ 74, 35 (1931)
Edwin Hubble concentrated on estimating the distance to galaxies, using several different methods, such as
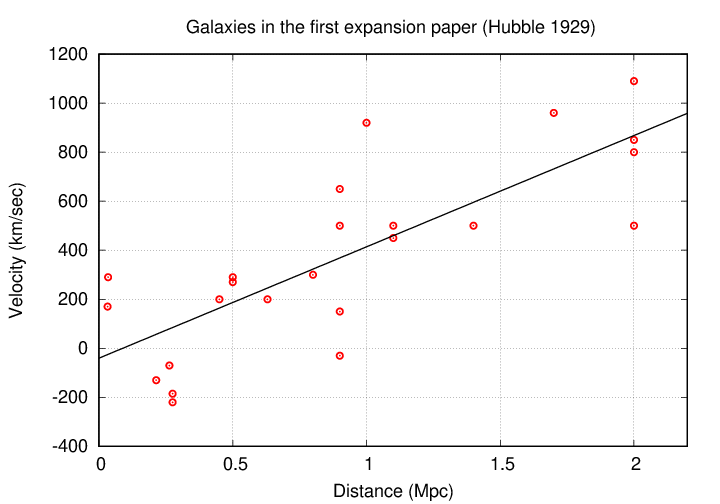
Hubble then compared these distances to the radial velocities of those galaxies. It was slow, hard work: after a decade, the number of galaxies with even very rough values for both distance and velocity only about two dozen. But Hubble's exercise revealed -- well, look for yourself.
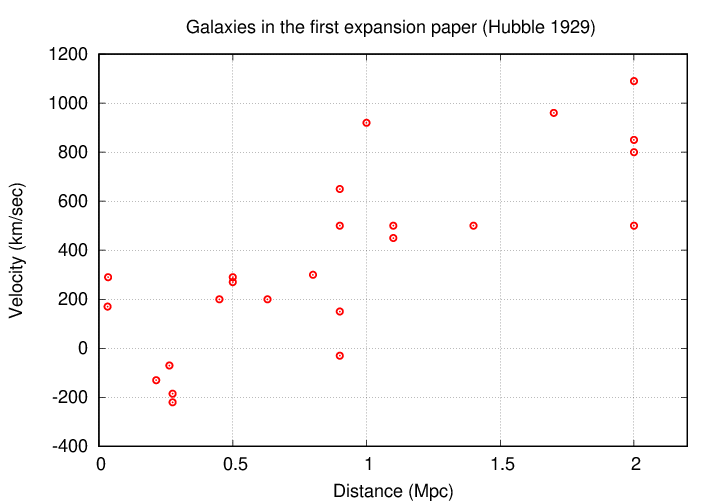
Data taken from
Hubble, PNAS, 15, 168 (1929)
Do you see a linear relationship between velocity and distance? Perhaps it will help if I draw this line for you.
Data taken from
Hubble, PNAS, 15, 168 (1929)
Q: What is the slope of this line?
The slope is

This slope has come to be known as the "Hubble constant," denoted a capital H with a zero subscript. Back when Hubble first defined it, in 1929, its value was roughly 500 km/sec per Mpc.

If one can measure both the position and velocity of objects in an expanding system, then another property of the system is revealed. Take a look at this data on the motion of a bunch of cars in a cross-country race.
  Car              distance from start              speed
                         (miles)                (miles per hour)
---------------------------------------------------------------------------
   A                       60                       30

   B                      120                       60

   C                      180                       90
---------------------------------------------------------------------------
Can you use this information to figure out how long ago the cars must have started moving?
Q: How long ago did the race start?
One approximate answer is that the race must have started about two hours ago. If we assume that the cars have been moving with a constant speed, then

Now, of course, if the speed of an object increases with its distance, then this assumption of a constant speed is incorrect; but at least this provides an answer in the general ballpark.
But -- hey! That ratio of distance to speed is very similar to the Hubble constant. In fact, the Hubble constant is the same ratio, but turned upside-down.

And that means that one way to estimate the age of the universe -- as least roughly -- is simply to turn the Hubble constant upside-down.

There's one complication: the way we compute the Hubble constant is to compare a speed, measured in km/sec, with a distance which is measured in Mpc, not in km.

In order to perform this calculation of age, we need to put the distance in the same units used to measure velocity -- kilometers. So, using the handy fact that one Mpc is approximately 3.1 x 10¹⁹ km, we have

Okay, let's try using this value of H0 to compute an approximate age of the universe.
Q: What age of the universe corresponds to this value of H0?
The answer is 6.2 x 10¹⁶ seconds, or about 2 billion years.
In the nineteen-thirties and -forties, scientists were somewhat dissatisfied. There were a number of different methods for estimating the ages of very old things, but they did not all agree as well as we hoped. For example, in 1936, W. E. Harper mentioned the following:
If the universe was only 2 billion years old, that would cause some problems. How could rocks or meteorites (or stars) be older than the universe?
R. C. Tolman described the same puzzle more than decade later. The Earth, solar system, and stars were clearly more than 3 billion years old, and perhaps as much as 7 billion; so how could the the universe be so much younger? Tolman explained that the simplest age based on expansion, computed by taking the inverse of the Hubble constant, was too simple; more realistic models of the expansion of the universe could produce ages up to 3 or 4 billion years. But it was still hard to find a way to make the cosmological age consistent with those determined by other methods.
Finally, in the 1950s and 1960s, astronomers found two keys to the puzzle: populations, and confusion. Let me explain.
The Hubble constant is based on a comparison of velocities and distances. The velocities measured by Slipher, Hubble and others in the 1920s and 1930s are pretty darn good; we find similar values nowadays. But the distances had some serious errors. One involved the use of pulsating variable stars.
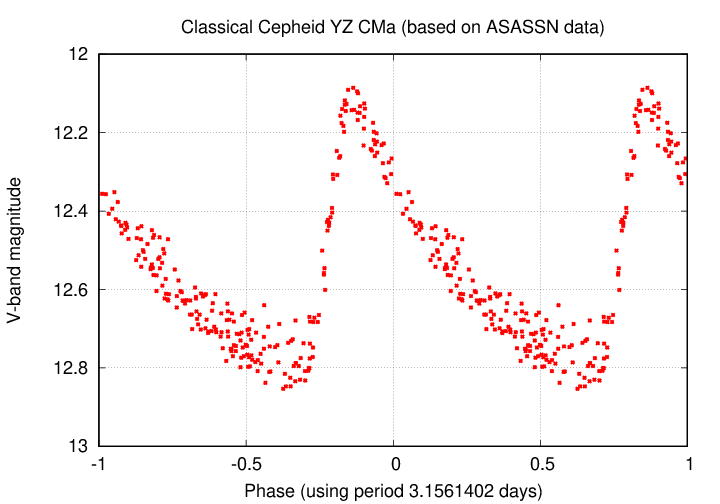
You've probably heard of Cepheid variable stars. If not, you might read an explanation from a previous ASRAS talk. Cepheids expand and contract, growing hotter and cooler, brighter and dimmer, like this:
Thanks to
ASASSN Variable Stars Database!
Cepheids are very useful, because they have the wonderful property that their absolute magnitude depends on their period. If one can measure their period -- which is pretty easy -- then one can compute their absolute magnitude. And by comparing that absolute magnitude to the observed apparent magnitude, one can determine the DISTANCE to a Cepheid. This connection was first discovered by Henrietta Leavitt.

Image courtesy of
space.com
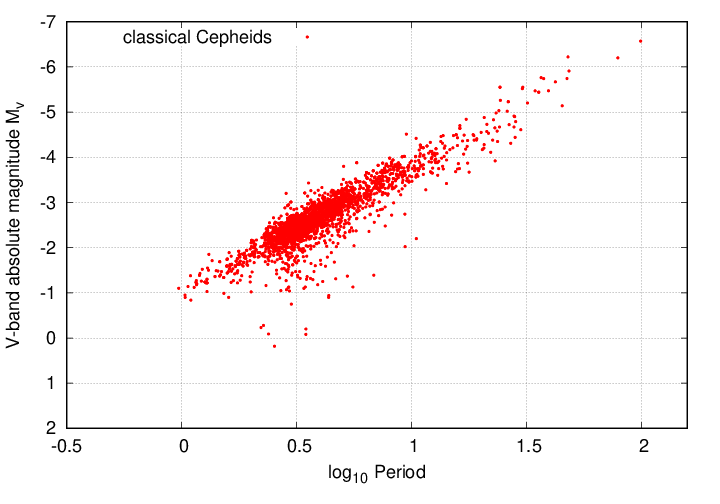
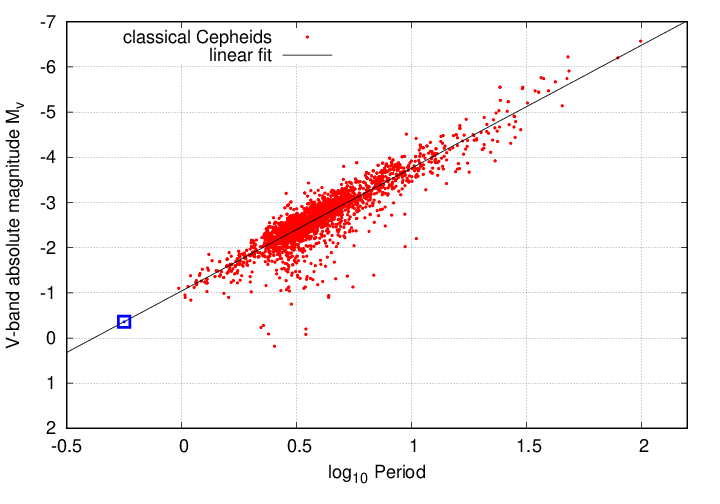
Below is an illustration of that relationship, using measurements of Cepheid stars in the Large Magellanic Cloud. The horizontal scale shows the period (well, the logarithm of the period, but close enough), and the vertical scale shows the absolute magnitude of the star in the V-band.
Cepheid data from
Inno et al., ApJ 832, 1761 (2016)
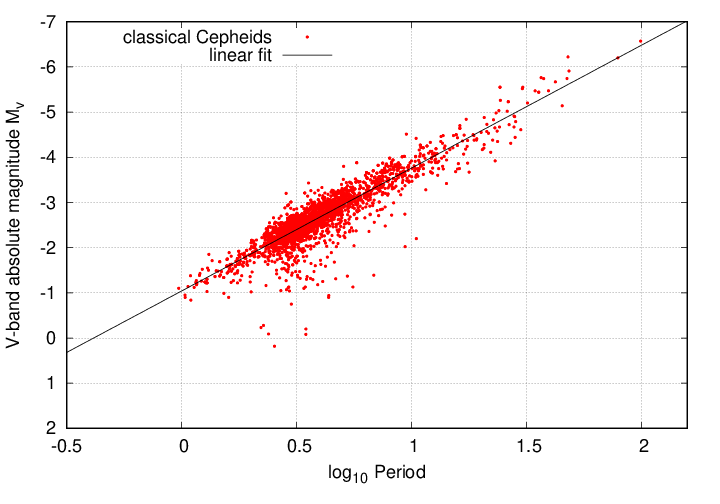
It's clear that stars with short periods (on the left) have relatively faint absolute magnitudes, while those with long periods (on the right) are much brighter. As you might expect, astronomers fit a straight line to this data, allowing them to compute the absolute magnitude of any pulsing star with a measured period.
Cepheid data from
Inno et al., ApJ 832, 1761 (2016)
Cepheids typically have periods of a few days to twenty or thirty days. Another variety of pulsating star are the RR Lyrae. Their periods are shorter, generally about 0.5 to 0.7 days, and they are less luminous. RR Lyrae are more common than Cepheids in our galaxy, and so some of them are members of clusters in our neighborhood of the Milky Way.
So, astronomers had two sets of stars which they could use for measuring distances:
And, as far as people could tell in the 1930s and 1940s, all these pulsating stars obeyed the same relationship between period and luminosity.
Cepheid data from
Inno et al., ApJ 832, 1761 (2016)
In the autumn of 1943, as a wartime blackout dimmed all the lights in Los Angeles, Walter Baade used the 100-inch telescope on Mount Wilson to take a set of images of the Andromeda Galaxy and its companions. Thanks to his very careful observing procedures, the dark skies, and red-sensitive emulsion, he was able to detect -- for the first time -- many individual stars in these distant galaxies. You can see them in the picture reproduced below.
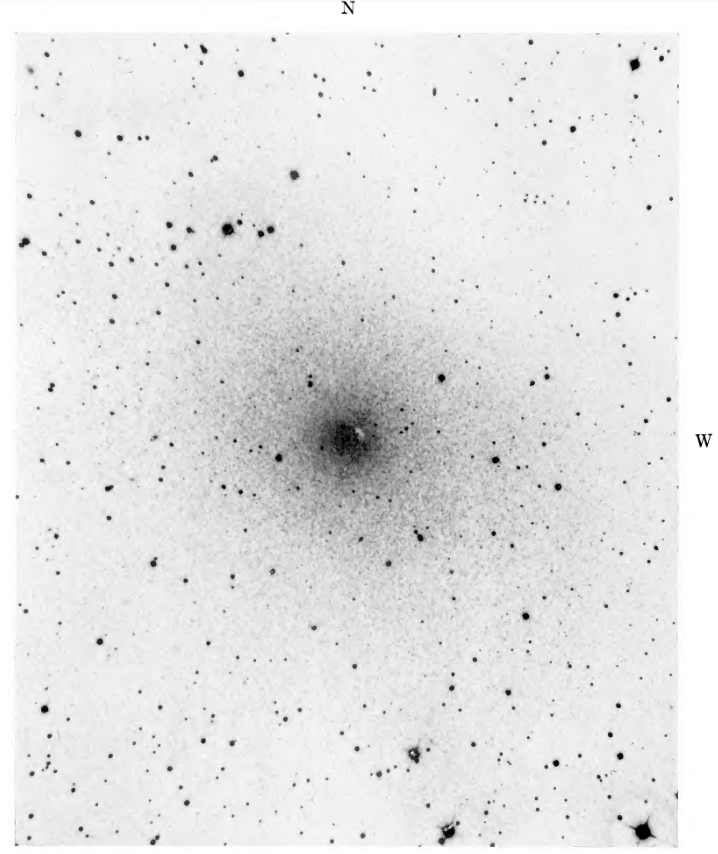
Plate VI of NGC 185 from
Baade, ApJ 100, 147 (1944)
This was unexpected and exciting, because it showed that the brightest stars in this galaxy were red (and not blue). The brightest stars in the Milky Way are the young, hot, massive O and B supergiants. But those stars appeared to be missing in Andromeda and its companions.
Eventually, astronomers figured out that galaxies were composed of different types of stars.
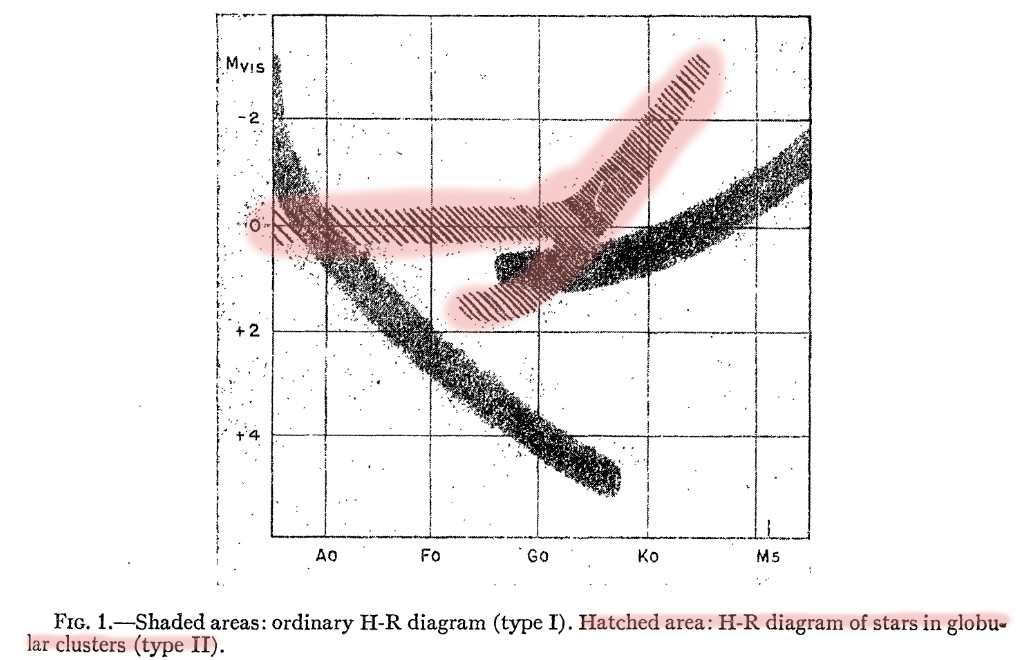
Figure 1, slightly modified, taken from
Baade, ApJ 100, 137 (1944)
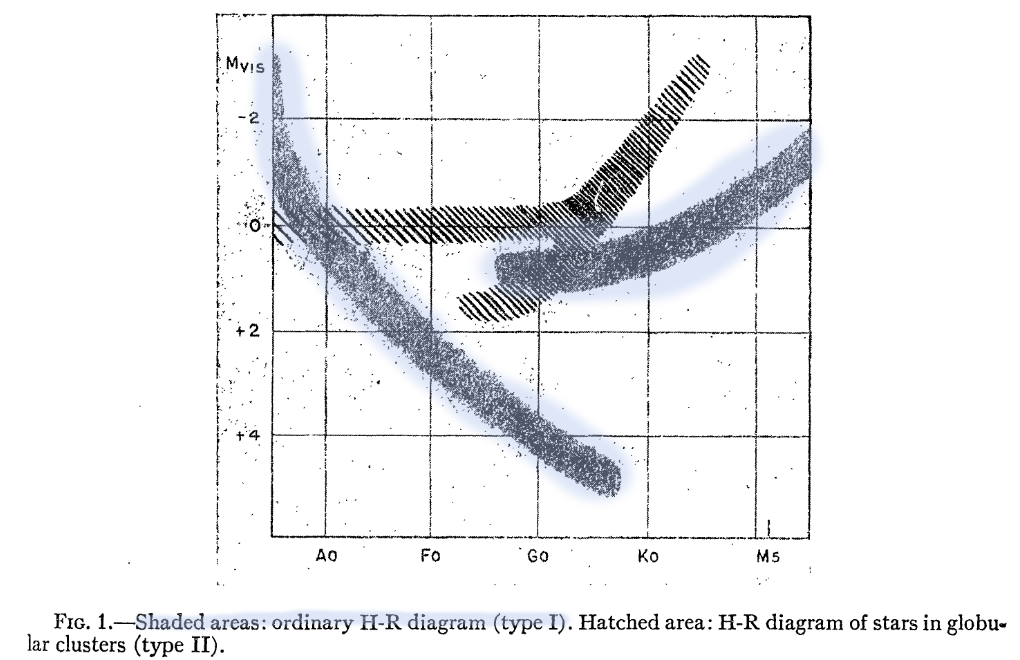
Figure 1, slightly modified, taken from
Baade, ApJ 100, 137 (1944)
"So what?" one might ask. "What does this have to do with the age of the universe?"
The point is that the two main distance indicators, RR Lyrae stars and Cepheids, were members of two different populations.
Due to their differences in age and metallicity, the physical processes inside these classes of stars were not the same; and that meant that they didn't necessarily have to follow the same period-luminosity relationship.
During the 1950s, astronomers realized that their measurements of the magnitudes of RR Lyr stars weren't quite right. Improved estimates of the absolute magnitudes of these stars showed that they were FAINTER than previously expected.
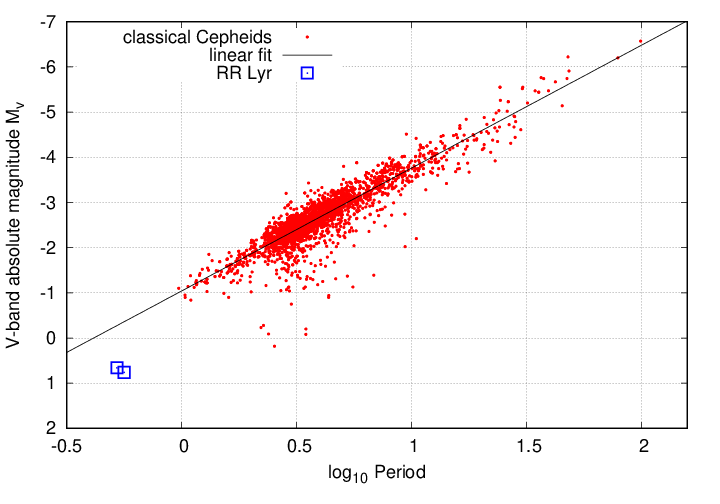
Cepheid data from
Inno et al., ApJ 832, 1761 (2016);
RR Lyr data from
Hawley et al., ApJ 302, 626 (1986)
and
Mureveva et al., MNRAS 481, 1195 (2018)
Moreover, a somewhat rare class of pulsating stars found in globular clusters, which looked similar to ordinary Cepheids in many ways, turned out to follow a similar period-luminosity relationship -- but with a FAINTER (again) zeropoint.
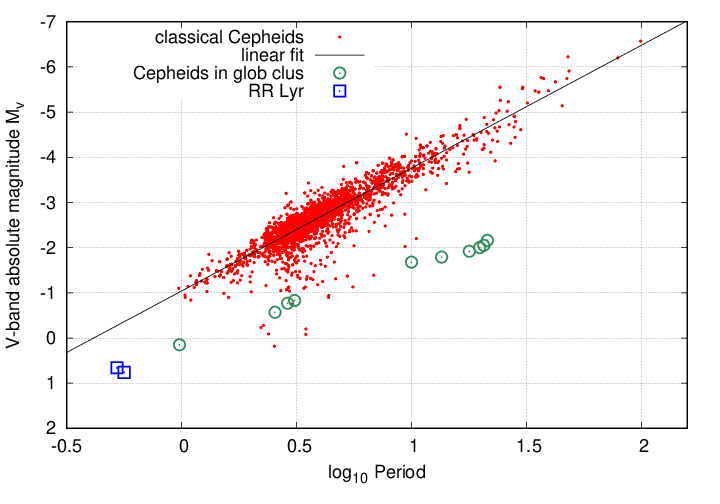
Cepheid data from
Inno et al., ApJ 832, 1761 (2016);
RR Lyr data from
Hawley et al., ApJ 302, 626 (1986)
and
Mureveva et al., MNRAS 481, 1195 (2018)
Type II Cepheid data from
Pritzl et al., AJ 126, 1381 (2003)
The bottom line was that astronomers had to re-compute distances to Andromeda and other galaxies. They had used RR Lyr stars as the starting point of their calculations -- and so, since RR Lyr were now known to be FAINTER than previously assumed, that meant that the magnitudes of all the Cepheids were now BRIGHTER than previously assumed. And since the Cepheids were now known to be more luminous, by about 1.5 magnitudes, that meant that their host galaxies must be MORE DISTANT.
In other words, suppose you go out on Halloween for trick-or-treat. You see a light coming toward you from the south, and assume it's your kid brother with his flashlight. "Based on the little bulb in his flashlight, he must be about 50 yards away," you think.
Then someone tells you that, no, that light isn't produced by a flashlight; instead, it's the headlight of an oncoming train. "A train?! But the light is pretty faint. That train must be 5 miles away."
This realization that the RR Lyr stars and classical Cepheids did NOT obey the same period-luminosity relationship caused all distances to galaxies to increase by a factor of 2, just like that.
And that meant that the Hubble constant, which is defined as

DECREASED by a factor of 2, just like that. The value of the Hubble constant shrinks from around 500 to around 250 km/s/Mpc.
But wait! There's more!
There is a second reason that Hubble's original estimate of the expansion rate of the universe was so much larger than our current value. One of the primary methods he used to measure the distance to galaxies was the apparent magnitude of the brightest stars in a galaxy. Based on stars in our own Milky Way, and in the Magellanic Clouds, Hubble estimated the absolute magnitude of these stars to be about M = -6.5. If he could detect individual stars in a distant galaxy, he could invert the relationship between absolute and apparent magnitudes

to compute the distance to the galaxy:

Consider, for example, one of the galaxies in the Virgo Cluster.
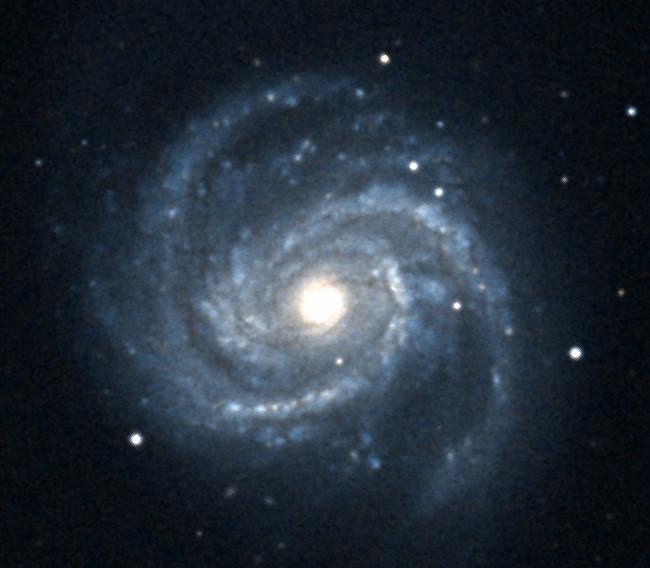
Q: Do you recognize this galaxy?
Yes, it's M100, aka NGC 4321. In the 1920s and 1930s, Hubble wrote that the brightest blue stars in this galaxy had a photographic magnitude of about m = 19.0. If one plugs that value, and M = -6.5, into the following formula,

Q: What is the resulting distance to M100?
The answer is -- about 1,300,000 parsecs, or 1.3 Mpc.
But were those really stars?
Hubble based his decisions on photographic plates taken with the 100-inch telescope at Mount Wilson. They were the best images of galaxies available in the world ... but they had some limitations. I have been unable to find a reproduction of one of those images, but shown below is a print made from a photograph taken with the 200-inch at Mount Palomar. It really doesn't do the original plate justice, since I used my camera to take a picture of a printed page in a book.
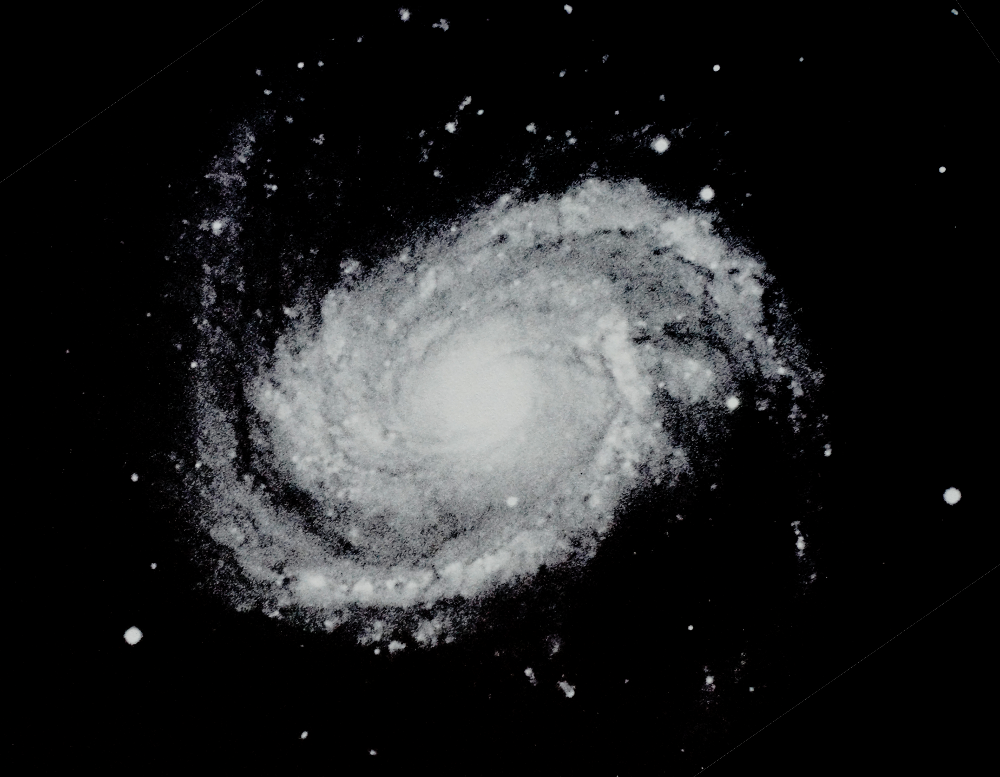
Image reproduced from
"The Hubble Atlas of Galaxies," by Allan Sandage.
The task of identifying faint little point sources on these photographic plates is a very difficult one. Hubble did the best he could, carefully measuring the positions and brightnesses of the most compact dots of light he could find on the plates.
The job is much easier if one uses a telescope with a much higher spatial resolution; say, for example, the Hubble Space Telescope.
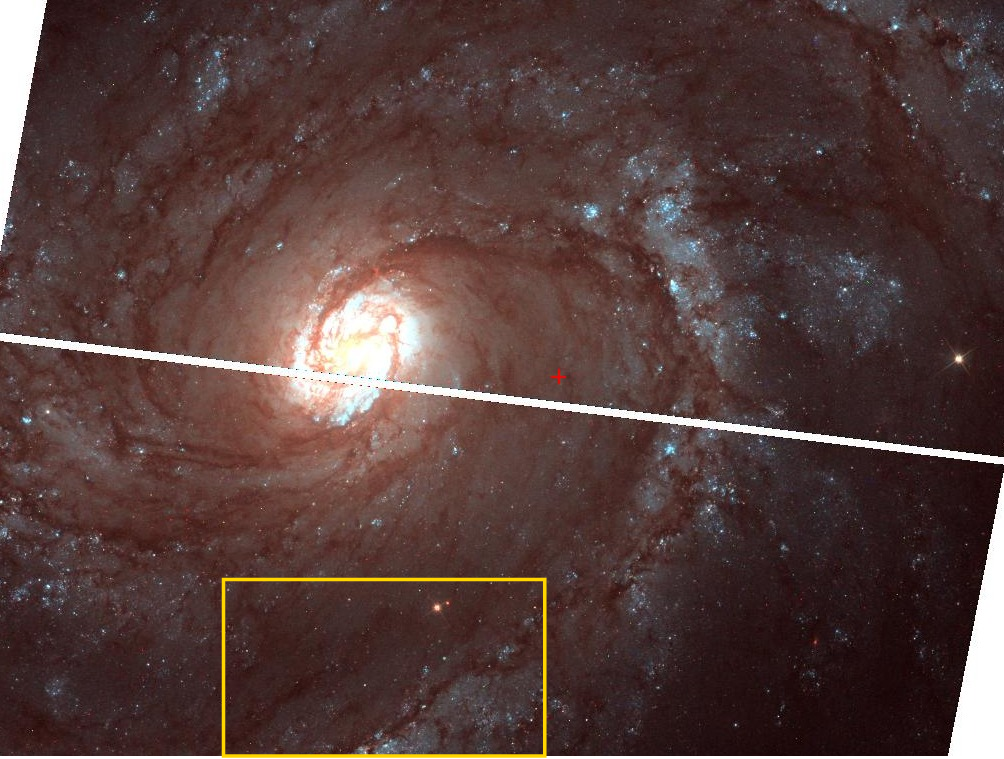
You can interact with
this dataset yourself
at
the Hubble Legacy Archive.
Let's zoom in to the region shown in the gold rectangle ...
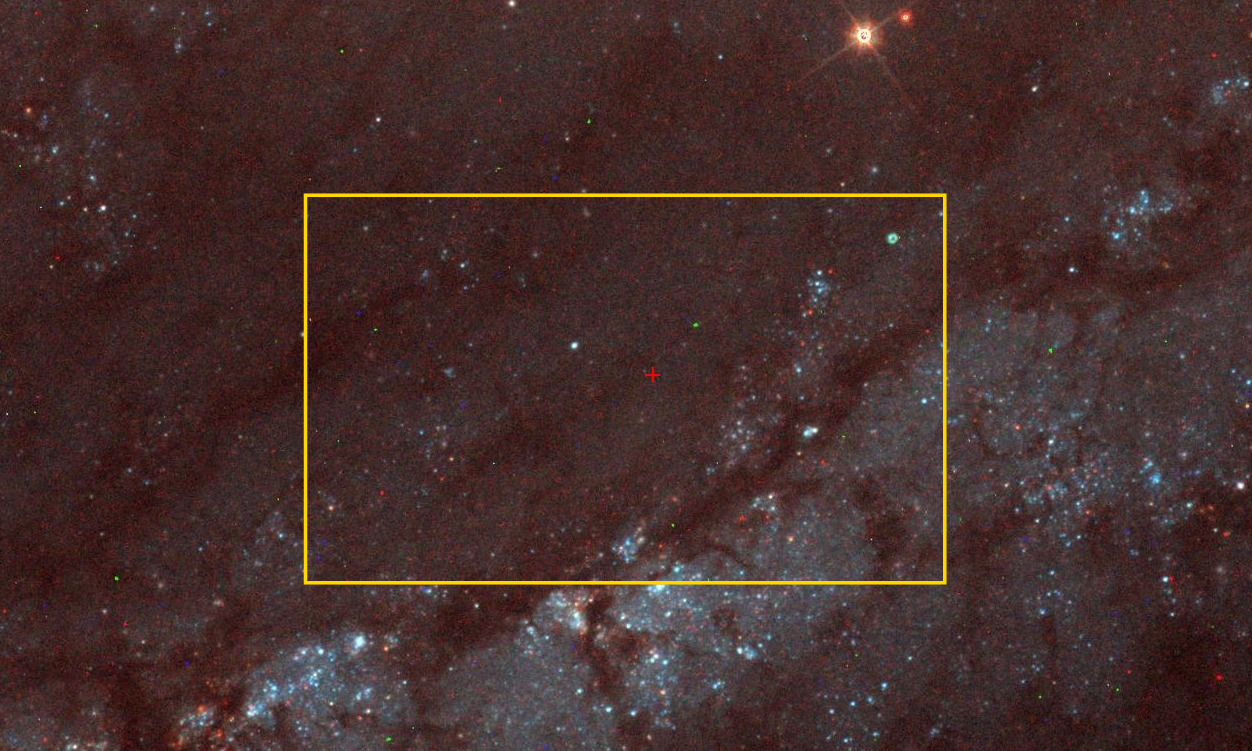
... then zoom in even more.
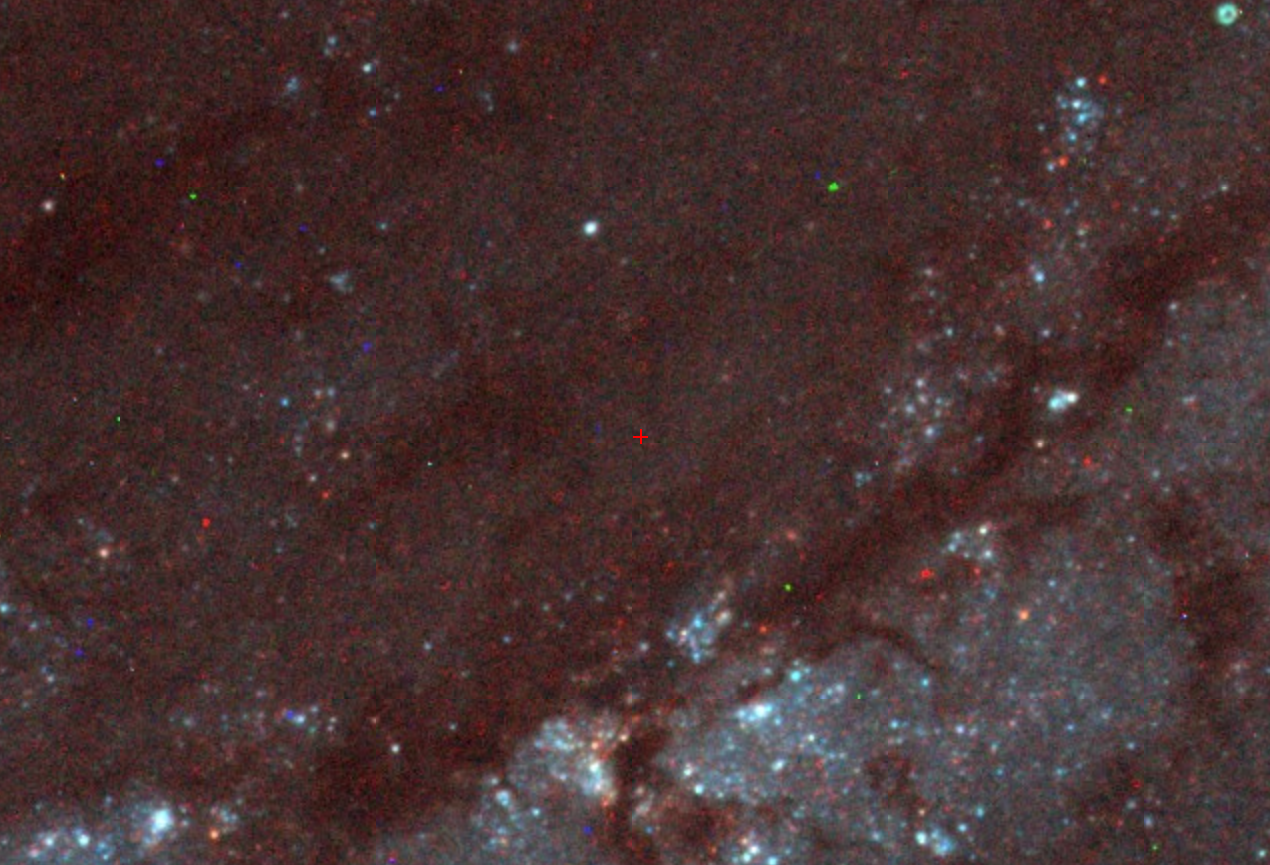
Q: Can you identify the brightest stars in this image?
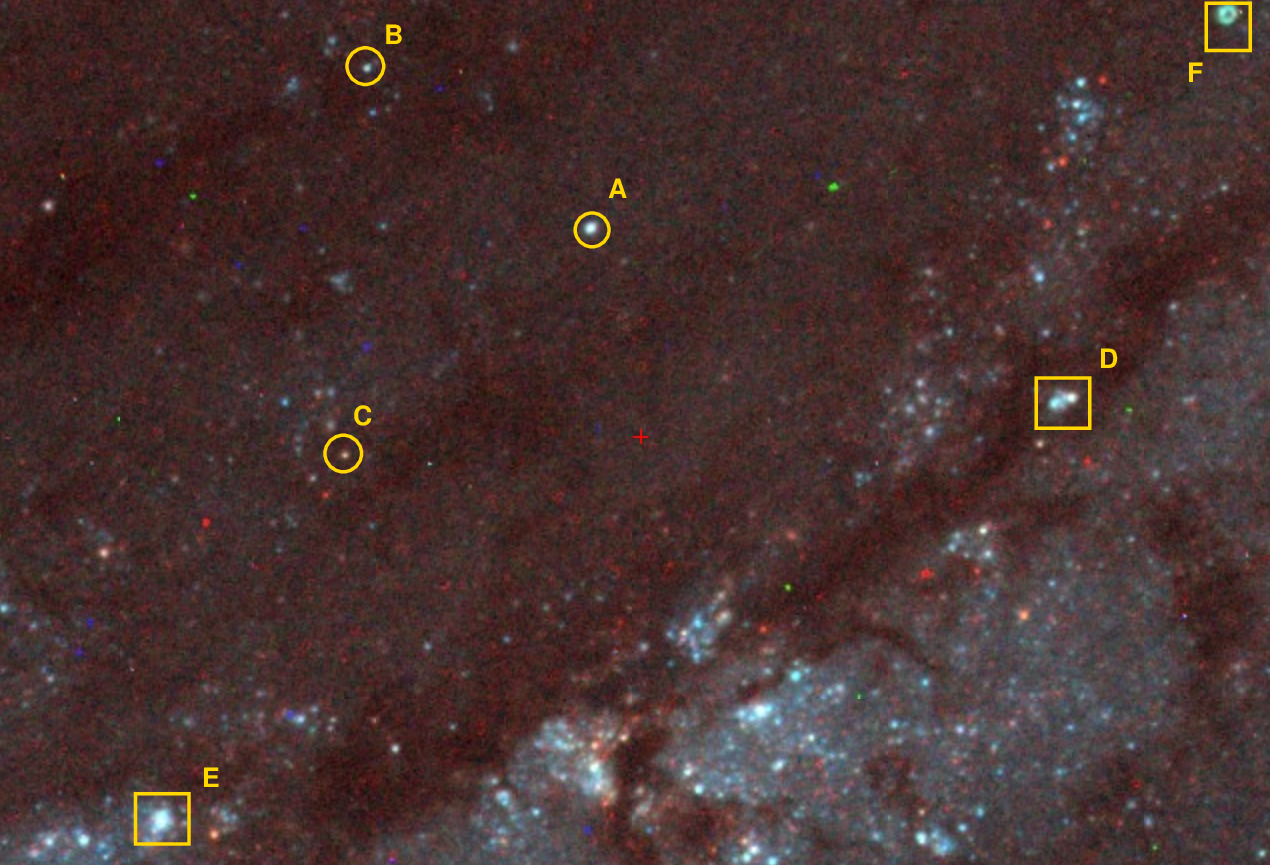
Note the difference in spatial resolution between our modern view of M100 and the data Hubble had to consider:
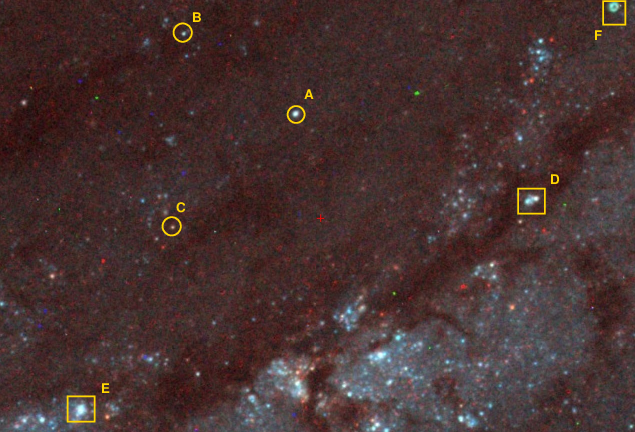
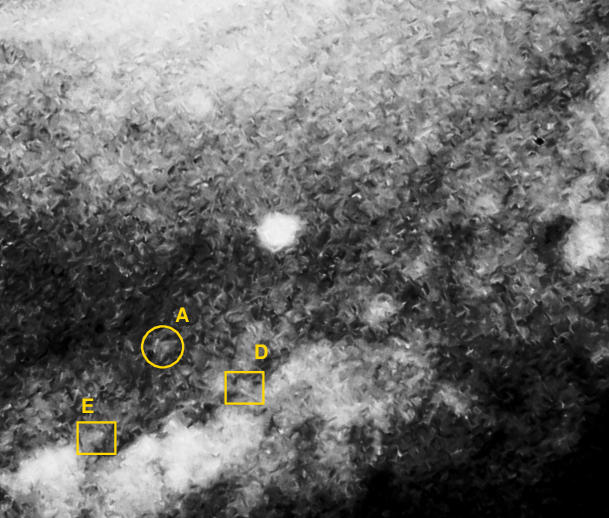
Right. It's a lot easier now. Now, which of these objects are stars?

I'd say that object A is POSSIBLY a star, and objects B and C are almost certainly stars. On the other hand, objects D and E are conglomerates of light from several different sources. Using the interactive tools at the Hubble Legacy Archive, I was able to extract very quickly some approximate measurements of the brightness of these objects:
    Object          F555W (V)         F775W (I-ish)        really a star?
--------------------------------------------------------------------------
      A              22.23             22.06                probably
      B              23.53             23.54                yes
      C              24.55             23.68                yes

      D              21.40             21.24                no
      E              20.48             20.28                no
--------------------------------------------------------------------------
Now, my tiny little sample includes just three stars, and is based on measurements made by a simple interactive tool; it can provide no more than a rough estimate. But some scientists have used HST images to perform a proper, careful analysis of the stellar population.
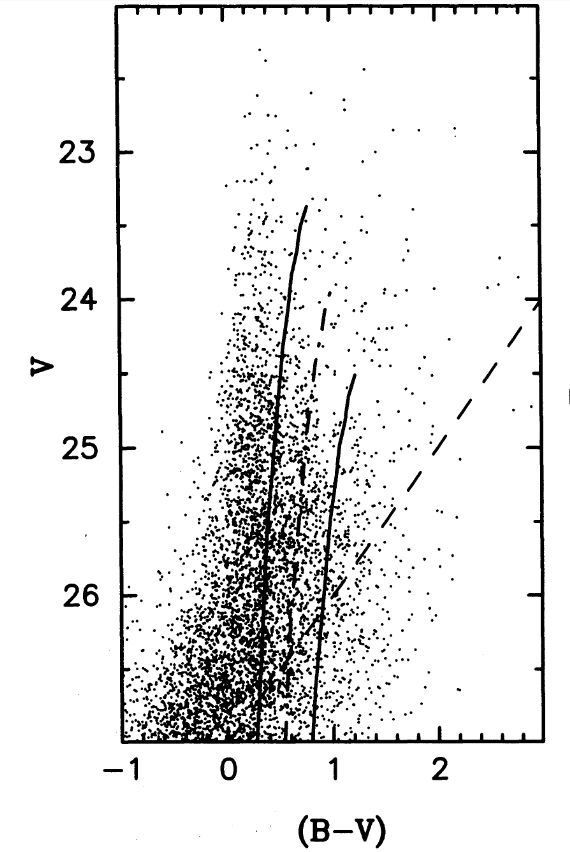
Figure 2 taken from
Freedman et al., ApJ 435, 31 (1994)
  Q:  What is the magnitude of the brightest stars in M100,
          based on this graph?
It's pretty safe to say that the brightest blue stars in M100 are roughly V = 22.5, which is at least 3 magnitudes fainter than Hubble's value (there's a small complication involving converting from photographic magnitudes to V-band). Since the brightest stars were FAINTER than Hubble had determined, the galaxies in which they orbited must be FARTHER AWAY. It turns out that a difference of 3.0 magnitudes corresponds to distances which are 2 times larger than previously thought.

And if the distances are larger by a factor of 2, the Hubble constant shrinks again -- by another factor of 2.
As an illustration of the size of these corrections, consider the velocity-distance diagram again. You saw one earlier, using data for relatively nearby galaxies (out to the Virgo Cluster), published in 1929 by Hubble. The version below shows a more recent set of measurements, again going out as far as the Virgo Cluster; but, as you can see, the distances have ... increased.
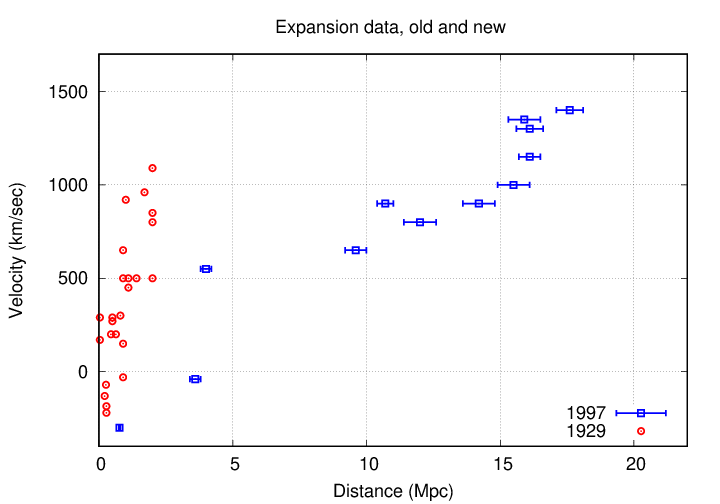
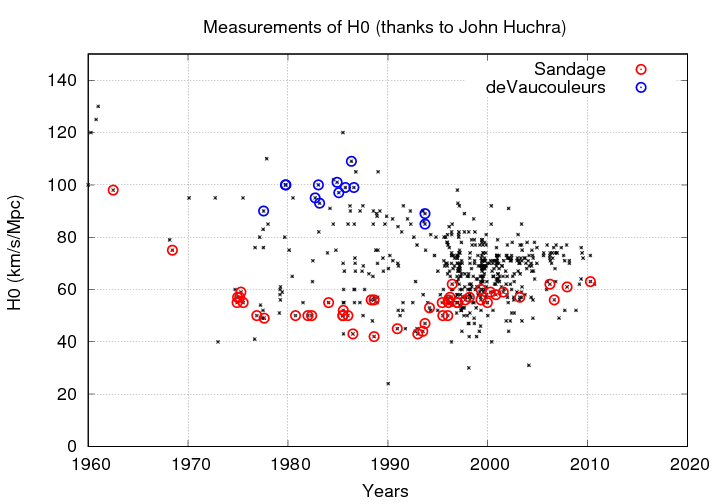
Throughout the nineteen-fifties and sixties, additional adjustments caused estimates of the Hubble constant to shrink a little bit more, to something less than 100 km/s/Mpc.
Then, in the 1980s, two groups of astronomers, using different methods of analysis, consistently found very different values.
Thanks to
John Huchra
for the collection of measurements!
The "American" group, led by Allan Sandage, favored values around 50 km/s/Mpc, while the "European" group, following Gerard de Vaucouleurs, saw evidence for a value nearly twice as large. It was an uncomforable time ...
Fortunately, in the 1990s, major advances in observing technologies improved the precision of several different techniques, and all the estimates started to converge somewhere around 70 km/s/Mpc.
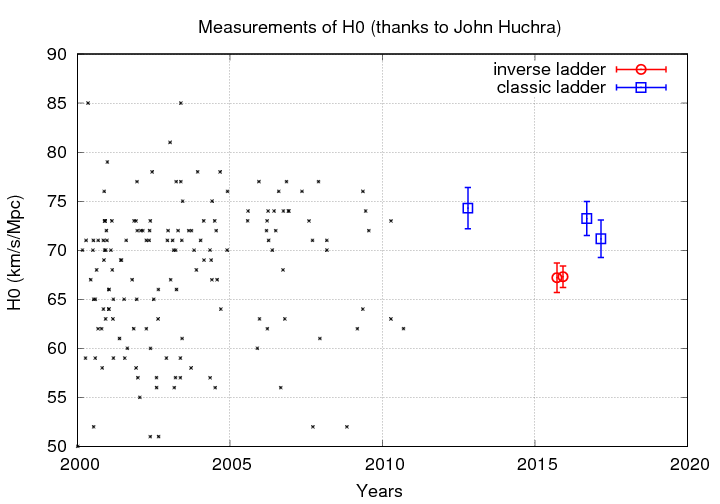
In the past decade, we are again seeing a "split" in the estimates of H0, but this time, the difference is much smaller.
Thanks to
John Huchra
for the collection of measurements!
This small -- but significant -- split which remains is to a large extent due to two different ways that one can try to measure the expansion of the universe.
The current values based on this "local" technique tend to be around 73 km/s/Mpc. For example, a few recent results in this category are
The current values based on this "global" technique tend to be around 68 km/s/Mpc.
For example, a few recent results in this category are
So what's the answer?
I don't know. This disagreement is one of the hot topics in astronomical research right now, as you can see by typing "Hubble tension" into the search box for the Astrophysics Data System: (just click on the image to see the result)
 Copyright © Michael Richmond.
This work is licensed under a Creative Commons License.