 Copyright © Michael Richmond.
This work is licensed under a Creative Commons License.
Copyright © Michael Richmond.
This work is licensed under a Creative Commons License.
a lunchtime talk given at the Harris Corporation of Rochester
Contents
Astronomers have studied the sky for millenia, creating ever more accurate catalogs of the stars. In this short presentation, I will provide a very brief and incomplete history of some of the most commonly-used catalogs, which may help to illustrate the advantages of some of the most recent additions.
I'll separate two functions of such catalogs:
There are many aspects to each of these categories, with subtleties and complications galore. I hope that my brief discussion of a few issues may stimulate the audience to ask questions, so that we may spend more time on the aspects of particular interest to this group.
The really old star catalogues are those of the Babylonians, Egyptians and Greeks; for example, the lost catalog of Hipparchus, or the surviving "Almagest" of Ptolemy. But for most scientific purposes, the first really accurate and BIG catalogues were created in the nineteenth century.
Let me highlight two of them: one providing positions and magnitudes of stars, the other spectral information.
All the measurements are based on eyeball estimates of the brightness of stars, and the times when they passed through a reticle in the eyepiece.
You can look at the contents thanks to SIMBAD.
The spectra were used to create a classification system, which eventually turned into our familiar MK spectral system: O, B, A, F, G, K, M.
Some details of the work are given at one of my class webpages.
You can look at the contents thanks to SIMBAD.
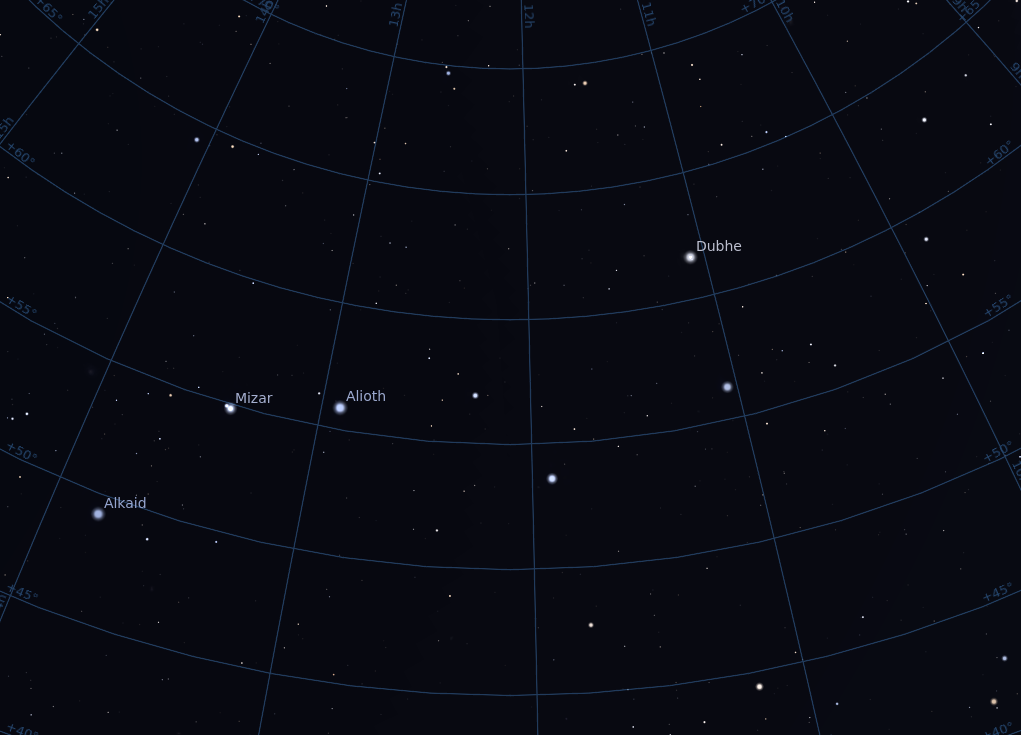
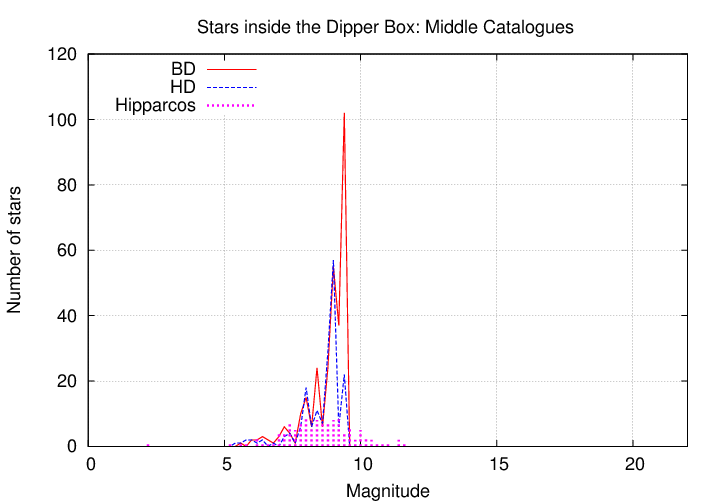
Now, just how many stars did these "old" catalogs contain? To make the numbers a bit more meaningful, let me introduce one small section of the sky: the bowl of the Big Dipper.
![]()
Now, this bowl is a convenient shape and size: roughly a rectangle, with sides pretty close to 10 degrees wide and 4 degrees high.
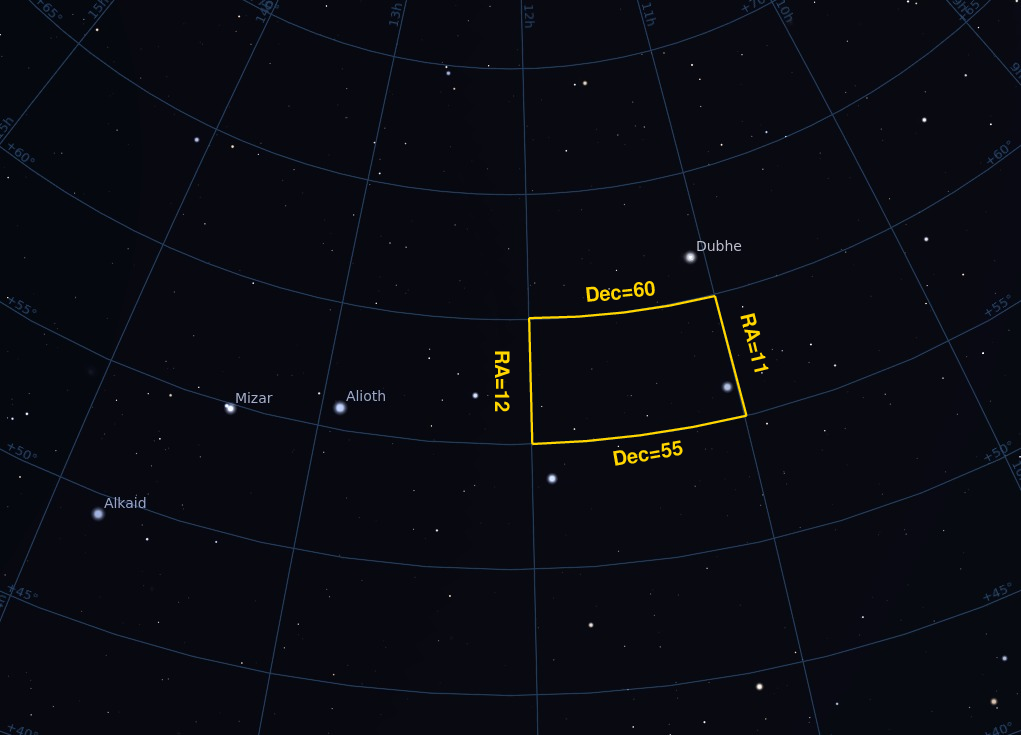
Let me define simple box which is roughly the same size as the bowl, but which has boundaries which are easy to describe and use in catalog searches:
This box has an area of just about 40 square degrees; by a nice coincidence, this very roughly 1/1000th the area of the entire sky.
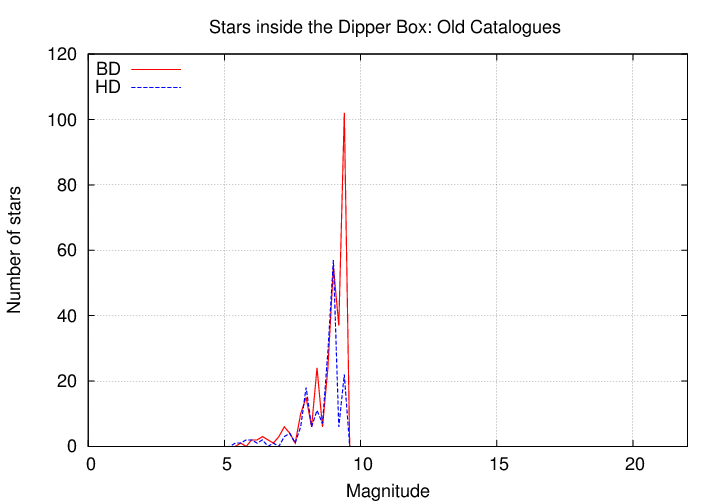
So, how many stars do these "old" catalogs contain within the boundaries of this box?
   catalog                     stars in box   stars/sq.deg.    limiting mag
  -------------------------------------------------------------------------
   Bonner Durchmusterung             305           7.6             9

   Henry Draper                      181           4.5             9

  -------------------------------------------------------------------------
In the mid-to-late twentieth century, advances in photographic technology allowed astronomers to record images of stars over the entire sky to deeper limits, showing far more stars than could be detected in the past. Computer-controlled equipment could scan those photographic plates and measure the properties of millions of stars in a reasonable amount of time. The result was a set of new catalogs with enormous numbers of stars.
In addition, the European Space Agency launched a satellite mission dedicated to measuring the positions of tens of thousands of stars with unprecedented accuracy. The Hipparcos mission produced positions and proper motions which made earlier measurements obsolete.
Let's look at just two of the many excellent catalogs which appeared at this time.
Based on these two sets of measurements, the authors of the Guide Star Catalog (GSC) could determine positions, magnitudes and proper motions for many stars, enough to provide some references for HST in almost any region of the sky.
You can look at the contents thanks to SIMBAD.
After a very long and involved reduction procedure, scientists could produce a catalog contain VERY precise precisions and proper motions for many stars, all over the sky. The precision of the measurements was, at best, just a few milli-arcseconds -- better than just about any ground-based efforts, and far more comprehensive.
You can look at the contents thanks to SIMBAD.
How big were these catalogs?
Well, Hipparcos focused on relatively bright stars, so it did not exceed in size the older ones (though it beat the pants off them in accuracy):
The Guide Star Catalog DID go much deeper than the earlier catalogs.
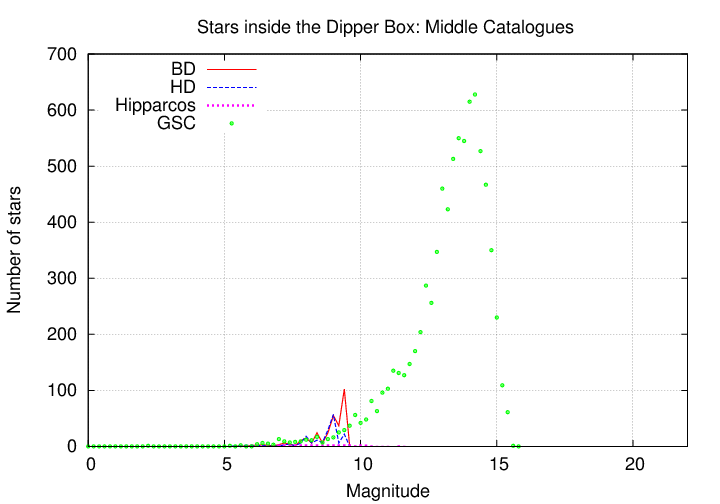
   catalog                     stars in box   stars/sq.deg.    limiting mag
  -------------------------------------------------------------------------
   Bonner Durchmusterung             305           7.6             9

   Henry Draper                      181           4.5             9

   Hipparcos                         119           3.0            9-10

   Guide Star Catalog               8007          20.2            14

  -------------------------------------------------------------------------
In the last two decades, astronomers have increased the scope of their stellar catalogs, going deeper in the optical, and extending their reach into the near-infrared portion of the spectrum.
In addition, some scientists have combined the results from the optical and infrared to make catalogs which provide information over a wide spectral range for each star -- which can allow us to estimate the spectral type of each star with some precision.
Finally, astronomers are working hard to increase the absolute calibration of their measurements of stellar brightness.
One of the many, many catalogs produced by the USNO over the years is based on scans of the Second Palomar Sky Survey taken in the 1980s and 1990s with improved photographic emulsions. The USNO B1.0 goes to unprecented depths, detecting stars down to magnitude 20 or 21.
You can look at the contents thanks to SIMBAD.
In the 1990s, scientists gained access to detectors sensitive to near-infrared light, originally developed for military applications. Now, why should infrared light be so important?
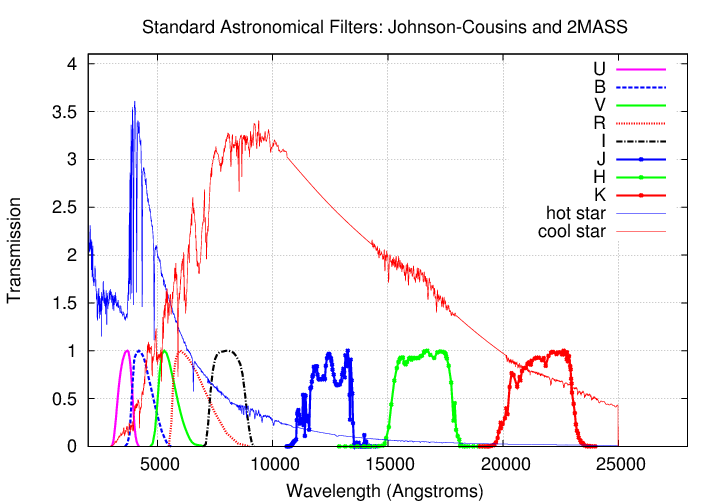
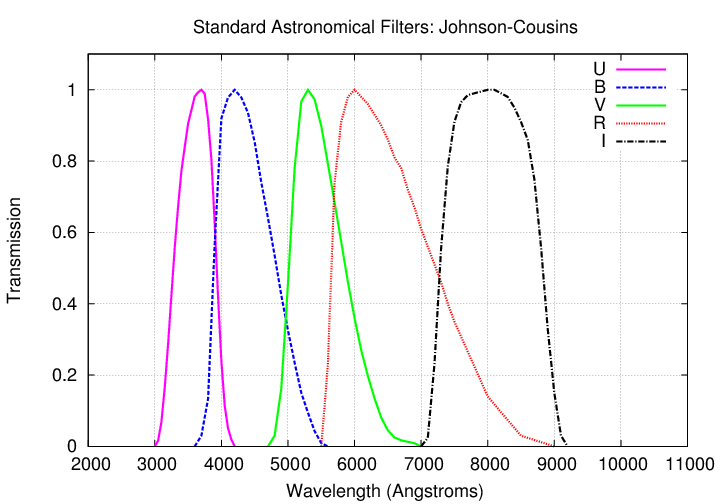
Well, let's look at the standard astronomical broad-band filters, used in many stellar catalogs. The Johnson-Cousins UBVRI system includes five filters covering the visible portion of the spectrum. These filters do a decent job of spanning the bulk of the energy emitted by some stars ...
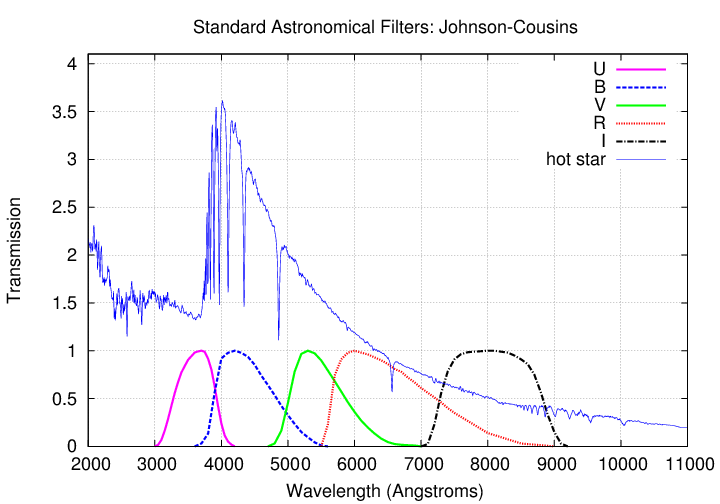
but only catch a very small fraction of the energy emitted by cool stars. And cool stars are much more common than the hot ones.
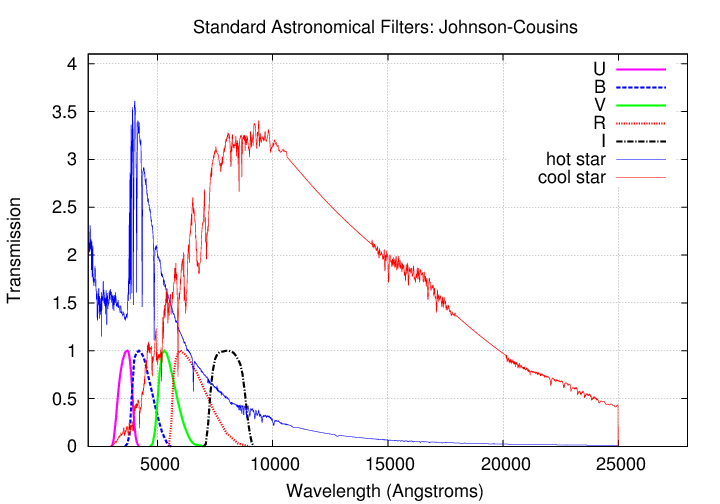
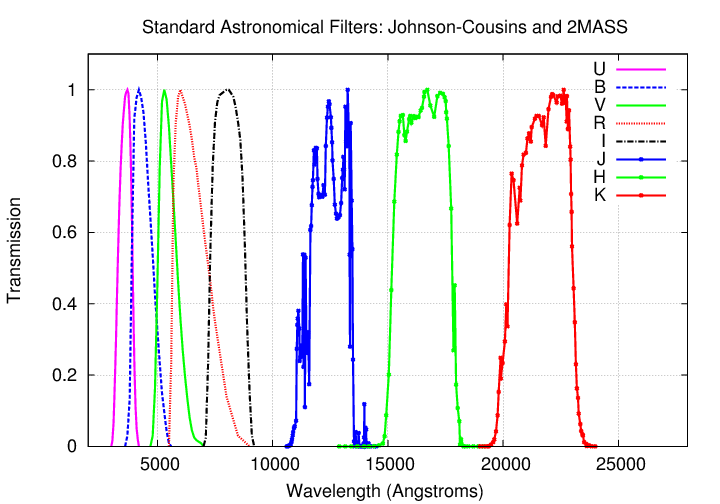
On the other hand, the JHK system of near-infrared broadband photometry DOES include much of the light emitted by cool stars.
One group of astronomers, led by a team from the University of Massachusetts, spent four years (1997 - 2001) scanning the entire sky with infrared detectors through the JHK passbands, then several more years analyzing the results. One of the fruits of their work was the 2MASS catalog.
You can look at the contents thanks to SIMBAD.
The new catalogs provide HUGE numbers of stars, increasing the probability that any tiny little area of interest will include at least several; or, in other words, increasing the number of stars falling into the field of view of some instrument, no matter where it is pointed.

   catalog                     stars in box   stars/sq.deg.    limiting mag
  -------------------------------------------------------------------------
   Bonner Durchmusterung             305           7.6             9

   Henry Draper                      181           4.5             9

   Hipparcos                         119           3.0            9-10

   Guide Star Catalog              8,007          20.2            14

   USNO B1.0                     305,579       7,640              20

   2MASS                          63,924       1,600              15

  -------------------------------------------------------------------------
The recent combination of
allows astronomers to do things that may be very useful to operators of satellites. For example, identifying the spectral type of a star based on its measured magnitudes. If one has measurements from both the optical and near-infrared, and a consistent calibration, one can match the magnitudes against the values from a spectral library to determine the spectral type of a star very accurately.
You can look at the contents thanks to SIMBAD.
You can look at the contents thanks to SIMBAD.
What's so great about having a spectral class for each star in a catalog? Well, the key is that good spectral libraries allow one to compute any of
for a given star. It's a relatively simple convolution of the spectrum and the overall sensitivity of the instrument; the only really complicated part is getting the zero-points correct for magnitude calculations (one good reference is Bessell, PASP 102, 1181, 1990 , but there are also other useful references scattered all over the Internet).
For example, suppose that you measure the number of photons detected per second for a couple of stars in the BVRI optical passbands:
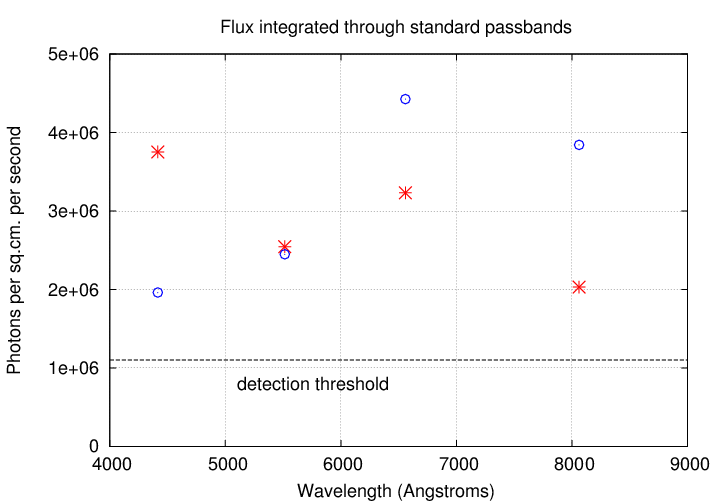
Both stars have plenty of counts through these filters, easily surpassing the threshold for detection.
But what if you want to find the same stars in the near-infrared? Which star is a better bet to exceed the threshold at 1.5 or 2.0 microns?
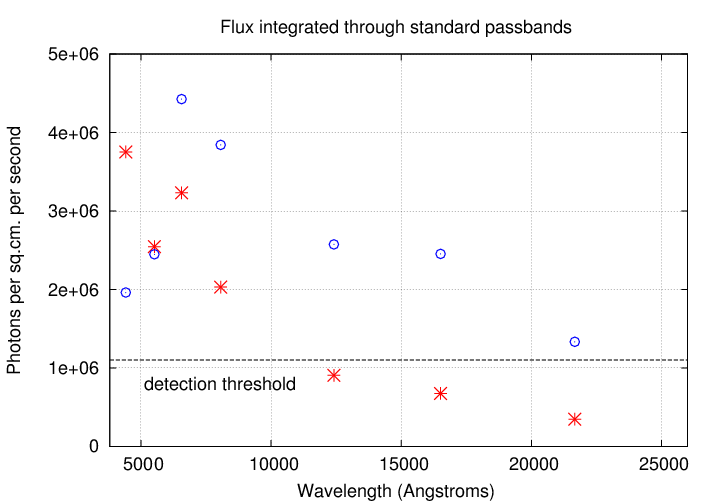
With the help of some of the recent catalogs, you can just look up the answer; without them, you would have to do quite a bit of work:
In this particular case, it turns out that the star shown with blue circular symbols is a Sun-like G5 star, while the star shown with red asterisks is a hot, Vega-like A0 star. When we look in the near-infrared, we find out that the Sun-like star is a much better bet:
   catalog                     stars in box   stars/sq.deg.    limiting mag
  -------------------------------------------------------------------------
   Bonner Durchmusterung             305           7.6             9

   Henry Draper                      181           4.5             9

   Hipparcos                         119           3.0            9-10

   Guide Star Catalog              8,007          20.2            14

   USNO B1.0                     305,579       7,640              20

   2MASS                          63,924       1,600              15

   UCAC4                          17,286         432             14-15

   All-sky Spectral Match          1,171          29.3            12

  -------------------------------------------------------------------------
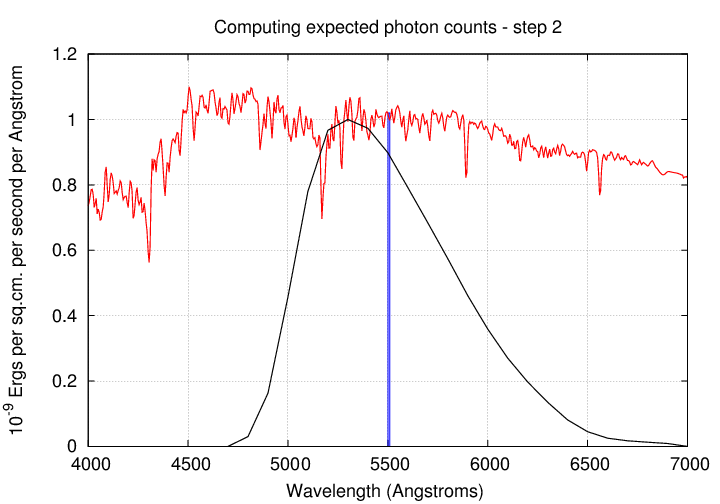
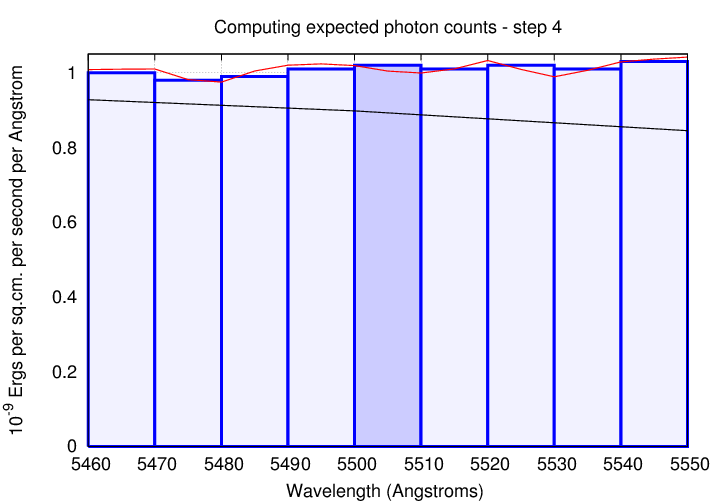
Just in case you want to see what goes into the sausage of stellar photometric calculations, I'll provide a small example. Let's start with the absolutely calibrated spectrum of a star (which in reality is very, very difficult to acquire!) and try to figure out its magnitude in the V-band. We begin with the spectrum and passband transmission function.
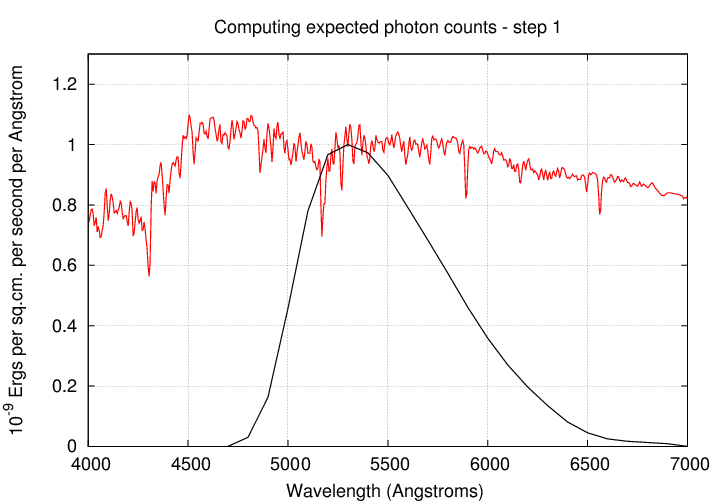
The basic idea is to break the spectrum into tiny little pieces, small enough that the spectrum and passband are approximately constant across each piece. For example, consider a piece at a wavelength of 5500 Angstroms.
If we zoom in, we can see that choosing a width of about 10 Angstroms is reasonable.
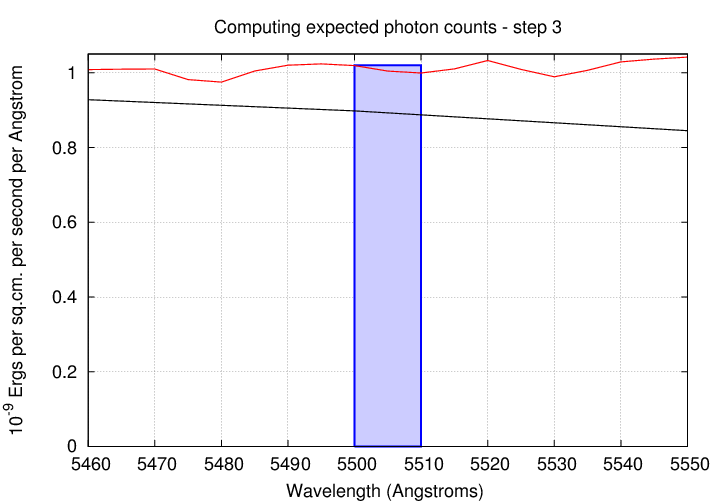
We do the numerical integration inside this little box:
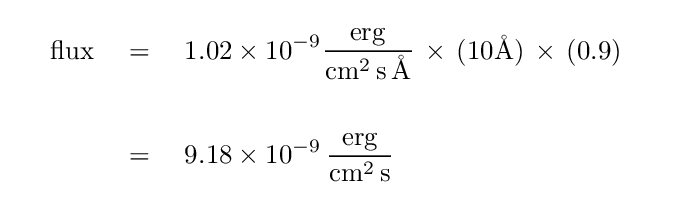
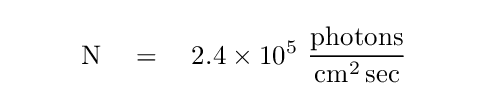
But ergs are hard to measure with some detectors. Let's convert this to photons, which are often easier to count. At the wavelength of 5500 Angstroms, we know that each photon has an energy of
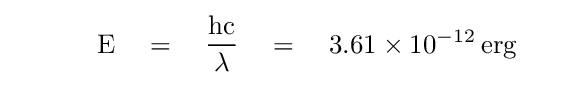
Using that conversion factor, we end up with a number of 2.54 x 10³ photons per sq.cm. per sec inside this little piece of the spectrum.
So, we can repeat this process for all the other little pieces of the spectrum ...
Integrating over all the little pieces, we end up with
Phew. We are almost done.
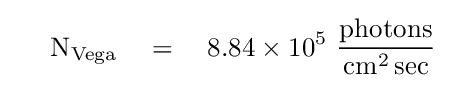
The final step is to compute a magnitude from this number of photon counts. To do so, we pick a star with a known magnitude AND a known, calibrated spectrum. There are very, very few of these -- no more than 3 or 4. One of them is the bright star Vega. The magnitude of Vega in the V-band is m(Vega) = 0.03.
If we repeat the numerical integration over that same passband for Vega, we end up with
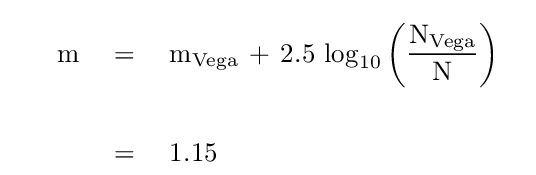
Finally, we can derive the magnitude of our star by comparing the number of photons we collect from it to the number we collect from Vega:
Copyright © Michael Richmond.
This work is licensed under a Creative Commons License.