
 Copyright © Michael Richmond.
This work is licensed under a Creative Commons License.
Spectroscopy is a powerful tool. In the late nineteenth and early twentieth century, astronomers around the world compiled larger and larger sets of stellar spectra. Most were taken with photographic plates, and left in their original, negative form (in which dark regions indicate high intensity of light, and white regions indicate very little light).

Henry Draper, a wealthy amateur astronomer, left a very generous bequest to the Harvard College Observatory. The directors of the Observatory used this money to fund a large-scale project: the collection and measurement of thousands and thousands of stellar spectra. The resulting Henry Draper Catalog of Stellar Spectra remains one of the most important sources of information on stars, a century after its creation. For example, the first extrasolar planet detected by the transit method circles the star HD 209458, which is number 209,458 in the Henry Draper Catalog.
Astronomers at Harvard gradually found ways to classify stars based on the appearance of their spectra. Let us follow their work to see what we can learn from the spectral classification of stars ...
Thanks to a generous donation from the estate of Henry Draper, the Harvard College Observatory acquired the world's largest collection of stellar spectra in the late nineteenth and early twentieth century. Few male scientists would pore over the thousands of tiny spectra with microscopes on hundreds of glass plates; it was too boring and didn't pay enough. The job of recording, measuring, and classifying this wealth of information was given to a group of female scientists, led by Williamina Fleming.
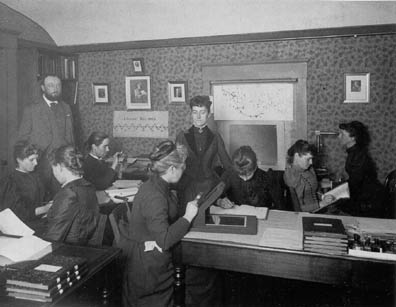
A group of female staff members directed by Mrs. Williamina Fleming, circa 1890. Standing--Fleming and Edward C. Pickering, sitting in front--Evelyn Leland, at rear left--Antonia Maura.
(Courtesy Curator of Astronomical Photographs at Harvard College Observatory)
Fleming decided to use the absorption lines of hydrogen to place spectra into different classes. She called the spectra with the strongest lines "A", the next strongest "B", and worked her way down the alphabet to "O", where the lines were virtually invisible. Here's a small selection of spectra shown in that order:
A 
A 
B 
B 
F 
G 
K 
K 
M 
M 
O 
Cannon noticed that this arrangement ALMOST put stars in order by temperature -- which she knew independently from the overall shape of the spectrum and from photometric colors. With just a few changes (getting rid of some intermediate classes, and shifting the O class to the top of the list), Cannon created a true temperature sequence that has since been used as the primary means of classifying stars.
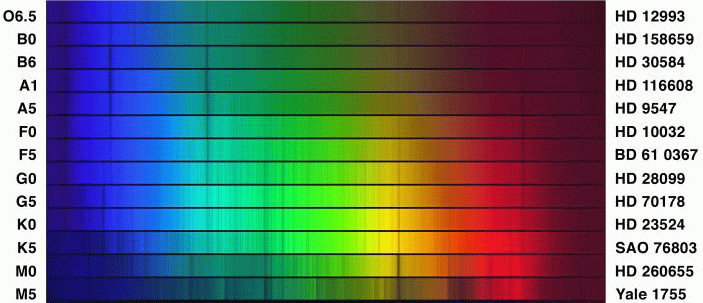
The result of decades of hard work by the Harvard astronomers was the Henry Draper Catalogue and Extension , which contains classifications for over 270,000 stars.
Each of the major classes
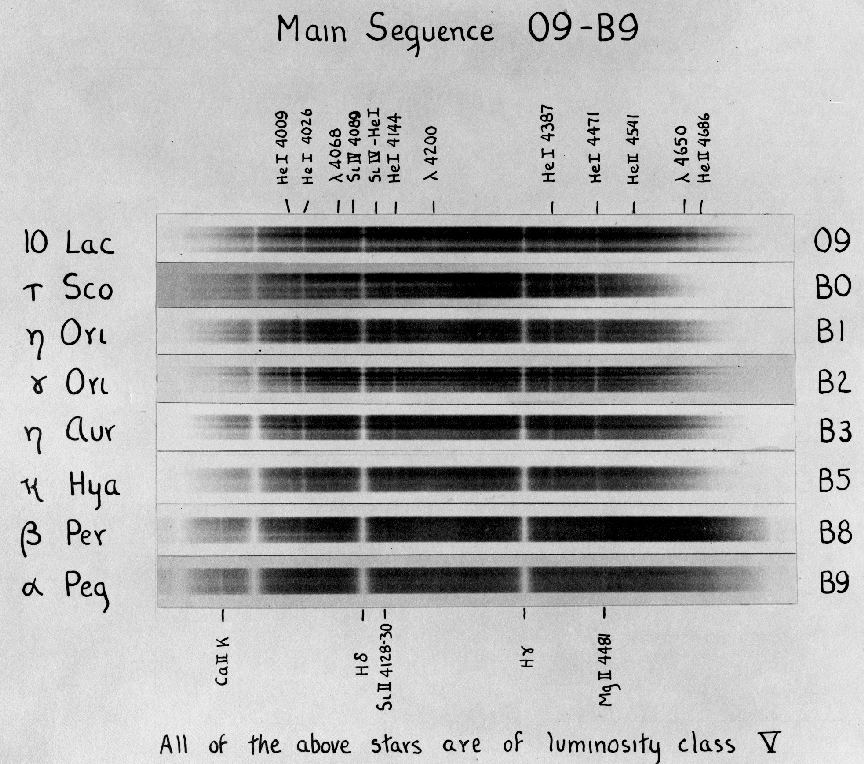
Using this system, we can discuss a reasonable number of different types of stars, dividing them into seven groups for rough purposes -- OBAFGKM -- or seventy groups for more detailed analysis -- O5, O6, O7, etc. Within each group, we can be reasonably confident that the stars have similar properties ...
... or can we?
Antonia Maury, one of the spectral analysts at Harvard, noticed that there was another sort of subtle difference hidden within the spectra. When she looked at stars which fell into the same class -- say, stars of type A3, all of which were dominated by absorption lines of hydrogen -- she saw small variations in the the width of the lines and their overall strength:
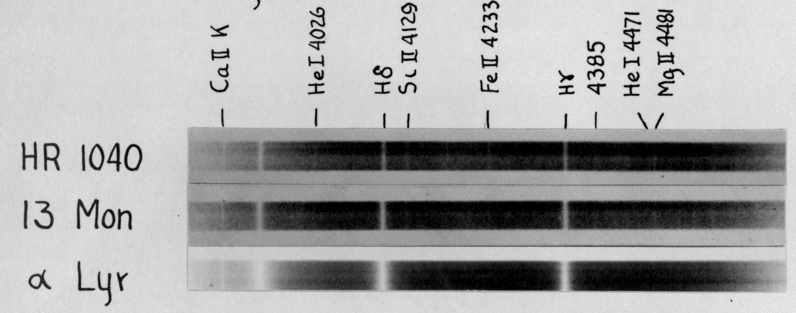
Maury put the stars with wide, strong lines into groups she called "classes a and b," and the stars with narrower, weakers lines into "classes c and ac." Early versions of the HD catalog included these notations.
Hertzsprung, you may recall, found a nice relationship between the absolute magnitude (or luminosity) and color (or temperature) of stars. He noticed that the cool, red stars fell into two groups:
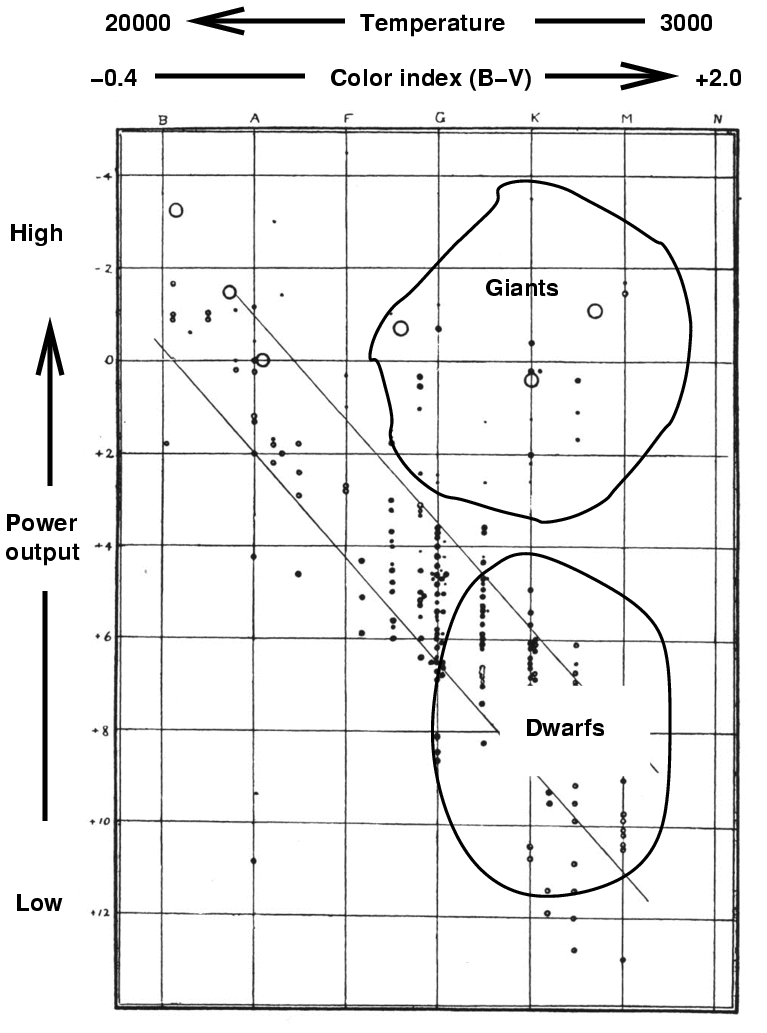
It was no easy task to place a star into the HR diagram: while the horizontal position was easy -- just measure the difference in B and V magnitudes -- the vertical position required that one know the DISTANCE to a star in order to convert the apparent magnitude into absolute magnitude. Distances were and still are hard to measure accurately. Distinguishing giants from dwarfs took a lot of effort.
But Hertzsprung found, to his pleasant surprise, that Maury's spectral groups correlated very well with position in the HR diagram.
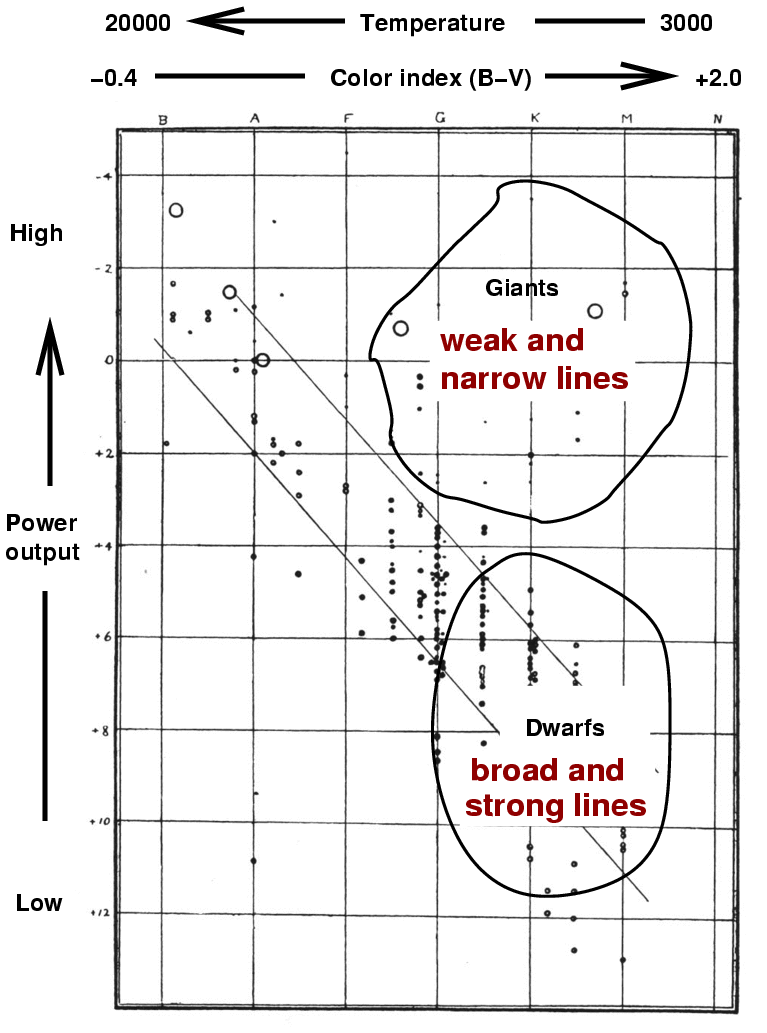
Stars with weak, narrow lines -- Maury's "c and ac" stars -- were giants, while stars with strong, broad lines were dwarfs.
This was great news! Taking the spectrum of a star was a bit more effort than measuring its magnitude, but much easier than determining its distance. Moreover, the Harvard College Observatory had already acquired and classified thousands of stars. Hertzsprung and other astronomers could now pick out giants or dwarfs simply on the basis of their spectral class.
Over the course of several decades, the astronomers at Harvard made small modifications to their classification system. They removed Maury's groups from their catalogs, so you will no longer see classes which include lower-case "a" or "b" or "c". However, a later system called the MK classification system ("MK" are the initials of Morgan and Keenen, two of the three authors of the system) brought Maury's work back into play. The MK system adopted the main spectral classes from Harvard: stars are given a class -- OBAFGKM -- and a number to designate their sub-class: O5, B3, K2, etc.
But the MK system adds one more item to each star's entry: the luminosity class. This is a roman numeral based mainly on the widths and strengths of the lines:
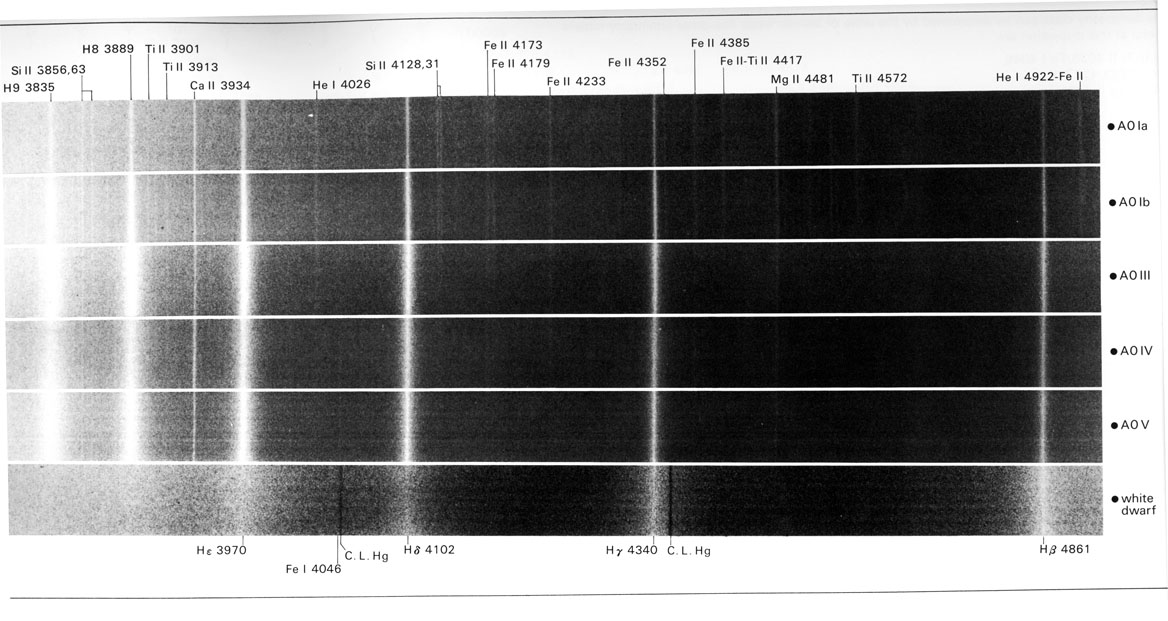
Figure take from An Atlas of Representative Spectra,
by Yamashita, Nariai and Norimoto (University of Tokyo Press, Tokyo, 1978)
So, putting it all together, we give every star a full spectral classification which has three pieces:
The Sun's full classification, for example, is G2V.
 Copyright © Michael Richmond.
This work is licensed under a Creative Commons License.