 Copyright © Michael Richmond.
This work is licensed under a Creative Commons License.
Contents
The name of this talk involves a little-used technical term: Boom. I'd like to draw a distinction here between two types of stellar explosions.
Although people pay more attention to KABLOOIE , I will argue in this talk that there are excellent opportunities for amateur astronomers to contribute to the field by choosing to measure the stars that go BOOM ,
Stars that go KABLOOIE (also known as supernovae) come in two varieties: core-collapse events, and thermonuclear explosions.
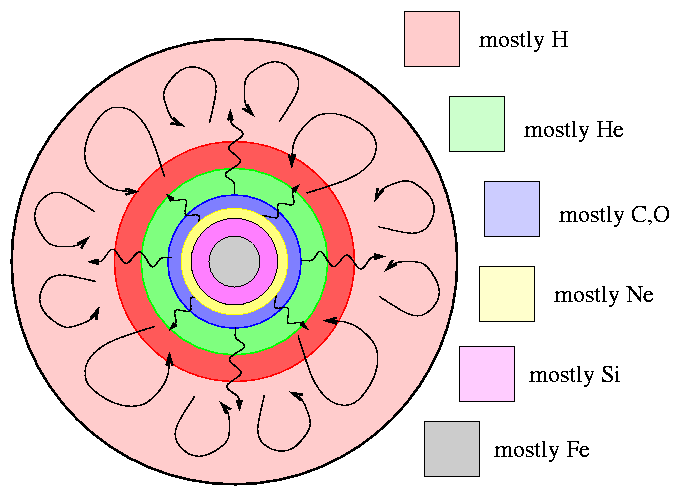
The core-collapse events occur when a young single star, at least 8 times more massive than our Sun, has built up a series of shells of material inside itself:

The key is that iron cannot be fused together to release energy. When the core has turned into iron, there is no way to support it against the pull of gravity, and the core collapses. That sets off a complicated series of events, which in a few hours blow the outer layers of the star outwards into space.
These are sometimes classified as supernovae of
A very different situation can also produce a titanic KABLOOIE , resulting in a thermonuclear supernova. In this case, we begin with a binary system, consisting of a main-sequence star and a white dwarf in a very close orbit. If the circumstances are Just Right, the white dwarf can accrete material from the ordinary star. If it reaches a critical mass of about 1.4 solar masses, its inner regions may undergo a runaway thermonuclear reaction.
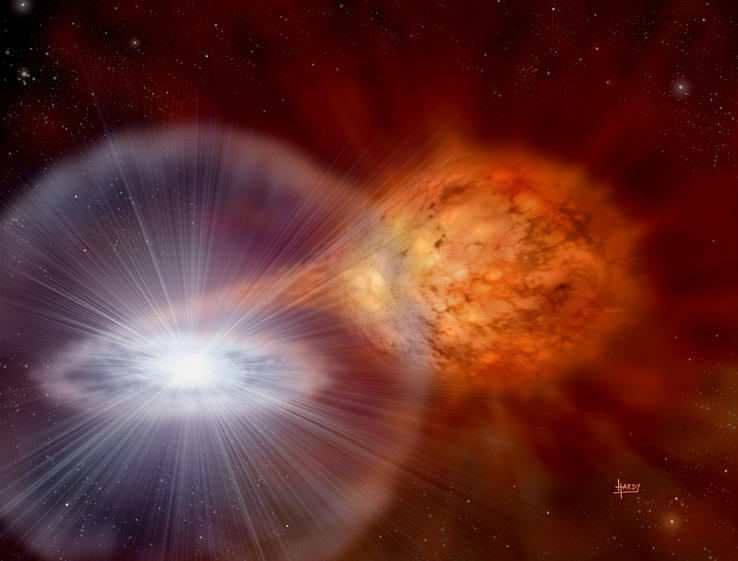
Image
courtest of David Hardy and PPARC.
We call these supernovae
Strangely enough, our other contestants today, the stars that go BOOM , usually called cataclysmic variables or CVs for short, also take place in close binary systems containing a white dwarf.

Image
courtest of David Hardy and PPARC.
The difference here is that the mass of the white dwarf in these systems is not close to that critical limit, and so it does not explode. Instead, the system may go into a brief outburst due to instabilities in the flow of gas into the accretion disk, or due to small reactions involving only the thin outer layers of material on the white dwarf.
CVs come in a large number of varieties:
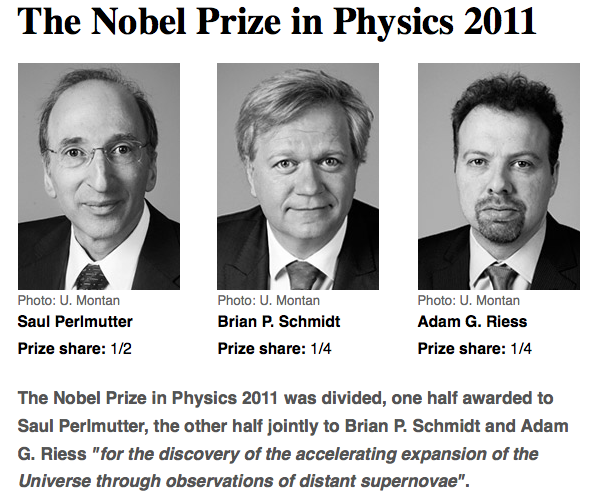
In the case of supernovae, the answer is "sexy": by using light curves to determine the distances to far-off galaxies, we can measure cosmlogical parameters, and maybe even win a Nobel Prize.
In the case of CVs, the answer is "mundane:" a careful study of light curves and spectroscopy of outbursts can tell us about the hydrodynamics of mass transfer between binary stars, as well as about stellar evolution.
No Nobels, probably.
The answer depends on how big your telescope is. If you can make precise measurements down to magnitude 19 or 20, then there are plenty of exploding stars for you to study, all the time. But if you are limited to magnitude 15 or 16, as I am, then your options dwindle.
Really bright supernovae are pretty uncommon. Dave Bishop's list of bright supernovae shows that over the past few years, only two objects have had peak magnitudes brighter than mag 12, and most are at best 14th magnitude.
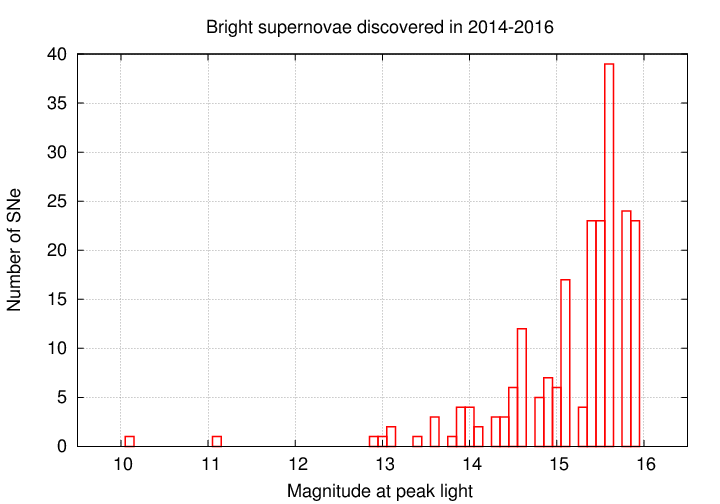
In order to learn much from a supernova, one needs to follow it to at least 2 magnitudes below peak, but 3 or 4 magnitudes are even better. For example, look at SN 2013ej in M74:
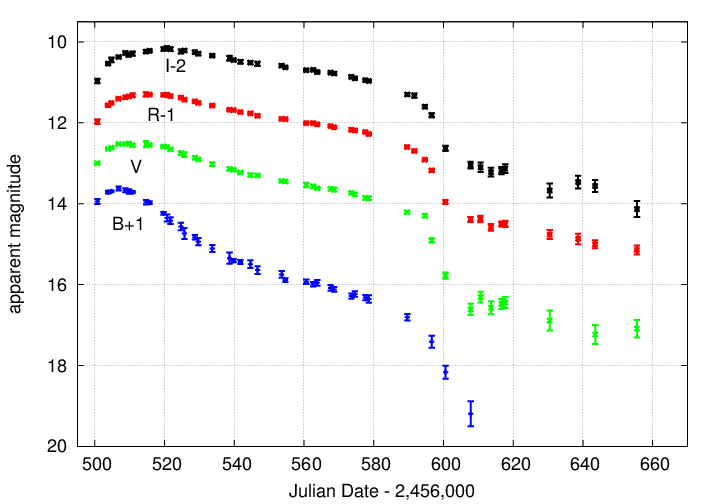
So, in the case of supernovae, there are at best a handful of events per year which are suited to small telescopes.
The situation is a bit better for CVs. Some recent automated systems, like All-Sky Automated Survey, are finding many events each year. During 2015, for example, I counted at least
which were discovered by ASAS alone.
I find that there are at least 2 or 3 CVs in outburst at just about any time during the year. As long as you know where to look for the latest information, you'll probably find a good target.
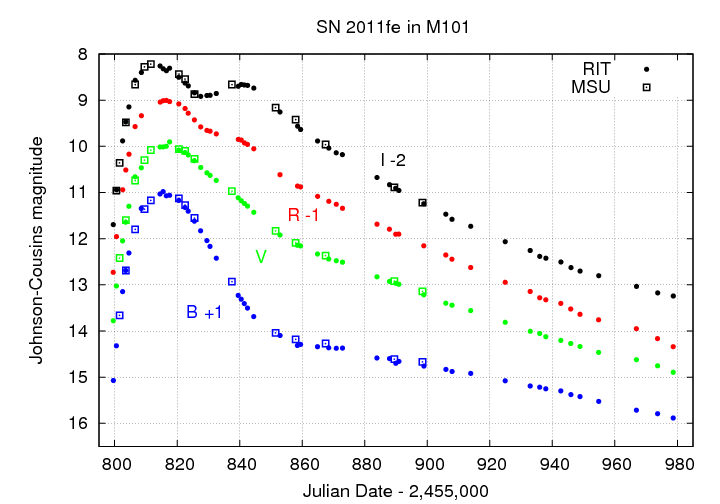
Nearby supernovae will typically remain visible to small telescopes for 90 to 180 days, and sometimes even longer.
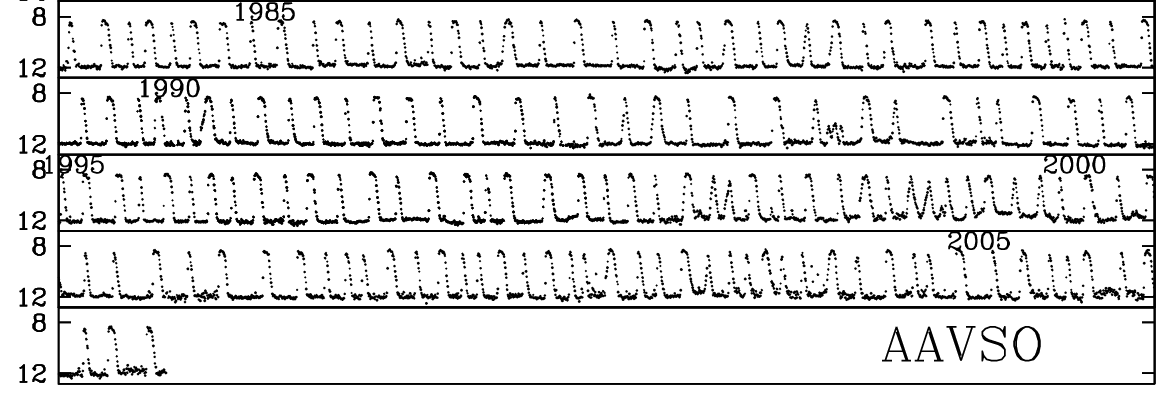
Most CV outbursts last for a few days to a few weeks, with very rare exceptions. Each row of the light curve below covers about 5 years, and contains some 40 to 50 outbursts of SS Cyg.
For supernovae, the answer is easy: just one.
But for CVs, the answer is usually as many as you can get, which can mean hundreds! On the night of July 27, 2001, I acquired 1079 measurements of WZ Sge -- and you can see why below.
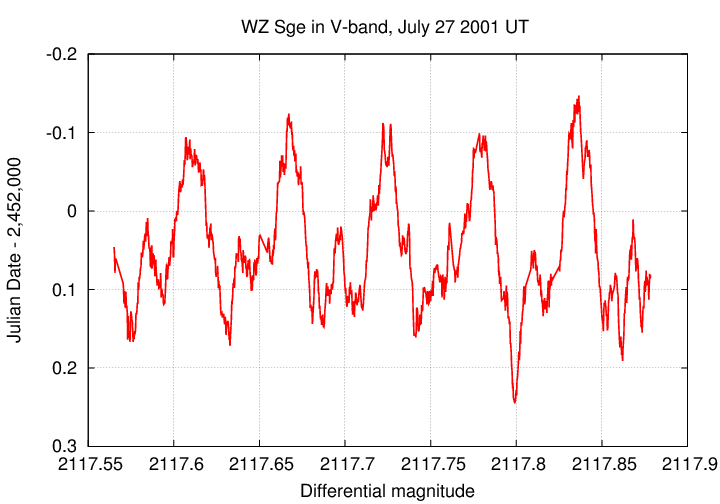
Over the course of the next week, look at how the shape of the light curve changed. We can learn a lot about the mass-transfer process by studying these variations over time.
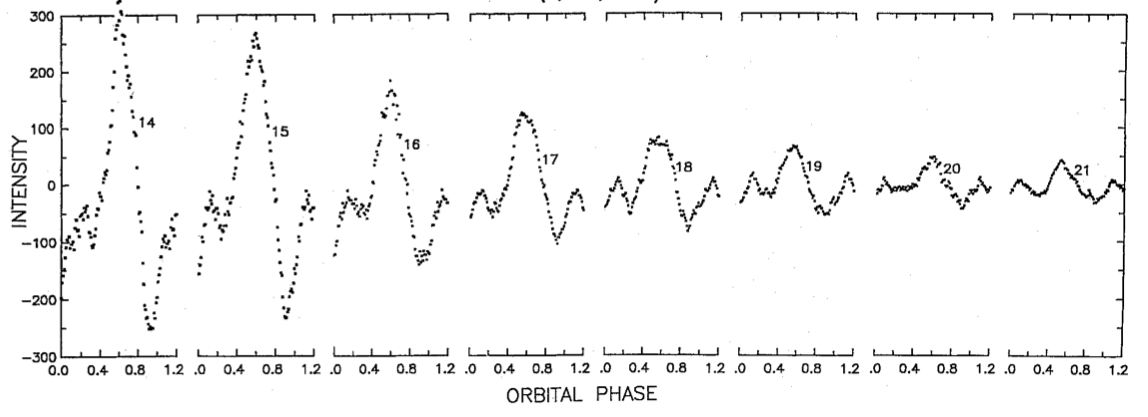
Figure taken from
Patterson et al., PASP 114, 721 (2002)
The figures below, taken from Munari et al., New Astronomy, 20, 30 (2013) , show the peak V-band light curve of SN 2011fe as measured by four different observers.
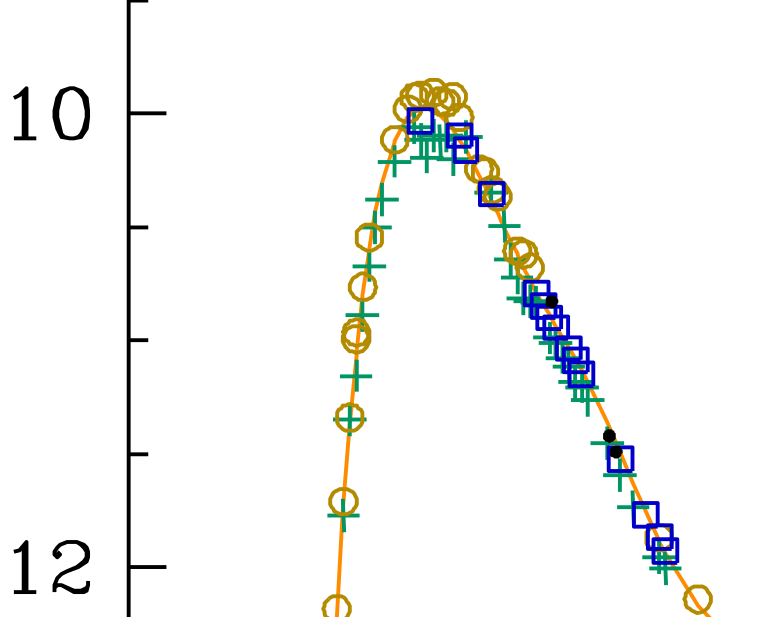
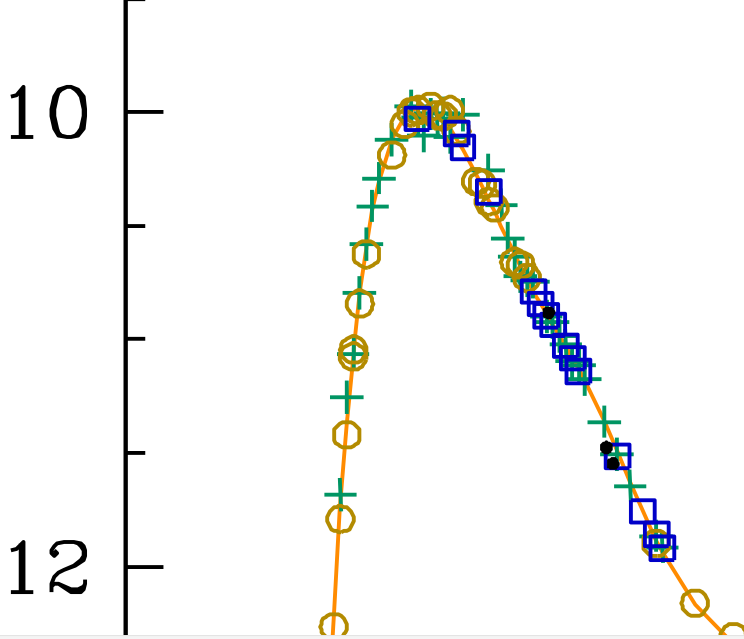
What's going on? The problem is that different manufacturers create "V" filters which aren't exactly the same ... and when those filters interact with the very complicated spectra of supernovae, even tiny differences in transmission can lead to important changes in apparent brightness.
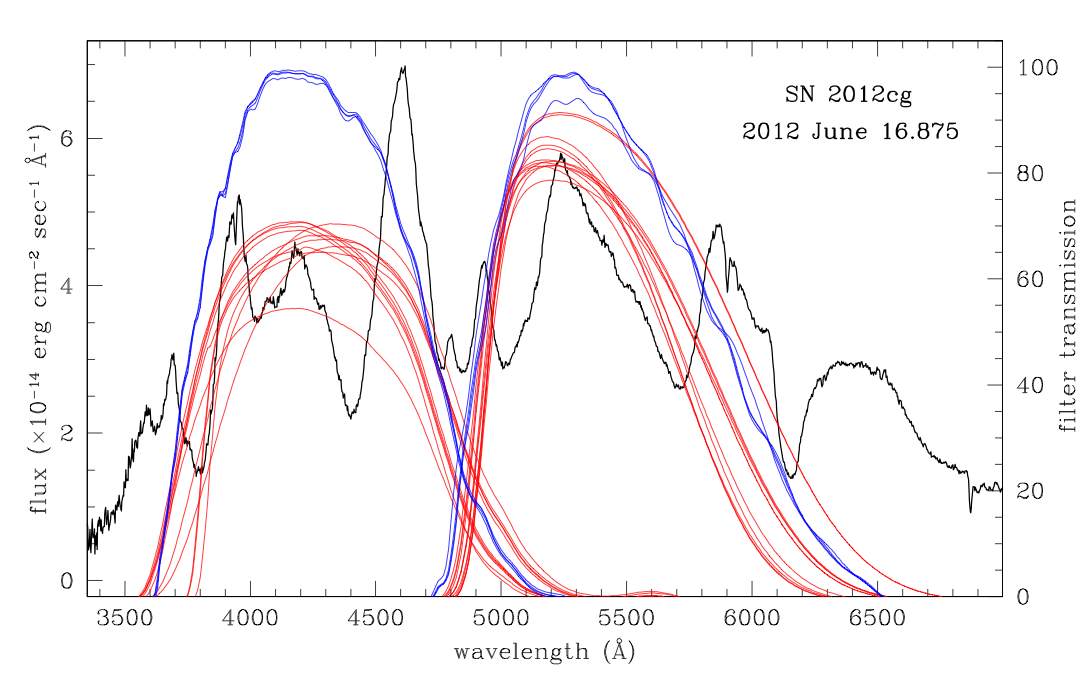
You can find a basic explanation of the issue, with some helpful illustrations, at this webpage.
The bottom line is that the photometry of supernovae must be very carefully calibrated to be useful. That means knowing the color terms for your equipment and applying them properly.
For CVs, on the other hand, life is easy. In most cases, the important features of the light curve are the relative variations during each cycle, as the two stars orbit around each other. The changing aspect of the accretion disk, hot spots, reflections, and so forth, lead to complicated but informative variations on timescales of minutes to hours.
Most people use no filter in order to maximize the signal-to-noise ratio of these short-term variations. We can splice together data from different observers relatively easily (using a simple offset in magnitude) because most systems don't change greatly in color.
The light curve below -- over 12 hours of data -- was stitched together from four different observers. No filter? No problem!

Figure taken from
Patterson et al., PASP 114, 721 (2002)
In the case of supernovae, look for people who are organizing campaigns for specific objects. For example, John Martin at University of Illinois, Springfield has organized efforts to measure the light curves of Type II supernovae.
In the case of CVs, I suggest contacting members of the two big international groups which study these events:
Please feel free to contact me directly if you'd like to ask questions about these or other groups, or if you just want to talk about your interests.
Groups which coordinate professional-amateur collaboration of variable star photometry:
 Copyright © Michael Richmond.
This work is licensed under a Creative Commons License.