 Copyright © Michael Richmond.
This work is licensed under a Creative Commons License.
Copyright © Michael Richmond.
This work is licensed under a Creative Commons License.
Contents
Supernovae can occur at any time, in any galaxy. Since amateur astronomers take lots and lots of pictures of nearby galaxies, every night, they are often the first to capture the light of one of these distant explosions -- even if they don't know it at the time. Once a supernova has been noticed and announced, we sometimes discover that the earliest images don't come from a professional observatory. Can we still use those images for science? YES!
Even after a supernova has been discovered, most astronomers take only a picture or two, then grow bored and go back to their regular projects. Occasionally, the only people who can afford to go out, night after night, to record the evolution of a supernova's light curve are the dedicated amateurs. Is it possible to rely on amateur images in an "official" published paper? YES!
But supernovae are sly creatures. You must be wary of their unusual natures, and ready to deal with them properly.
In an ideal world, astronomers everywhere would use exactly the same equipment:
And, in this ideal world, astronomers would even make their measurements in exactly the same environment:
Alas, we live in an imperfect world. Astronomers do NOT use the same equipment, nor do they all peer through the same atmosphere. As a result, when we measure starlight, we are all using systems with slightly different overall spectral sensitivity. It should be no surprise that these difference can lead to systematic differences in photometry between observers.
Let's focus on just one element of this effect, which often dominate the results: filters. Two astronomers with slightly different filters will discover that their measurements suffer from an error which depends on the color of the target star.
Why?
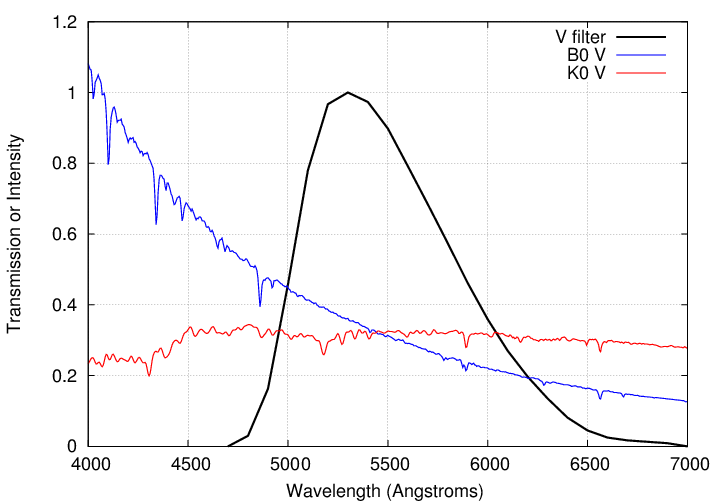
Well, let's pick a specific filter and a pair of representative stars. The figure below shows the transmission curve of a Bessell V-band filter, which is designed to yield values close to the Johnson-Cousins magnitude system. It also shows the spectra of two main-sequence stars: a hot, blue B star, and a cool, red K star.
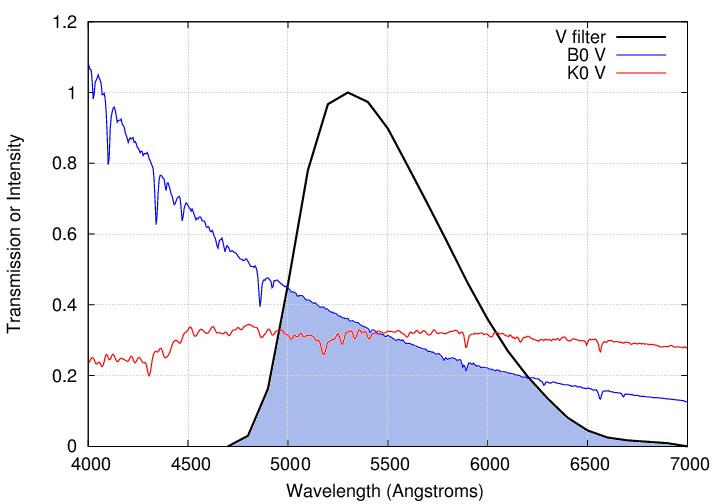
If one observes the blue star through this filter, then the result will be the convolution of the filter's transmission curve with the stellar spectrum; or, in graphical terms, something like the area under the two curves:
If one observes the red star through this filter, one will measure this amount of light:
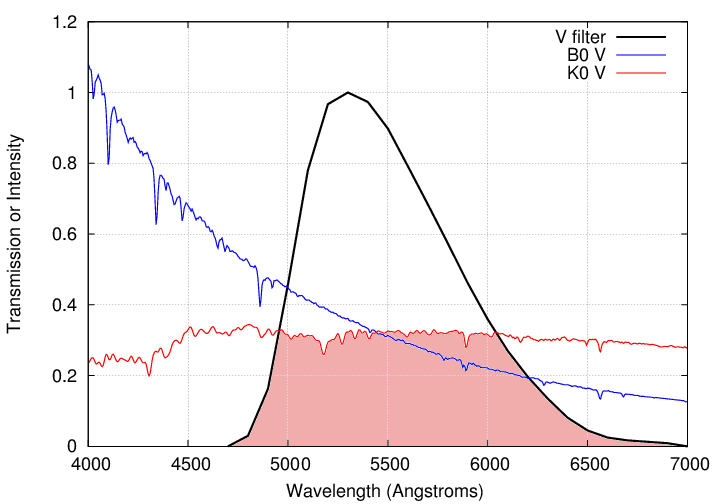
I happen to have chosen two stars with identical V-band magnitudes for this illustration. In other words, when observed through the proper V-band filter, the extra light from the blue star at short wavelengths exactly balances the extra light from the red star at long wavelengths.
(mag of B star) - (mag of K star) = 0.0
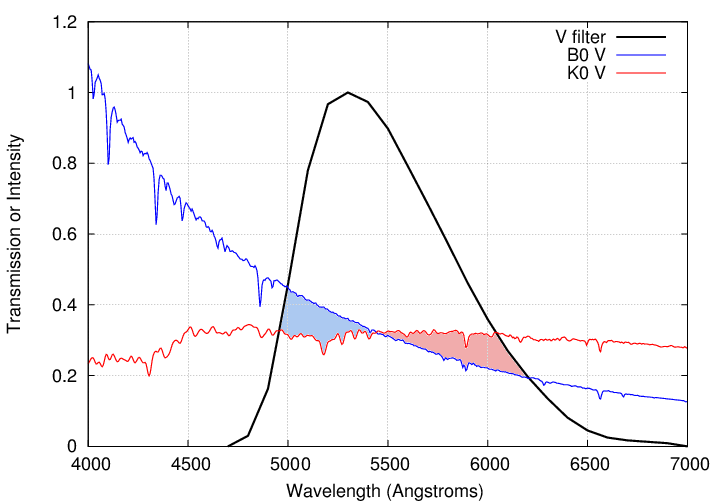
But what if my filter is NOT exactly the same as the standard V-band filter? Suppose that my filter's transmission curve is shifted slightly to the red, by 100 Angstroms.
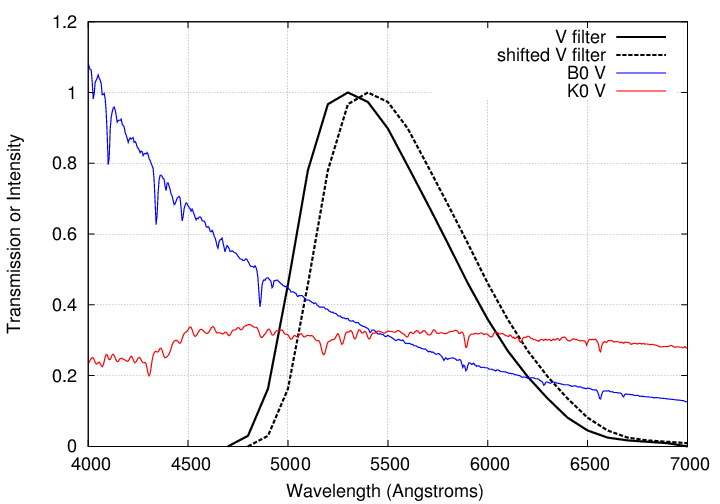
As you can see, this shifted filter will transmit extra light at long wavelengths, favoring the cooler star.
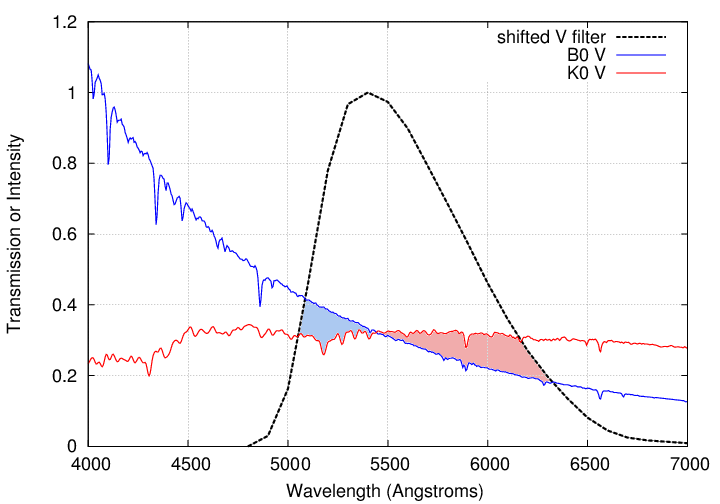
As a result, my measurements through this filter will indicate that the red star is brighter than the blue star. In particular, for this case of a simple shift of 100 Angstroms, I find that
(shifted mag of B star) - (shifted mag of K star) = 0.076
The size of this systematic error depends on the shape of the non-standard bandpass, and on the spectrum of the star. Stars with extreme temperatures -- the hottest and the coldest -- will experience the largest differences as a result of imperfect filters. For example, the differences between measurements of a single star with
    spectral type         (shifted - perfect) magnitude
 --------------------------------------------------------
       B0 V                    0.0557
       A0 V                    0.0359
       F0 V                    0.0133
       G0 V                   -0.0036
       K0 V                   -0.0204
       M0 V                   -0.0768
 --------------------------------------------------------
Now, the problem is even worse for supernovae, because supernovae have crazy strong emission and absorption lines compared to stars. See for yourself:

If the shift in a filter happens to cause one of these very strong lines to fall into (or out of) the bandpass, then the measured magnitude of the object can change by a very large amount.
But wait -- it gets worse! Not only do supernovae have very strong lines in their spectra, but those lines change as they age!.
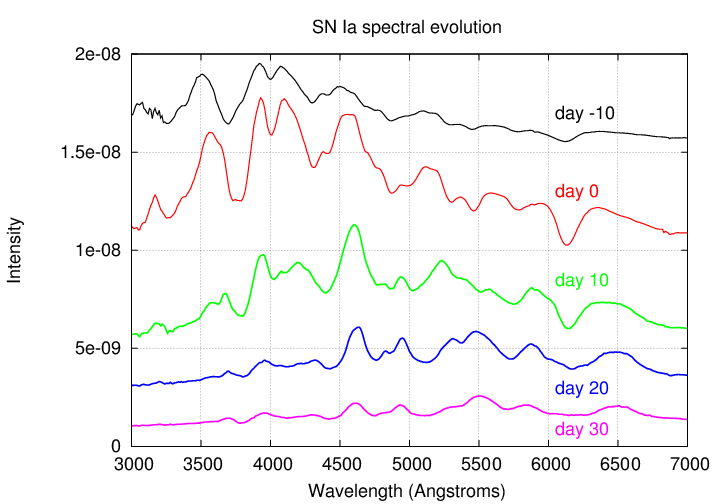
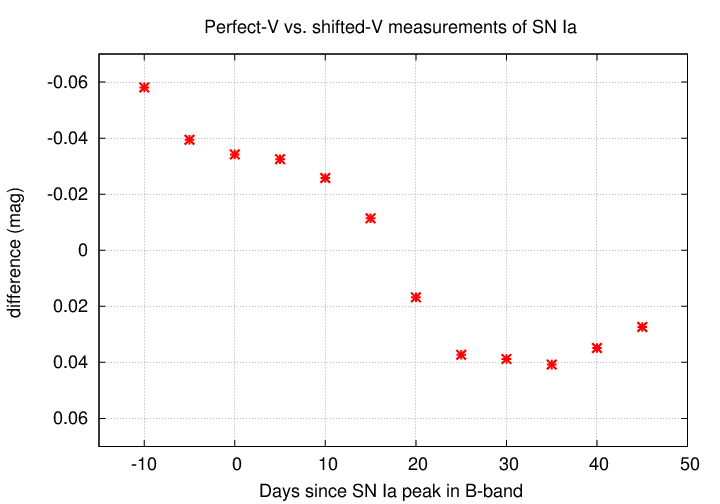
Consider two astronomers who observe the same type Ia supernova. If one of them has a "perfect" V filter, and the other a filter which is shifted by +100 Angstroms, then their measurements will differ ... and the size of that difference will change as the SN ages.
This may sound like an unimportant theoretical effect --- but it has shown itself in the real world. Several groups monitored the peculiar type II SN 1987A for over a year after its explosion. Even though they were all using similar equipment, measuring the Johnson-Cousins V and I passbands, they found quite substantial systematic differences between their results:
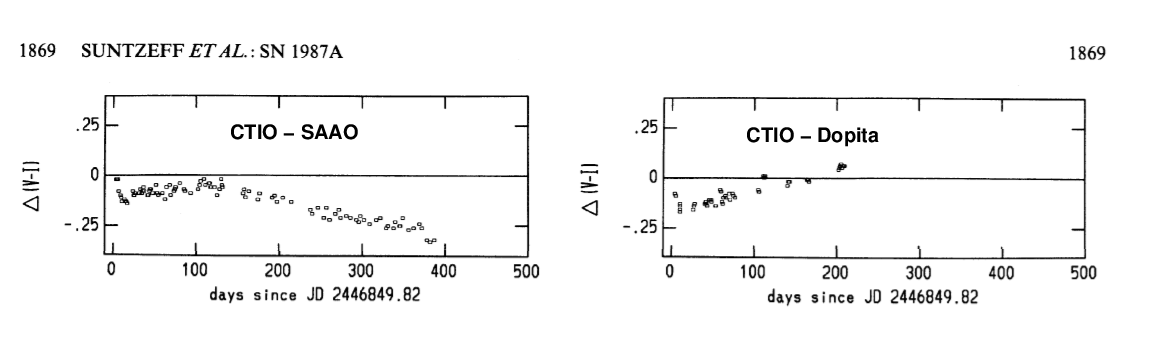
Taken from Figure 1 from
Suntzeff, N. B. et al., AJ, 96, 1864 (1988) ,
slightly modified for this talk.
So, how can you figure out the color terms which are appropriate for your instrument? This is a subject which will be covered elsewhere at this meeting
so I won't spend much time on it here. The basic idea is to observe particular fields which contain stars which have very well calibrated measurements and a wide range of colors; by comparing your own measurements to the catalog magnitudes, you might find a simple relationship between them.
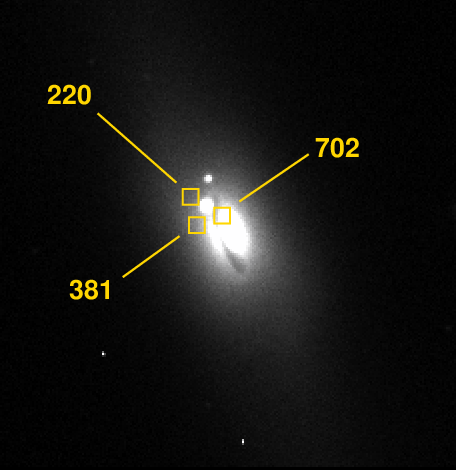
Your Turn!You can practice on a pair of images of the field of PG 1633-006, which is at RA = 22:16:24 Dec = -00:21:29. Measure the instrumental magnitudes of the four stars circled below, then enter the values into the spreadsheet to compare them with catalog magnitudes.
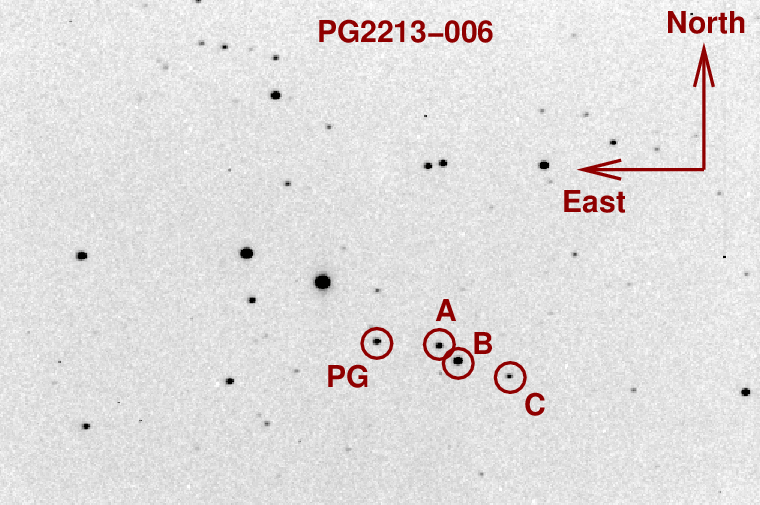
- V-band image of PG2213 (FITS)
- R-band image of PG2213 (FITS)
- Spreadsheet for illustration of color terms (Excel xlsx format) (or a copy in OpenOffice format)
Okay, now we can finally talk about that aspect of SN photometry that many of you may have been expecting: how to extract the magnitude from an image?
For ordinary stars, in most situations, this is a pretty simple three-step process:
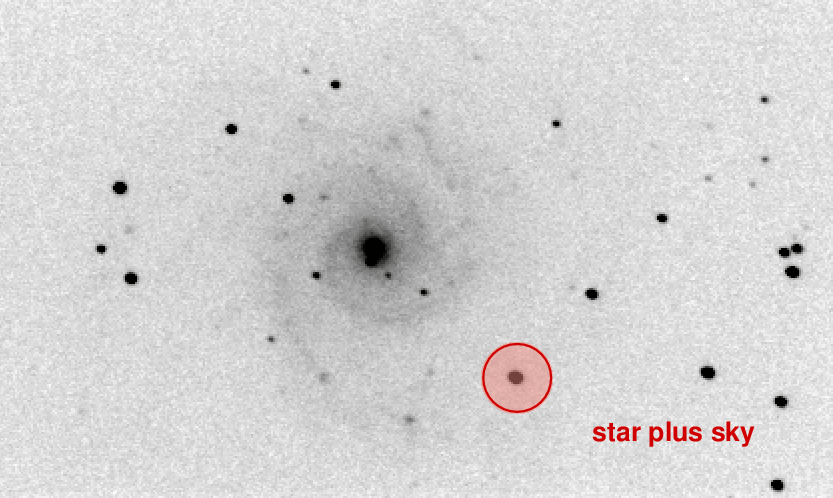
place a circular aperture around the star, add up all the counts inside the aperture to get (star + sky)
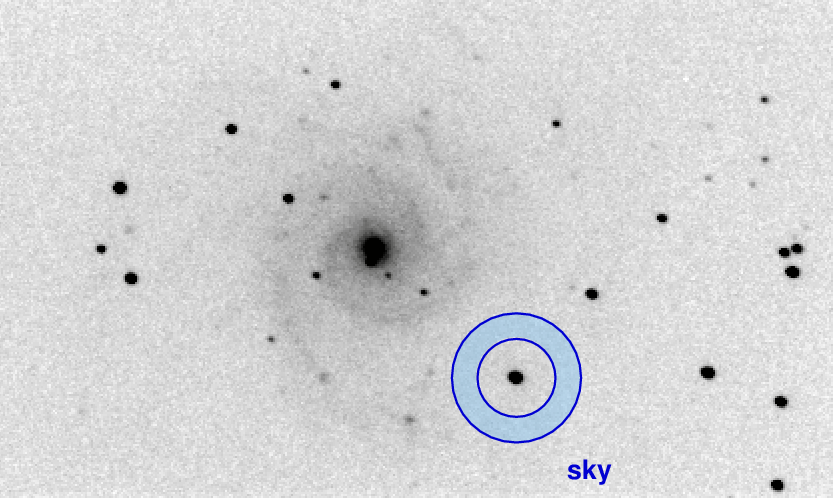
place a circular annulus around the star, measure the typical pixel value in the annulus, to get (sky)
star = (star + sky) - (sky)
But -- what if the target object is NOT in a region a smooth, uniform background? If the estimate of the sky value is incorrect, then the calculation of the target star's light will also be wrong.
Consider, for example, the case of the Virgo Cluster galaxy NGC 4526.
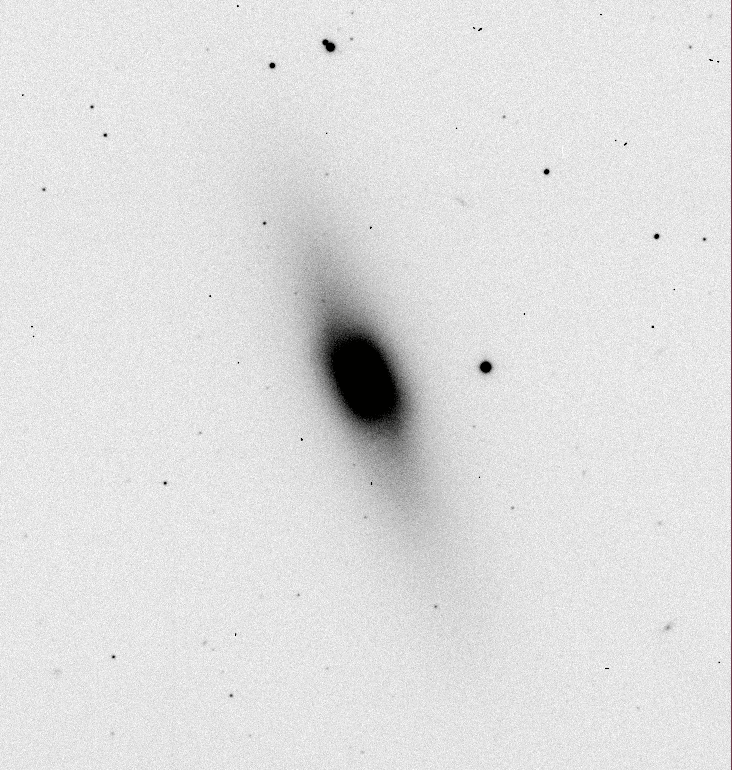
In March, 1994, something new and different appeared close to the nucleus of this galaxy:
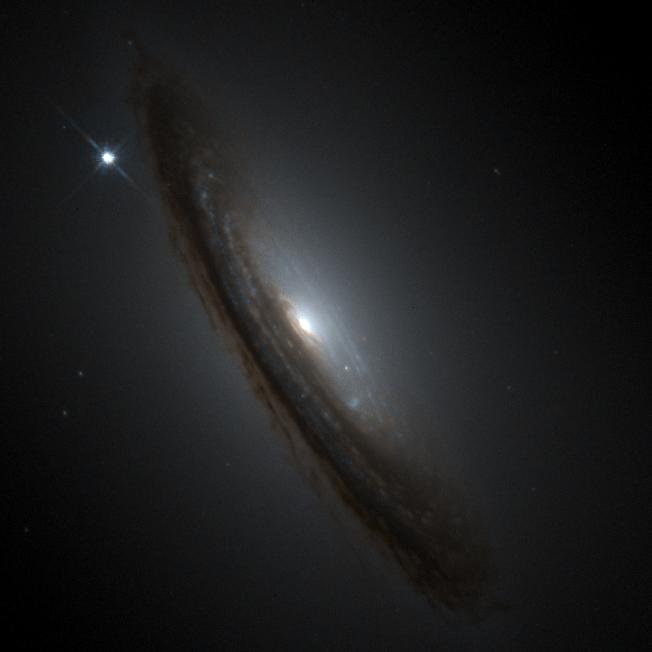
If you were lucky enough to have the Hubble Space Telescope at your beck and call, you could capture an image in which the background near this event, SN 1994D, wasn't too complicated.
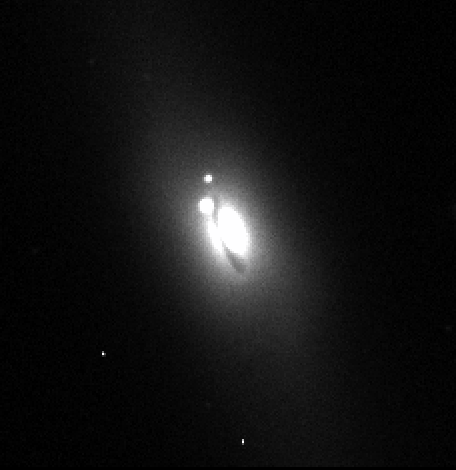
But for most of us, stuck on the ground, with small telescopes and mediocre seeing, the area around the SN had a large range of values, and no simple gradient.
Your Turn!
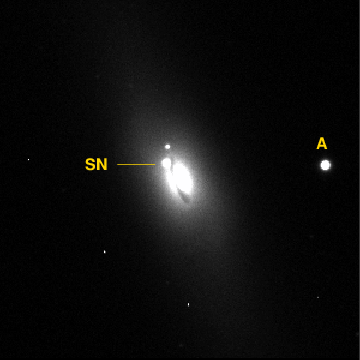
Using the FITS image of NGC 4526 below, measure the brightness of the supernova and of the star marked "A". What is the difference in magnitudes?
- image 'ngc4526_center.fit' (FITS format)
- measure the light from the bright star "A" in this image ( the answer)
- measure the light from the SN in this image ( the answer)
- compute the difference in magnitude ( the answer )
                                       ( SN flux   )
             delta_mag =  -2.5 * log10 ( --------- )
                                       (  A flux   )
Is there any way to make a "cleaner", less complex version of this image, before we try to measure the brightness of the SN? Yes -- and, in fact, there are two ways.
Let's look at rotation and subtraction first. This method works well if the SN is located in an elliptical galaxy, or the nucleus of a spiral. The basic idea is that the surface brightness of a galaxy may be axisymmetric: the region which is on the opposite side of the nucleus, at the same distance, may have a very similar surface brightness.

|
- |
|
= |
|
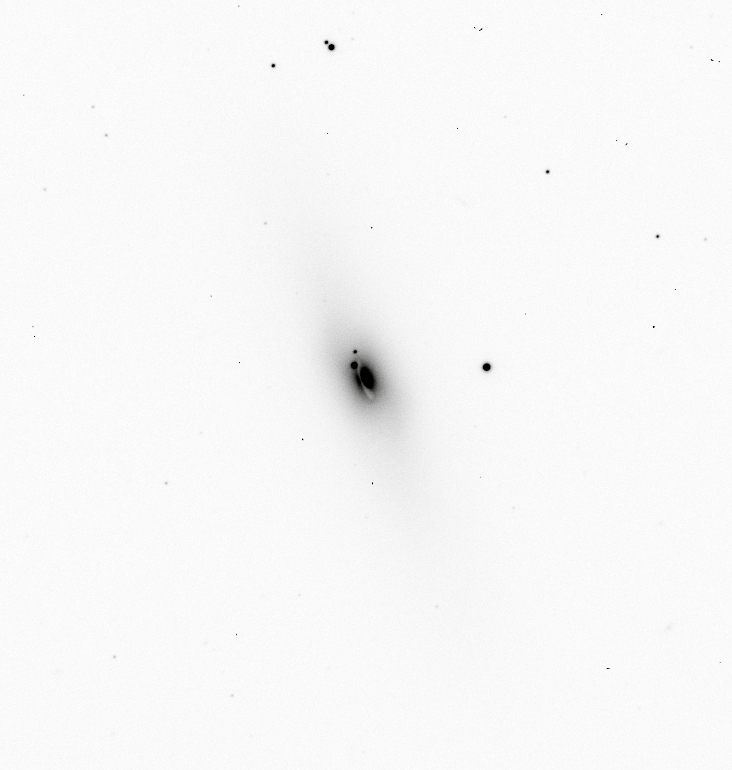
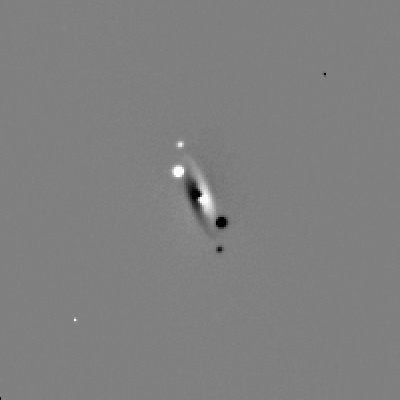
The output of this procedure is an image in which the background ought to be uniform and have a value close to zero, if the galaxy is nicely symmetric. In this particular example, you can see that the residual image is NOT perfectly uniform, due to the big dust lane near the center of the nucleus. However, it is at least less non-uniform than the original image, and so we can use it to make a better measurement.
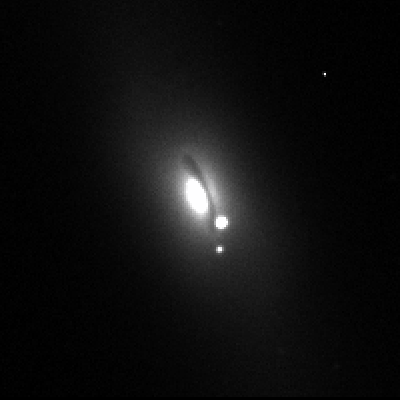
Your Turn!Using the image below, use the rotation-and-subtraction method to create a "cleaner" version of the original image. Then, measure the magnitudes of the SN and the bright star at the right-hand side of the frame. What is the difference in magnitudes?
- image 'ngc4526_center.fit' (FITS format)
- measure the light from the bright star -- call it "A" -- in the original image ( the answer)
- create a version of the image, rotated by 180 degrees around the center of the galaxy ( rotated version )
- subtract the rotated version from the original, leaving a residual image ( residual image )
- measure the light from the SN in the residual image ( the answer)
- compute the difference in magnitude ( the answer )
                                       ( SN flux   )
             delta_mag =  -2.5 * log10 ( --------- )
                                       (  A flux   )
The rotation-plus-subtraction method is quick and easy, but, as the example above shows, it doesn't always do a very good job of removing the background variations around the target. It won't even come close to working properly if the target happens to lie in an irregular galaxy:
or out in the arms of a spiral galaxy:
Image courtesy of Martin Fiedler, of
Astroclub Radebeul
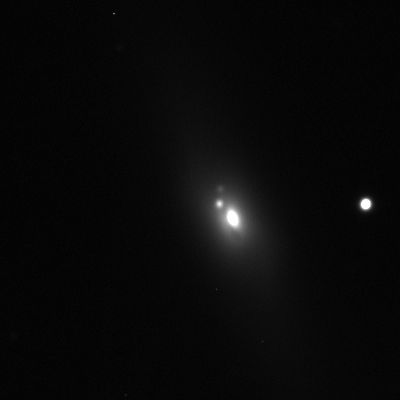
Is there a better way? Yes -- if you have the proper ingredients. If you have one image of a galaxy WITH the supernova, and another image of the same galaxy WITHOUT the supernova (either taken before the explosion, or long afterwards), then you can attempt the template subtraction method.
The basic idea is to tweak the two images (as described below) until they just about perfectly match each other; then, subtract the image without the supernova from the image with the supernova, leaving nothing but the supernova. It sounds simple, but the details can be devilish.
|
- |

|
= |
|
I would not recommend this technique if the two images weren't taken with the same optical system -- same telescope, same filter, same focal length, and so forth.
Your Turn!Starting with the "target" and "template" images below, go through all the steps required to modify the "template" so that it matches the "target" -- and then subtract it!
- target image 'target.fit' (FITS format)
- template image 'template.fit' (FITS format)
- measure the background sky value in each image ( the answer )
- subtract the background sky value from each image ( target and template)
- measure the light from the bright star (call it "A") in each image ( the answer )
- compute the ratio of brightness of star "A": ( the answer )
ratio = (brightness in target) / (brightness in template)- multiply the template image by this ratio, to match the two images photometrically scaled template )
- measure the FWHM of star "A" in both images ( the answer )
- compute the factor by which the image with better seeing ought to be smoothed ( the answer )
K = sqrt [ (larger_FWHM*larger_FWHM) - (smaller_FWHM*smaller_FWHM) ]- smooth the smaller-FWHM image with a gaussian of size K, to match the seeing ( smoothed template )
- measure the position of star "A" in each image ( the answer )
- compute the offset between its position in the images ( the answer )
dx = (target_x) - (template_x) dy = (target_y) - (template_y)- shift the template image by (dx, dy), so that it is aligned with the target image ( shifted template )
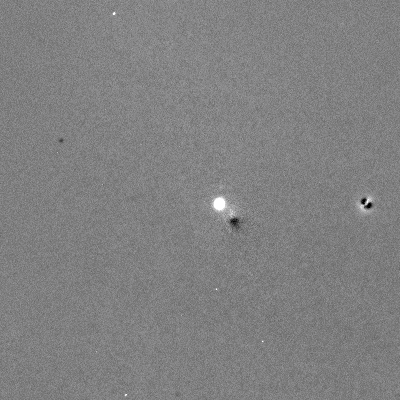
- subtract the modified template image from the (possibly) modified target image to yield the residual image ( residual image )
Hooray! That was a lot of work, but you should find that the residual image is much cleaner than the version created via the rotation technique. You can now (at last) measure the SN properly:
- measure the light from the supernova in the residual image, using the same methods used to measure star "A" in the sky-subtracted target image, step 3 above ( the answer )
- compute the difference in magnitude ( the answer )
                                       ( SN flux   )
             delta_mag =  -2.5 * log10 ( --------- )
                                       (  A flux   )
Phew. That's a lot of work, even after you manage to acquire a good template image. It would probably be a good idea to create a script or program which goes through all these steps automatically, so that you don't forget a step. I wrote one myself, using Perl and image processing routines from the XVista suite. Perhaps my script might give you some ideas ...
By the way, how do your values of the difference in magnitude between the SN and star "A" compare to each other?
    using unprocessed image:          delta_mag =  ____________

    using rotation-and-subtraction:   delta_mag =  ____________

    using template subtraction:       delta_mag =  ____________
You've done your best to measure the brightness of a supernova in one of your images, using the appropriate techniques for removing whatever background you can detect. That's fine ... but what about background that you can't detect?
What's that? Well, when we take images of external galaxies from here on Earth, we usually lack the seeing required to resolve individual stars in that galaxy. The light from all the stars in a single spiral arm, for example, may be blurred into a smooth band of light.
Consider the galaxy M74, a nearby, face-on spiral. The image below, taken with a 2.5-meter telescope, shows a wealth of detail, but most of the "stars" in the spiral arms are actually HII regions or clusters of stars all blended together.
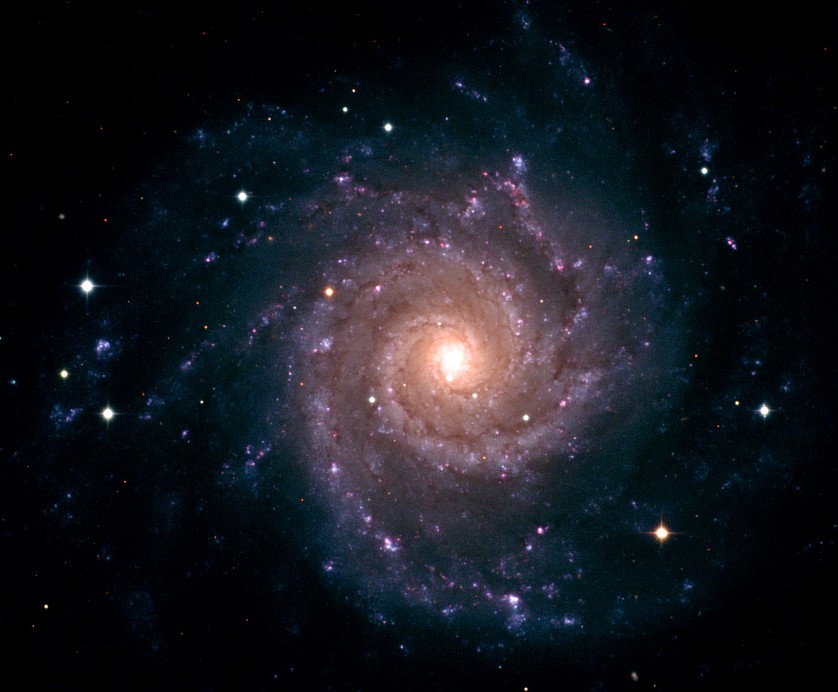
Image courtesy of Simon Dye (Cardiff University) and the Isaac Newton Telescope
With my little 12-inch telescope at the RIT Observatory, the results are considerably less deep, and details are blurred into a noisy mess.
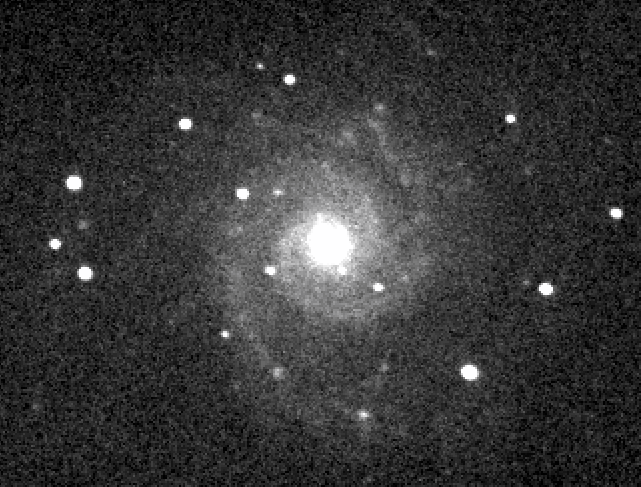
This image actually contains a (somewhat faded) supernova. Can you identify it?
       Q:  Where's the supernova?

       Q:  Which supernova is this?
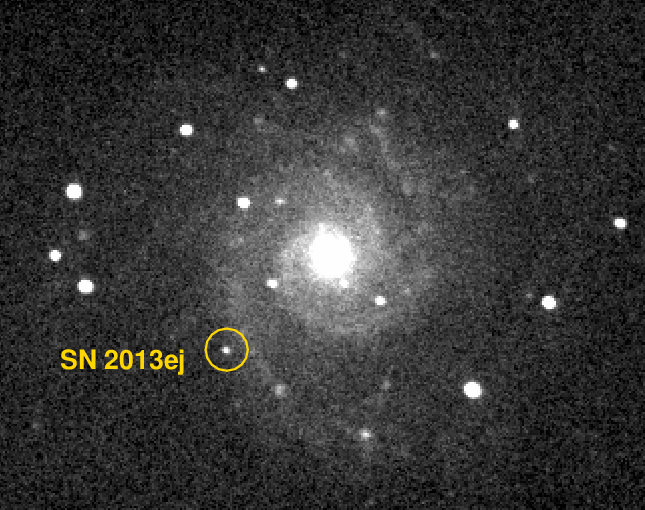
Right! Click on the image below to see its name.
Now, when this supernova was near its peak brightness, it was far, far brighter than any ordinary star, or even any cluster of stars, in its host galaxy. The distance modulus to M74 is approximately (m-M) = 29.8, so
                         absolute V mag       apparent I mag
                   ------------------------------------------------

 SN at peak                -17.3                 +12.5


  O6 star                   -4.0                 +25.8
  in M74

                   ------------------------------------------------
Since the SN was more than ten magnitudes (which is 100x100 = 10,000 times in intensity) more luminous than any star in its host galaxy at maximum light, we don't have to worry about contamination from such stars; they just won't add any significant contribution to the light we measure.
But at later times, as the supernova fades, the light from nearby stars in M74 might eventually start to contribute enough of the light within our aperture to bias our measurements. Is there any way to figure out just how large this contamination might be?
Maybe! If the supernova has exploded in a nearby galaxy, then just by chance, the Hubble Space Telescope (HST) may have already taken high-resolution pictures of the area, before the explosion. We can check those HST images to see just how much light is coming from the stars surrounding the supernova's location.
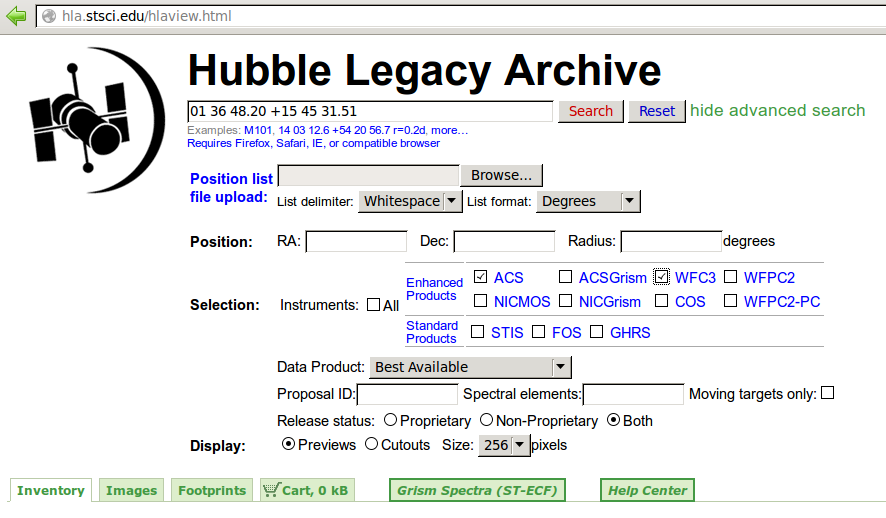
Let's find out just how important this contamination might be for SN 2013ej in M74. We can look for HST images in the Hubble Legacy Archive.
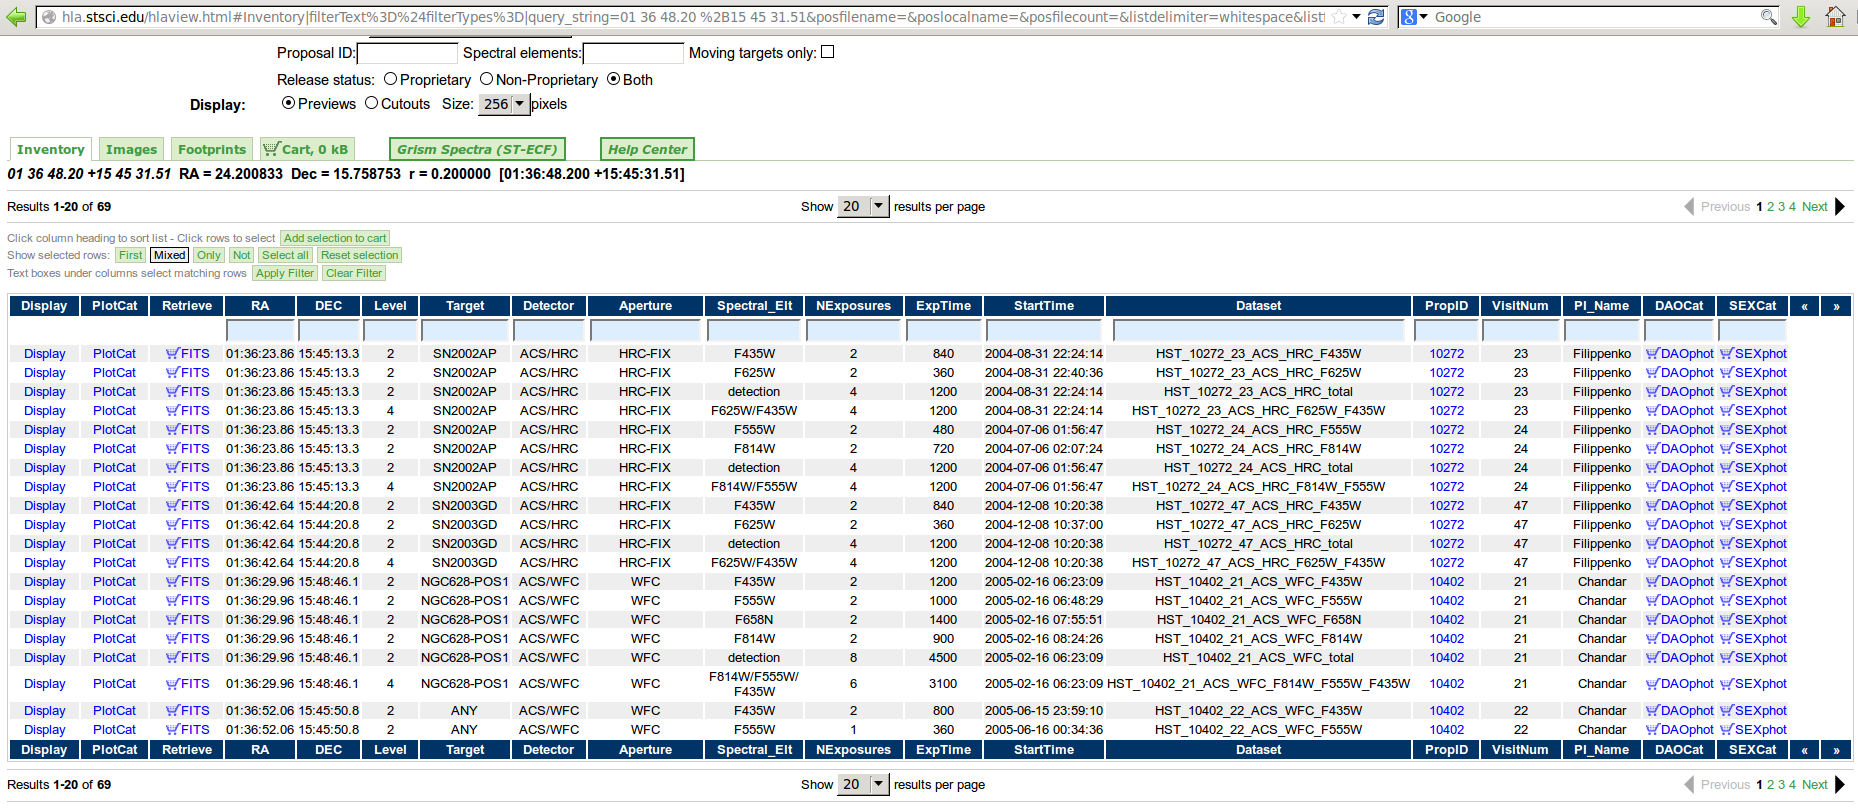
The location of SN 2013ej was (RA = 01:36:48.20, Dec = +15:45:31.51). I enter this position into the "Advanced Search" webpage at the Archive, and ask for ACS or WFC3 images only:
My request returns a list of 69 images -- only the first 20 are shown in the screengrab below.
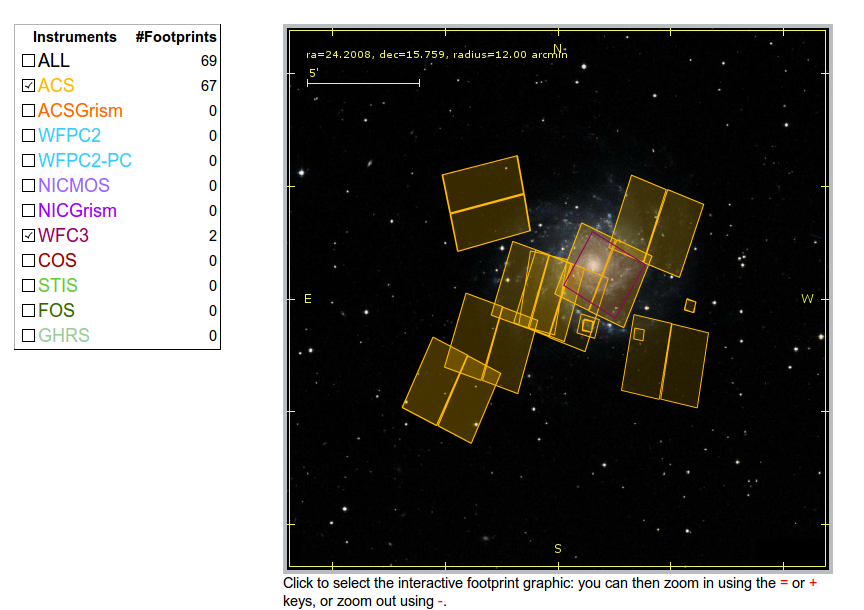
I can narrow down my search quickly by examining the "footprint" of all the HST images in this general area:
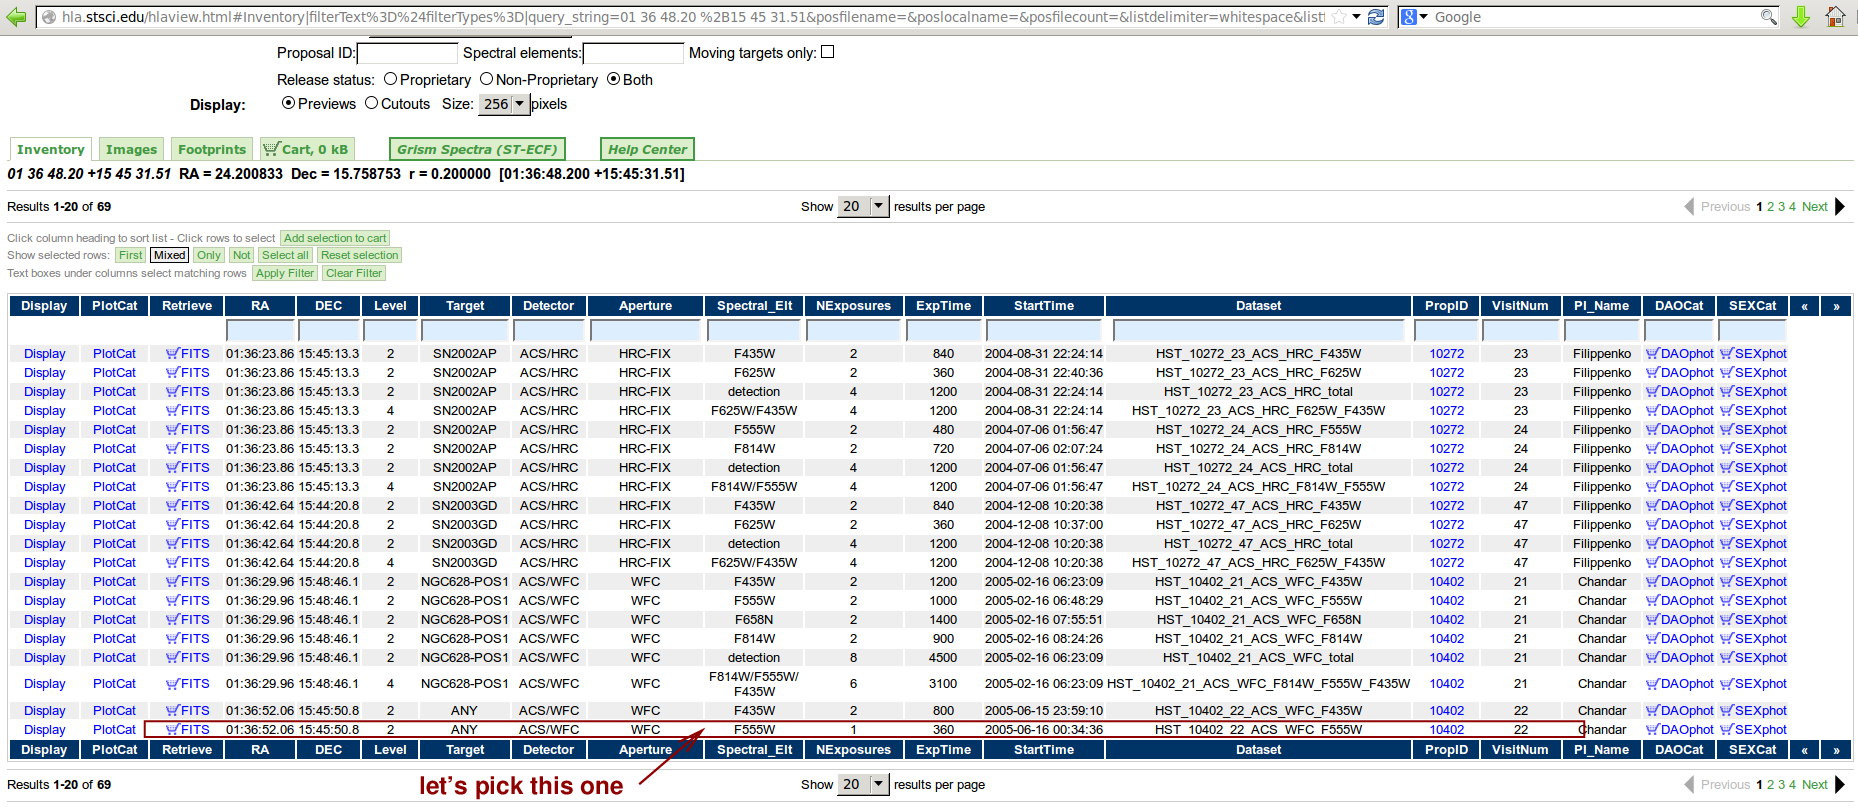
It looks like a good choice is this ACS image, named HST_10402_22_ACS_WFC_F555_drz.
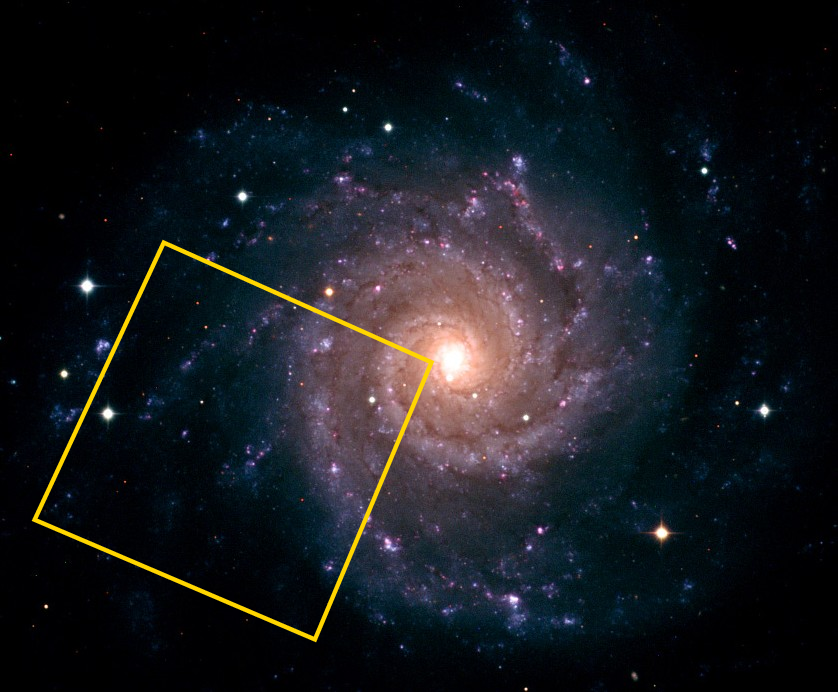
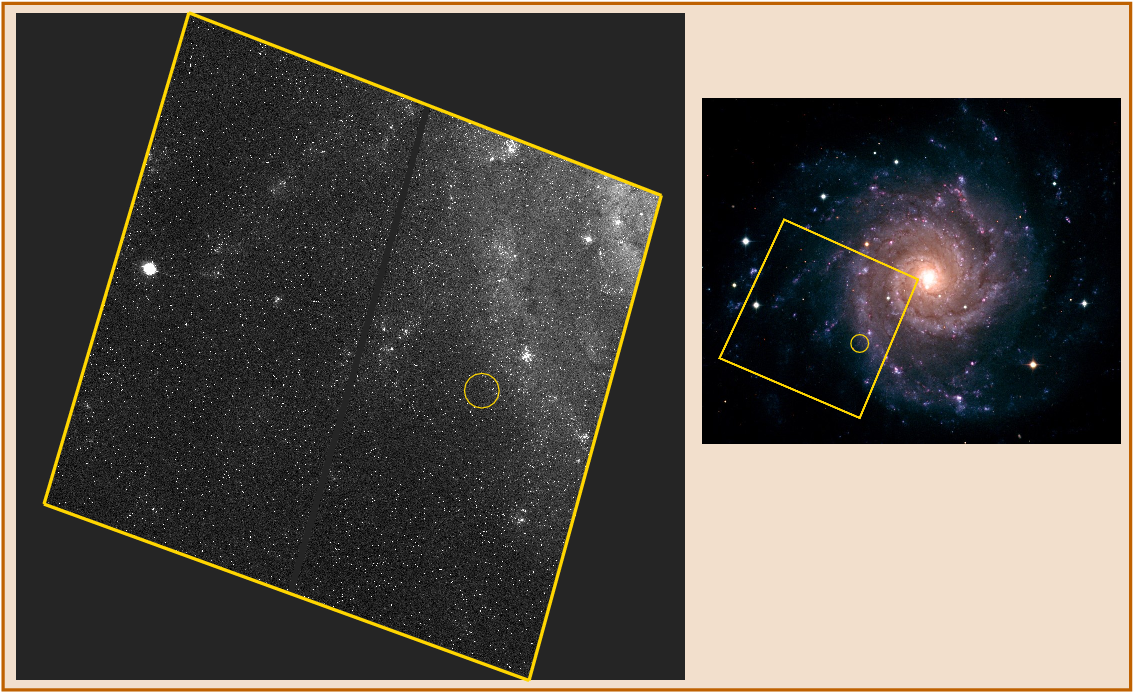
We can examine the HST image and zoom in on the position of the SN. The gold circle below is centered on the position of the supernova, roughly (3790, 2290), and has a radius of roughly 7 arcseconds, equal to the size of the aperture I used to measure the light of the SN in my images from Rochester. The pink box contains the brightest star in the neighborhood, which I'll call "P", at (3686, 2208).
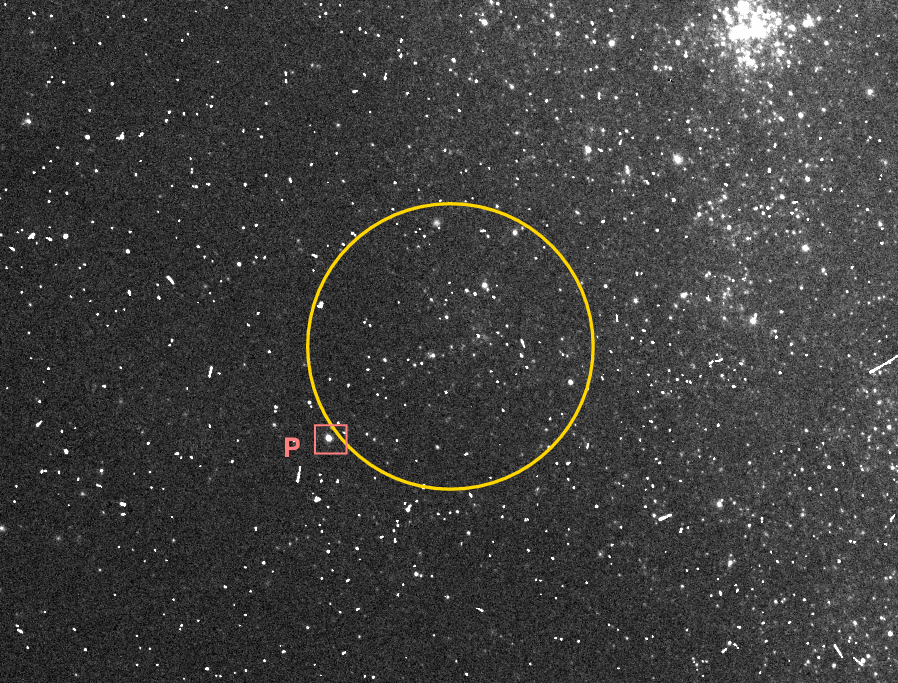
Now, many of the little white specks in the image above are not real objects in M74, but instead a marks left by cosmic rays striking the CCD. Distinguishing real objects from these artifacts can be a tricky business. If HST took several successive images of the same region, then those images can be combined to remove the cosmic rays.
Fortunately, the Hubble Legacy Archive contains not only images, but also catalogs of objects with rough measurements. Look over on the far right-hand side of the list returned by our web search:
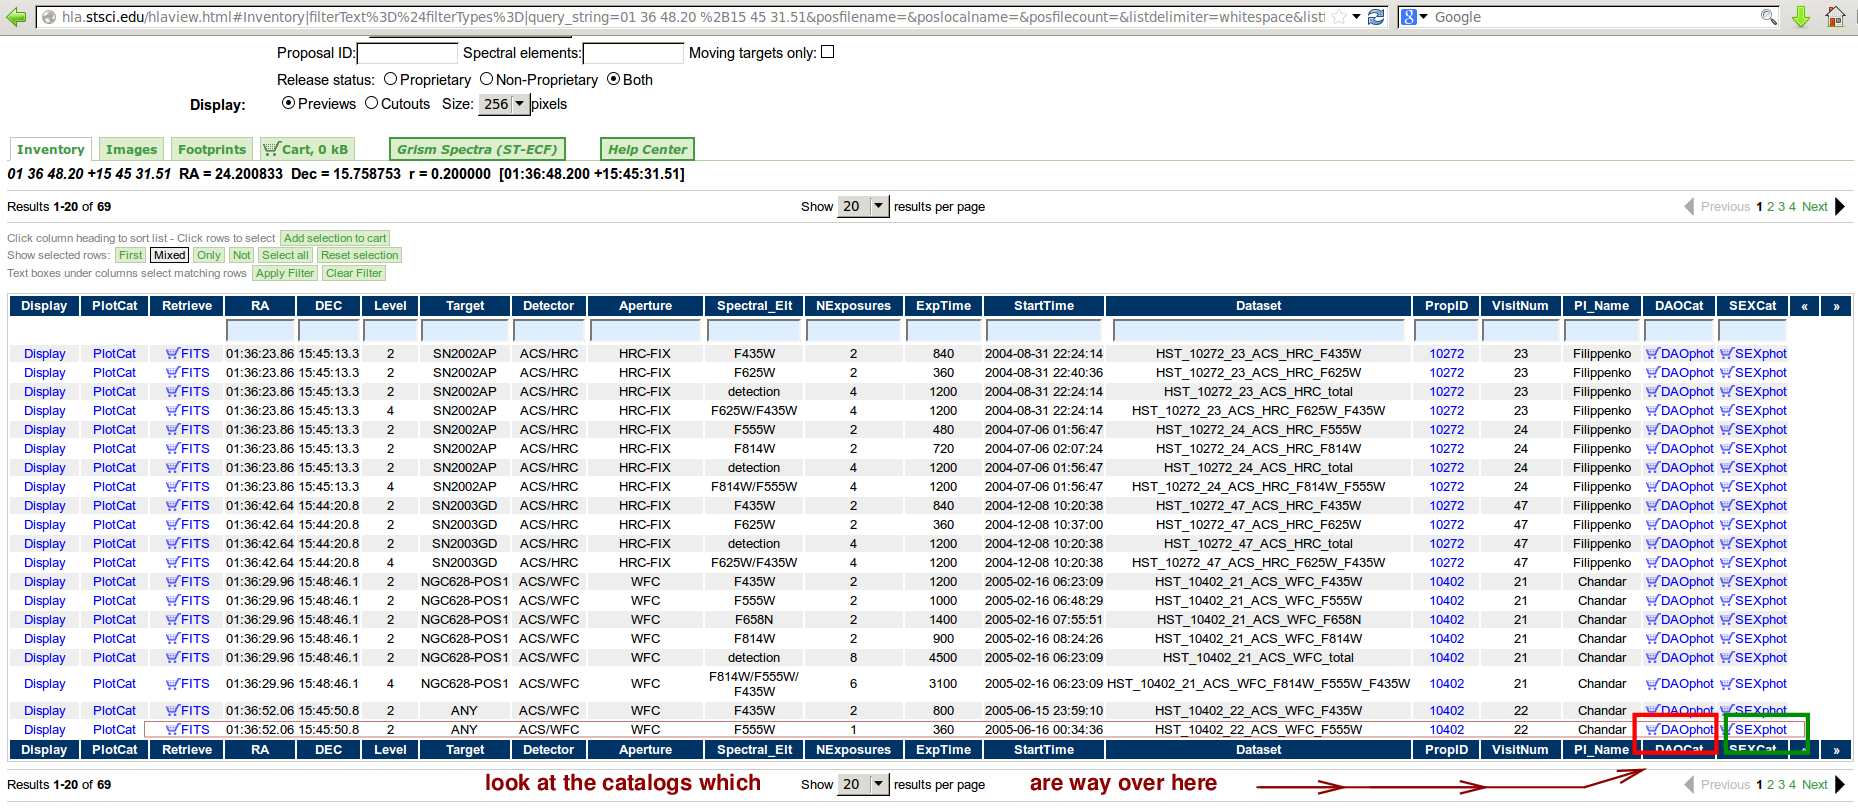
One can download one of these catalogs; I'll pick the DAOphot catalog. It's a plain ASCII text file which has a header, followed by one line per object detected in the image.
One can look in this catalog to get a quick measurement of the magnitudes of objects in the HST images.
Your Turn!Look in the catalog file for the F555 = V-band magnitudes of objects close to the position of the supernova.
- the SN is near (3790, 2290). What are the magnitudes of objects in this vicinity? ( the answer )
- star P is near (3686, 2208). What is its magnitude? ( the answer )
- six months after it exploded, the apparent V-band magnitude of SN 2013ej was roughly V = 16.4. Would the light from star P add add one percent to a measurement of the SN using a big aperture? ( the answer )
Just about any supernova in a nearby galaxy will outshine all the neighboring stars when it is near its maximum light. After several months have passed, however, it might fade enough that simple measurements through a big aperture will begin to include a significant amount of light from those neighbors. If HST just happened to have taken images of the region before the SN exploded, why not take a look? You might get a rough idea for how bad the contamination might be.
Copyright © Michael Richmond.
This work is licensed under a Creative Commons License.