 Copyright © Michael Richmond.
This work is licensed under a Creative Commons License.
Copyright © Michael Richmond.
This work is licensed under a Creative Commons License.
Let's practice some aperture photometry. We'll look at pictures of a field which has a very bright star near the center. Don't bother with it; instead, measure the fainter stars around it marked A, B, C and RX. The star marked RX is formally known as "RX J1643.7+3402"; you can look up information about it by visiting SIMBAD .
Each pair of astronomers should pick four of the images from the list below. To download an image, right-click on it and save to the desktop. Then read it into the MIRA program to measure instrumental magnitudes of the four stars.
Write down the instrumental magnitudes for each of the stars in each of the images, making a table like this:
                         Raw magnitudes
      Image         A         B        C        RX
   --------------------------------------------------
      rxa.040     -7.21     -8.20    -7.26    -7.61
      rxa.041
      rxa.042
      rxa.043
Next, create a table of differential magnitudes by subtracting the magnitude of star B from each of the other stars:
                      Differential magnitudes
      Image       (A-B)     (B-B)    (C-B)    (RX-B)
   --------------------------------------------------
      rxa.040      0.99      0.00     0.94     0.59
      rxa.041
      rxa.042
      rxa.043
When you are finished, write your differential magnitudes in the space provided on the blackboard.
Based on the measurements made by the workshop participants (each of whom measured 4 of the images), we derived differential light curves like this:
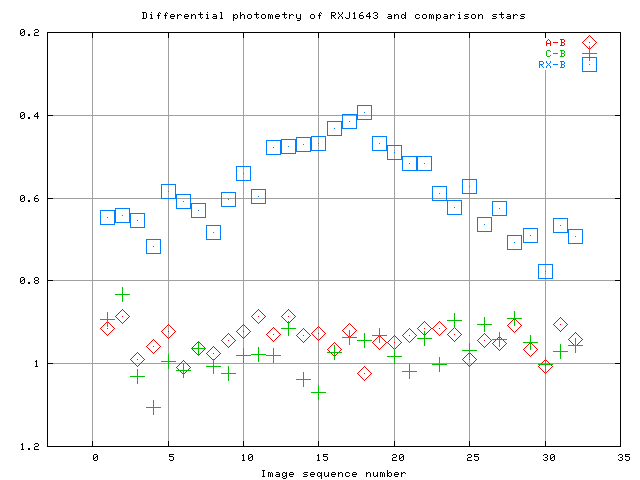
You can see that
When I reduced the data myself, back in 2002, I found the same behavior; only the details a bit different.
Copyright © Michael Richmond.
This work is licensed under a Creative Commons License.