 Copyright © Michael Richmond.
This work is licensed under a Creative Commons License.
Copyright © Michael Richmond.
This work is licensed under a Creative Commons License.
The goal of this course is to lead you on a journey through the universe on a large scale: our main subjects of study will be galaxies, both individuals and herds. However, in order to make sense of what is to come, you'll need to have a good understanding of some basic astronomical concepts, such as the magnitude scale, the units we use to describe masses and distances and luminosities, and so forth; and you'll also need to know a bit about stars, since they make up the galaxies we'll be studying.
Therefore, we should go over these ideas at the start, to make sure that no one is missing that little bit of knowledge which might be crucial to understanding the third stage in the cosmological distance ladder ...
Astronomers don't use the SI system of meters, kilograms and seconds very frequently (why not?). Instead, we adopt units which are similar in scale to the objects we study. You should know the meaning of all the following terms.
And one which often serves as a proxy for distance
Astronomers have devised several coordinate systems for describing the location of objects in the sky. The most widely used involves Right Ascension and Declination.
As with latitude, Declination is measured away from the celestial equator. But there is again no obvious choice for the starting point of the other set of coordinates. Where should we start counting Right Ascension? The rather arbitrary choice made by astronomers long ago was to pick the point at which the Sun appears to cross the celestial equator from South to North as it moves through the sky during the course of a year. We call that point the "vernal equinox".
There are several ways to express a location. The star Sirius, for example, can be described as at
Right Ascension 101.287 degrees, Declination -16.716 degrees
We can also express the Declination in Degrees:ArcMinutes:ArcSeconds, just as we do for latitude; and, as usual, there are 360 degrees around a full circle. For Right Ascension, astronomers always use the convention of Hours:Minutes:Seconds. There are 24 hours of RA around a circle in the sky, because it takes 24 hours for the Sun to move all the way from sunrise to the next sunrise.
Right Ascension 06:45:09, Declination -16:42:58meaning
What's the difference between an "arcminute" and a "minute"?
It is possible to convert from (RA, Dec) to (alt, az), or vice versa. One needs to know two factors:
In these modern times, it's usually easiest to use one of the many fine planetarium programs on a computer to do this work.
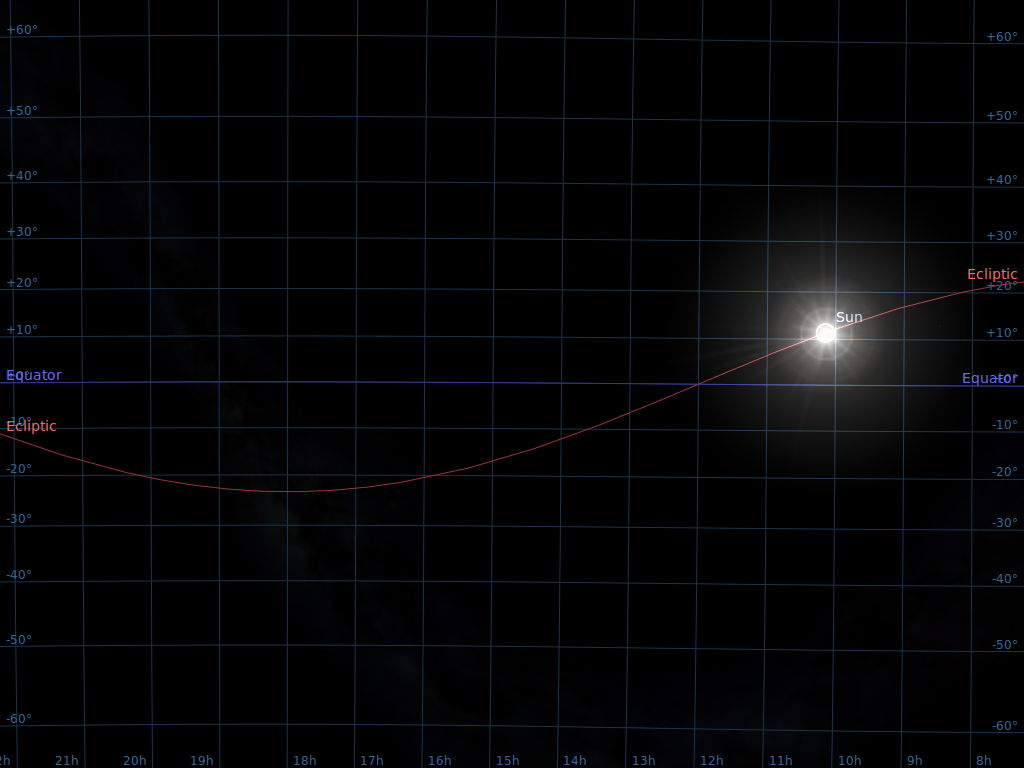
The ecliptic coordinate system is convenient when
dealing with objects in the solar system:
they are concentrated towards the ecliptic equator:
Ecliptic coordinates can also be important when you
want to avoid the solar system.
Telescopes in space, such as the Hubble Space Telescope
or the Chandra X-ray Telescope,
cannot point close to the Sun
(or else they might suffer damage to their detectors).
For some purposes, astronomers want to make very,
very long exposures: days or even weeks long.
During such a long exposure, the Earth may move a
significant fraction of its entire orbit,
which can cause a target originally far from the Sun ....
... to move closer to the Sun, from the telescope's point
of view.
Therefore, astronomers sometimes choose their
very deep fields
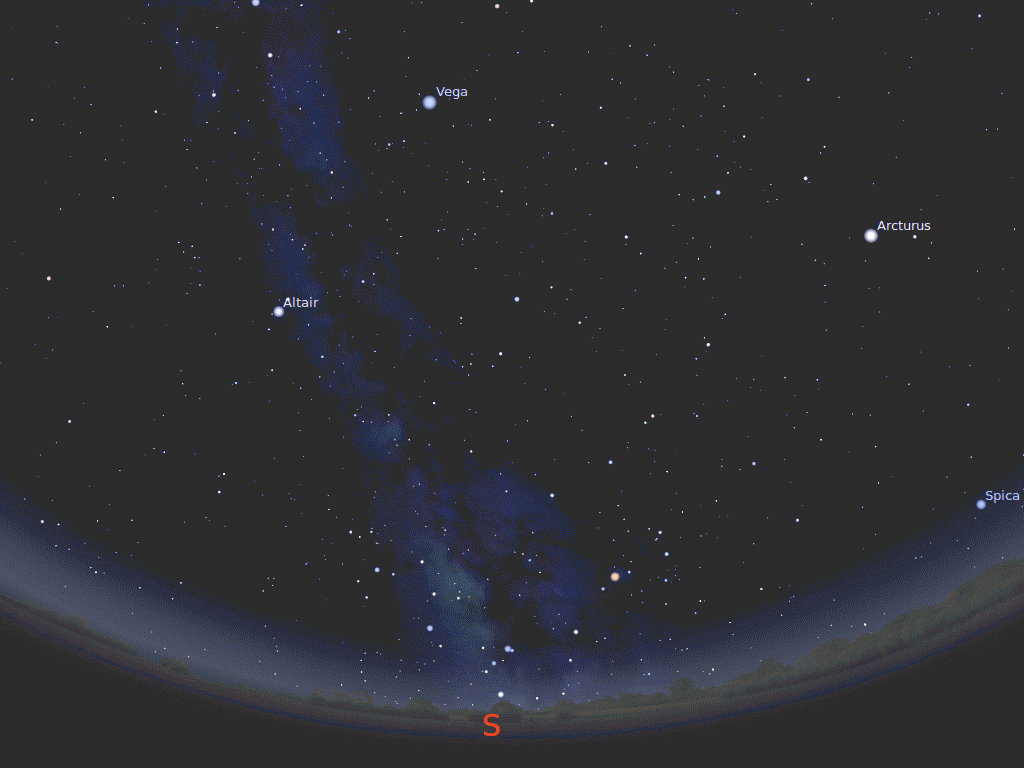
On a warm July evening in Rochester, the Milky Way
stretches overhead, with the galactic center
just above the southern horizon.
If you make a map of the sky in galactic coordinates,
the Milky Way runs right across the middle.
The section we see in the summer sky from Rochester is
in mostly the left half of this map.
An infrared map of the sky in galactic coordinates
made by the COBE satellite is dominated by emission
from dust in the Milky Way.
All these coordinate systems use two values to describe
the position on the surface of a sphere. It is possible
to convert from one system -- say, RA and Dec --
to any other system -- say, galactic longitude and latitude --
using spherical trigometry.
In general, you need to know three angular quantities
in order to make the
conversion:
In the bad old days, you would have to use these three
angles in a few long equations in order to convert
the position from one system to another.
But these days, it's usually easier to use a computer
to do the job. There are webs sites to do the trick
interactively, and lots of software libraries if you need to
convert many items.
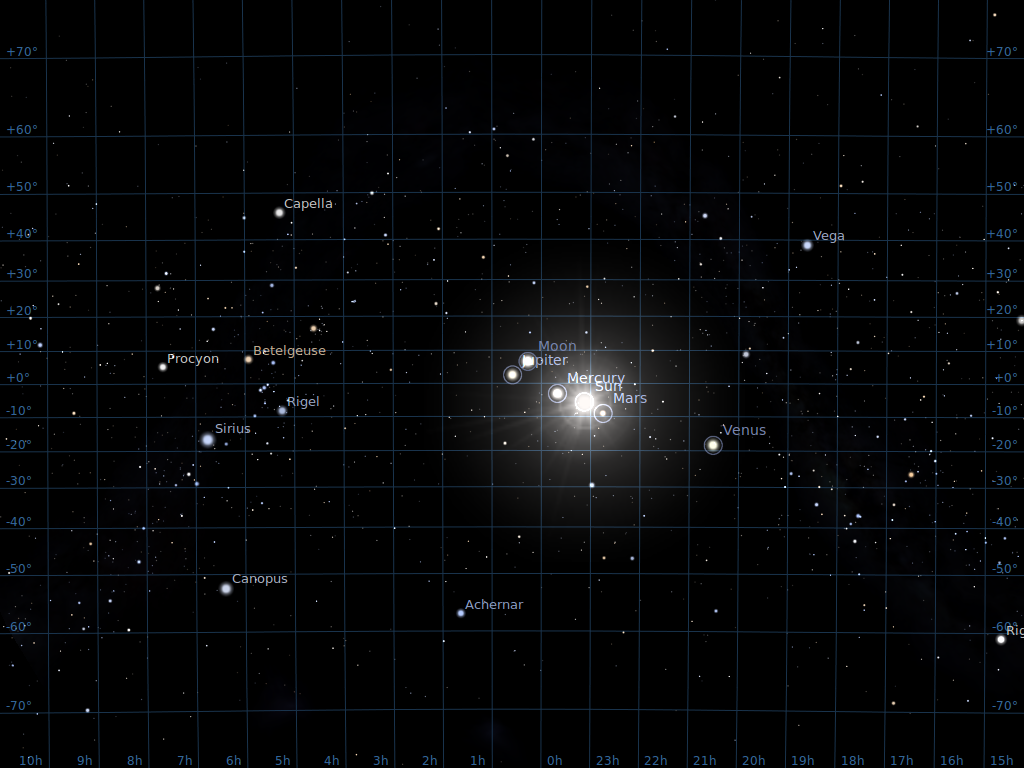
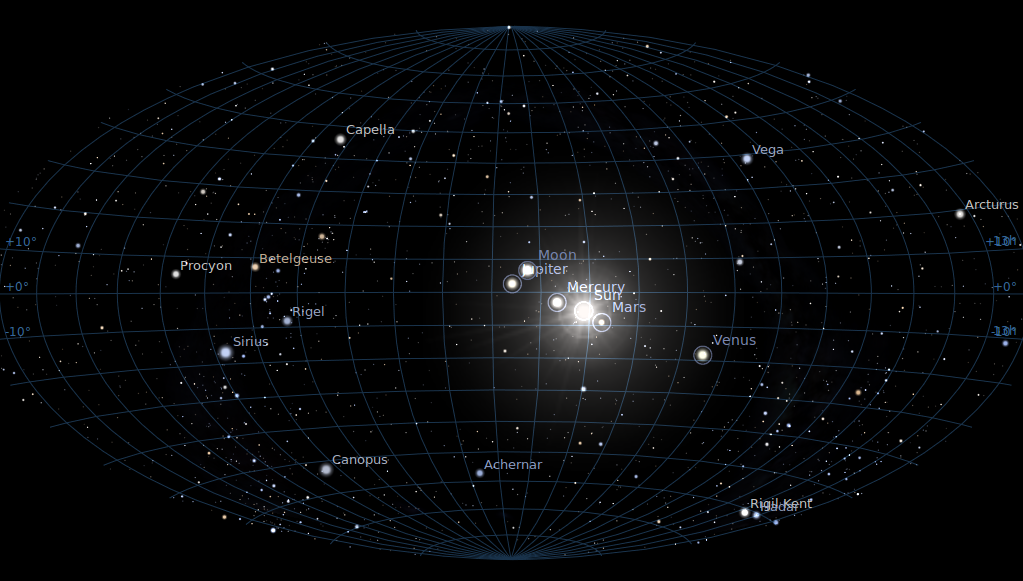
Note, by the way, that even when one has settled on a
particular coordinate system, one may still display the
information in different ways. For example, compare
this view of the sky in equatorial coordinates
and a Mercator projection
with this view, again in equatorial coordinates, but
using a Hammer-Aitoff projection:
Optical astronomers, and, to some extent, infrared astronomers,
are stuck with the historical artifact known as the
magnitude scale.
We describe the brightness of stars not in a linear
sense -- "this one sends 1200 photons per second into
our detector, that one sends only 492 photons per
second" --
but in a logarithmic sense.
Specifically, we have adopted the convention suggested
long ago by Pogson that, if two stars have intensities
of light
I1
and
I2,
then the difference in their magnitudes is
Note that this definition says nothing about the zero-point
of a magnitude: it provides only the DIFFERENCE between two stars.
Exactly where to set the zero-point of the magnitude scale
is a matter of some debate,
and eventually comes down to an arbitrary choice. We'll deal with it later.
One can convert from a difference of magnitudes to
a ratio of intensities like so:
Note that even a relatively small difference in magnitudes
can mean a very large ratio of brightness.
For example, Sirius, the brightest star in the sky,
has a magnitude of about -1.4.
If you look at a chart of its constellation
(Canis Major),
it is drawn as the biggest circle:
The stars in the little triangle to the upper-left of Sirius
are about magnitude 5.
Wow! That's much brighter, as you will see at once
if you look at a photograph of the area:
There are drawbacks to the magnitude system.
One of the big ones is the work one must do when
trying to figure out the result of adding or subtracting two
stellar sources, rather than multiplying or dividing them.
Suppose there are two stars, A and B, with magnitudes m(A) and m(B),
which appear so close together that their light blends into
a single source.
What is the magnitude of the resulting blend?
The proper way to do this calculation is to convert the magnitudes
back into intensities, add together the intensities, and then
convert back into magnitudes.
There's no way around it.
Why do we continue to use this system? There are several of reasons:
Astronomers who study objects outside the optical wavelengths -- in the radio,
ultraviolet, or X-ray regimes -- do not have any historical measurements to
incorporate into their work: these fields are all very recent, dating to the
1930s or later. In those regimes, measurements are almost always quoted in
"more rational" systems: units which are linear with intensity (rather than
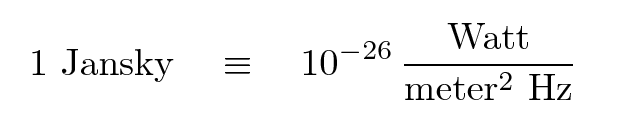
logarithmic) and which become larger for brighter objects. In the radio, for
example, sources are typically measured in janskys, where
A source of strength 5 Janskys is 5 times brighter than
a source of 1 Jansky, just as one would expect.
As you may have already noticed,
the magnitude scale
is defined in relative terms:
star A is 5 magnitudes brighter than star B.
But how is the zero point of the scale set?
In other words, how do astronomers decide that
stars A and B should have magnitudes 5 and 10
instead of 6 and 11, or 20 and 25?
There are two basic methods of setting the
zero point of a magnitude scale, both of which
are used at the present time.
Vega is commonly used as a fundamental
standard, and in some magnitude systems,
it has either a magnitude of zero
(or very close to it),
or a color of zero.
For example, the Johnson UBV
system is defined by
Johnson and Morgan (1953)
so that
the colors of stars of spectral class A0V such as Vega
are zero -- that is, (B-V) = 0 --
and the zero point is set, not by Vega, actually,
but by a set of stars near the North Pole
(see Table 3 in
Johnson and Morgan 1951).
The magnitude of Vega itself turns out to be
very nearly zero: V = 0.03, in fact.
The advantage of this system is that it's easy for
everyone to share, as long as you pick a good
fundamental standard or standards.
But if you happen to choose a standard which
varies, or which can't be seen from some parts
of the world, you're in trouble.
Moreover, it's not clear how to translate the
magnitude value for any star into physical
units, such as the flux of energy in some
particular range of wavelengths.
The SDSS u'g'r'i'z'
magnitude system, for example, is designed by
Fukugita et al. (1996)
so that
the following relationship holds between
the flux per unit frequency and the magnitude AB:
So, for example, an object of magnitude zero must provide
a flux (above the Earth's atmosphere) of
about 3.63 x 10⁻²⁰ ergs per second per square cm per Hz.
The big problem with flux-based systems is that it's
very, very difficult to measure accurately and precisely
the tiny amount of energy we can gather from any star
other than the Sun,
thanks in large part to the fact that we live at the bottom
of a very thick atmosphere.
Whatever magnitude system you happen to use,
be sure that you know where you can find the
definition of its zero-point.
You may need to use that zero-point to convert
the magnitude of an object into energy, or photons,
or some other sort of quantity.
For example, suppose you are trying to figure out
the proper length to expose your detector;
you want to achieve a signal-to-noise ratio
of 3000, which means you need to collect
at least nine million photons.
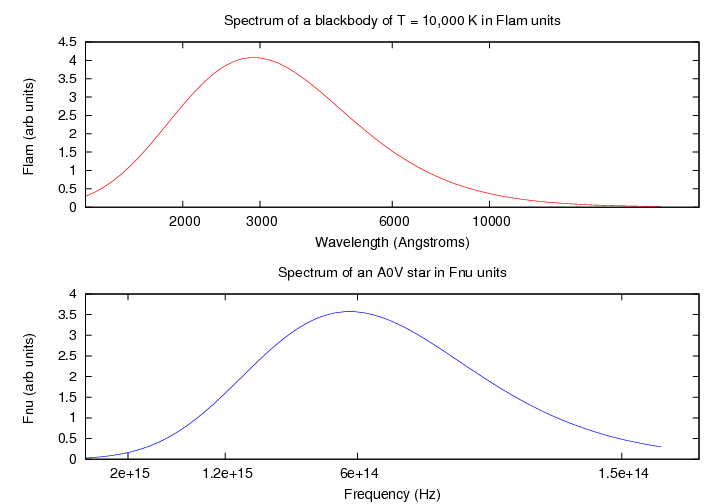
Notice, by the way, that astronomers may describe the
spectral energy output of a star or galaxy in two slightly
different ways.
The units favored by radio astronomers and (some) high-energy
observers, Janskys, are examples of "fnu"-type units.
They express flux density in terms of a frequency interval.
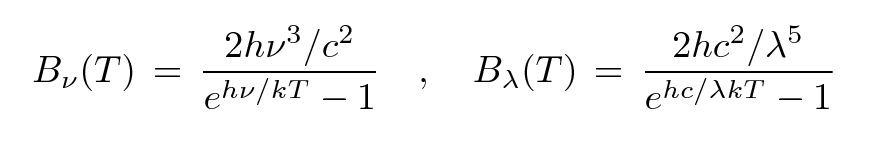
For example, consider a perfect blackbody.
The shape of the spectrum is slightly different,
depending on how you measure it.
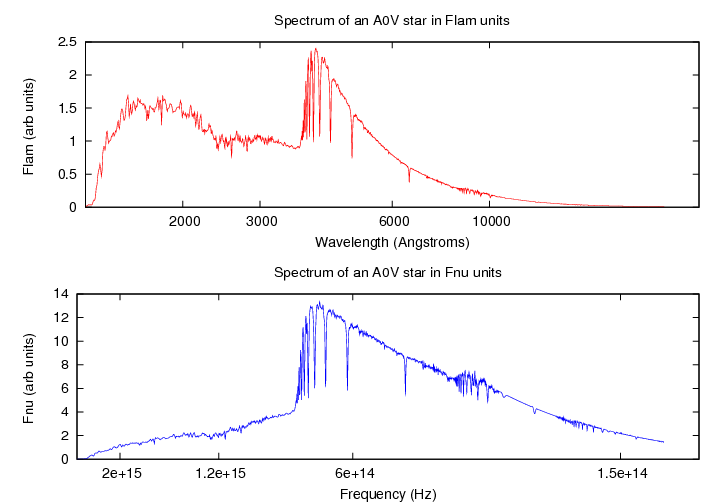
The spectrum of a real object can look quite different, too, depending on
which way you choose to display it;
consider this A0 V star, with data taken from
Pickles (1998).
Note that the horizontal axis is logarithmic in both cases.
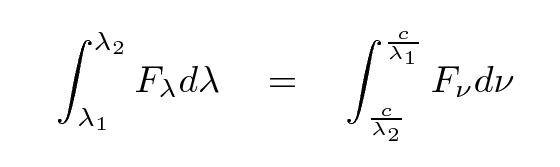
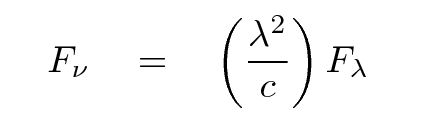
No matter how you express it, the bottom line is that an
object emits the same amount of energy within some
range of wavelengths as it does between the equivalent
range of frequencies.
That means
You can work out the relationship between the two ways of
expressing spectral energy density:
When we look up into the sky at night, we see some stars which
appear very bright, and others which are so faint that we can
barely detect them.
The star Sirius, for example, has a magnitude of about -1.5;
a bit more than one degree away, the star HD 49980
shines relatively feebly at magnitude 5.8.
No!
The reason, of course, is that two factors determine
the apparent brightness of a star in our sky.
In this particular instance, the apparent magnitude of these
two stars,
based on their apparent brightness
is quite misleading.
It turns out that Sirius is one of the closest stars
to the Sun;
it is only 2.64 parsecs away.
A parsec is a unit of distance equal to about 3.3 light
years, or 3.1 x 10¹⁶ meters;
we'll discuss this unit later.
On the other hand, HD 49980 is very distant,
located about 500 parsecs from the Sun.
Since we often want to compare the intrinsic properties of stars,
we'd like to have some measure of brightness which
is connected directly with luminosity;
a type of magnitude which does not depend on distance.
Astronomer convert apparent to
absolute magnitudes to compare stars fairly,
as if they were all side-by-side at a standard distance.
The ordinary convention is to write apparent magnitudes
with a lower-case letter m, and absolute
magnitudes with an upper-case M.
One can derive a formula which connects the apparent
and absolute magnitudes of a star,
using the inverse square law.
If we express the distance d in parsecs, then
Stars with small absolute magnitudes are truly luminous
beasts, radiating huge amounts of energy into space
each second.
Stars with large absolute magnitudes
are relatively feeble creatures,
dimly illuminating their immediate surroundings
but little else.
The difference between the apparent and absolute
magnitude of a star, (m - M), is called
its distance modulus.
As the equation above shows, it is a simple function
of the distance to the star.
In practice, astronomers sometimes prefer to
specify the distance to a star by its
distance modulus, rather than by the distance itself.
For example, Look at an extract from the abstract to
this paper on the distance to stars in the galaxy NGC 2403:
Why use distance modulus instead of distance?
I can think of two reasons, though they really
boil down to the same thing.
What is the absolute magnitude of the Sun, anyway?
The basic idea is that, from a practical, observational point of view,
it is often more useful to have a catalog of distance modulus
values instead of real distances.
A second advantage appears when astronomers use distance
modulus as a relative measure between two objects.
For example, the Large Magellanic Cloud (LMC), the nearest galaxy
to our own Milky Way, is often used as a stepping-stone
to other, more distant galaxies.
Our current estimate of the distance to the LMC is
about 50,000 pc = 50 kilo-parsecs (kpc).
Suppose that you measure the distances to the LMC
and several other galaxies by observing a particular sort of
star in each galaxy. You might find
Ten years from now, astronomers discover a systematic
error in measurements to the LMC;
instead of being 50 kpc away from us, it actually
turns out to be 60 kpc away.
Ecliptic (Solar System) coordinates
For objects within our solar system --
planets, asteroids, comets --
it often helps to use a coordinate system
centered on the Sun, with its equator running along
the plane of the planetary orbits.
We call this the ecliptic coordinate system.


to be not too far away from the ecliptic poles,
so that the Sun is always
many degrees away from these locations.
Galactic Coordinates
One more set of coordinates comes into play
if one studies the distribution of stars
within our Milky Way Galaxy,
or the distribution of other galaxies
in the far reaches of space.
Map courtesy of the
Lund Observatory
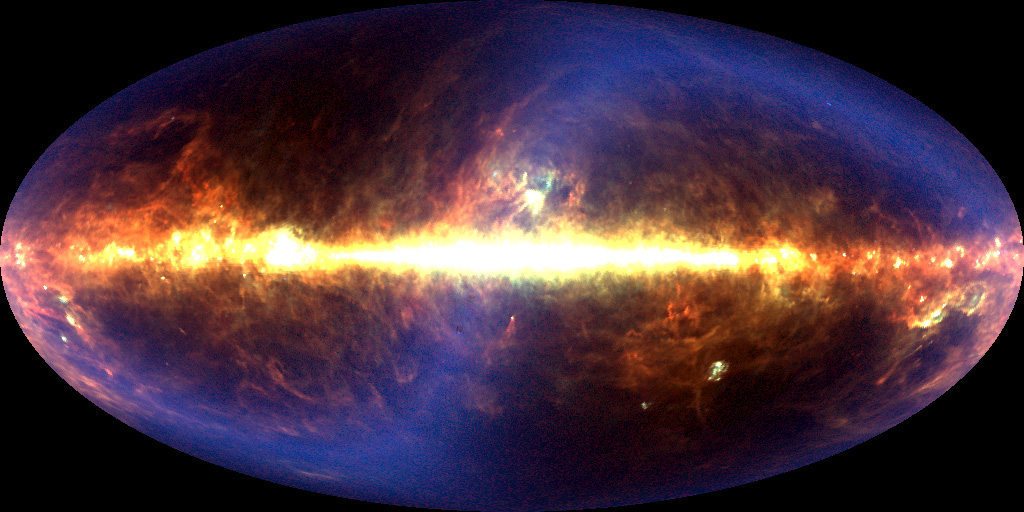
What is the faint blue band in this COBE image?
Converting from one set of coordinates to another
The magnitude scale

  Q:  How many times brighter is Sirius (mag -1.4)
      than a star of magnitude 5?
   Q: The average diameter of the dark-adapted pupil in
      a human eye is about 6 millimeters; the average
      person can see a star of magnitude 6 on a clear, dark night.
      If the same person were to look through typical 7x35 binoculars,
      how faint a star might he be able to detect?
The painful side of magnitudes: adding and subtracting
m(A + B) =? m(A) + m(B) NO!
Why do we continue to use magnitudes?
Zeropoints for magnitude scales

  Q:  You look at Vega, a star of apparent magnitude V=0,
      with a telescope of diameter d = 6 inches = 15 cm.
      Your detector-plus-filter combination is equivalent
      to the V passband, which has

             effective wavelength  =   5514  Angstroms
             effective frequency   =   5.50 x 10^(14) Hz
             equivalent width      =   9.05 x 10^(13) Hz

      How many photons enter the telescope each second?


      What should your exposure time be?
Apparent and absolute magnitudes
Q: How many times brighter does Sirius appear?
  Q:  Does this mean that Sirius is a much more powerful star,
      one which emits hundreds of times as much energy
      as HD 49980?
apparent magnitude: a measure of the brightness a star
appears to have as we observe it in the night sky from Earth
   Q:  How many times more distant is HD 49980?


   Q:  If we were to pick up Sirius and move it
       so that it was at the same distance as HD 49980,
       how many times fainter would it become?


   Q:  Which star would look brighter if they
       were sitting side-by-side at the same distance?
absolute magnitude: the magnitude a star would have,
if it were moved to a distance of 10 parsecs from the Sun.
   Q:  The distance to Sirius is 2.64 pc, and its apparent
       magnitude is m = -1.5.  What is the absolute magnitude
       of Sirius?


   Q:  The distance to HD 49980 is 500 pc, and its apparent
       magnitude is m = 5.8.  What is the absolute magnitude
       of HD 49980?
The distance modulus
     Q:  Joe Astro is studying the Andromeda galaxy.
         He notices a star in that galaxy which appears
         similar in many ways (color, temperature, etc.)
         to the Sun.  The apparent magnitude of this
         solar twin is m = 30.0.

         What is the distance modulus to the Andromeda
         Galaxy?
           apparent mag    distance modulus    distance
  galaxy     of star       relative to LMC       (kpc)
------------------------------------------------------
   LMC         16.5           0.0               50
   M31         24.3           7.8             1800
   M81         26.8          10.3             5740
------------------------------------------------------
For more information
Copyright © Michael Richmond.
This work is licensed under a Creative Commons License.