 Copyright © Michael Richmond.
This work is licensed under a Creative Commons License.
Copyright © Michael Richmond.
This work is licensed under a Creative Commons License.
Today's lab exercise should be carried out in pairs, ideally, but it's okay to do it by yourself or in a group of three.
In order to gain credit for this exercise, you must create a PDF document which provides the answers to all the questions. Submit the PDF to the instructor via the "Assignments" tab in myCourses.
You will be analyzing a set of images which were taken at the RIT Observatory back in 2014. In order to carry out the procedures in this exercise, you'll need to copy the images to a local folder on your computer. So, please begin by creating a folder with the following name:
Midway through the analysis, you'll need to have a sub-folder to hold the cleaned version of these images. Please create a folder INSIDE the asas_2014 folder, with the name
You can now download the images you'll be examining in today's lab. The quickest way to do that is to download this file, which is a ZIP archive.
Place the zip file into the asas_2014 folder and extract all the files from it. You should see a total of 40 FITS images:
asas14clclear-050.fit  dark1-001.fit  dark30-001.fit  flatclear-001.fit
asas14clclear-051.fit  dark1-002.fit  dark30-002.fit  flatclear-002.fit
asas14clclear-052.fit  dark1-003.fit  dark30-003.fit  flatclear-003.fit
asas14clclear-053.fit  dark1-004.fit  dark30-004.fit  flatclear-004.fit
asas14clclear-054.fit  dark1-005.fit  dark30-005.fit  flatclear-005.fit
asas14clclear-055.fit  dark1-006.fit  dark30-006.fit  flatclear-006.fit
asas14clclear-056.fit  dark1-007.fit  dark30-007.fit  flatclear-007.fit
asas14clclear-057.fit  dark1-008.fit  dark30-008.fit  flatclear-008.fit
asas14clclear-058.fit  dark1-009.fit  dark30-009.fit  flatclear-009.fit
asas14clclear-059.fit  dark1-010.fit  dark30-010.fit  flatclear-010.fit
As a check that the files have been transferred properly, run AstroImageJ and open the file called asas14clclear-050.fit. It should look something like this:
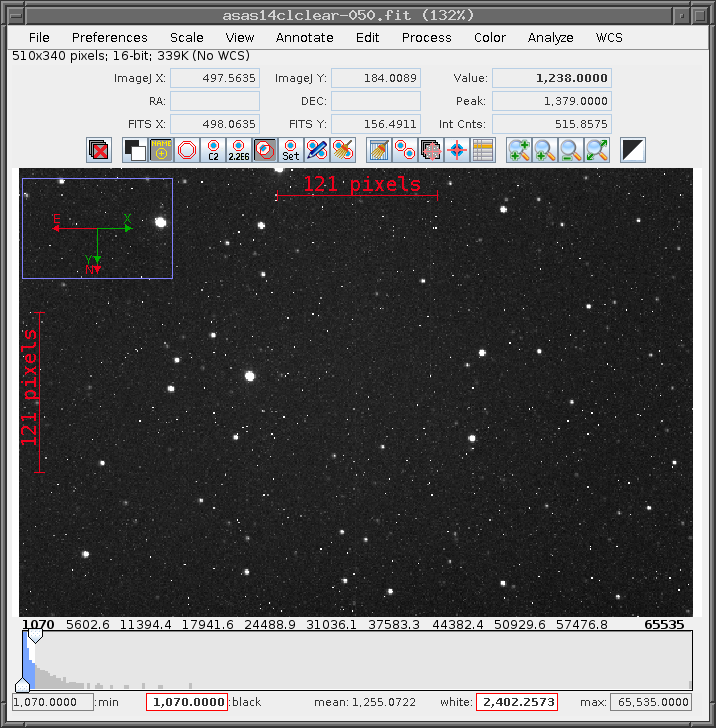
Use AIJ to answer the following questions.
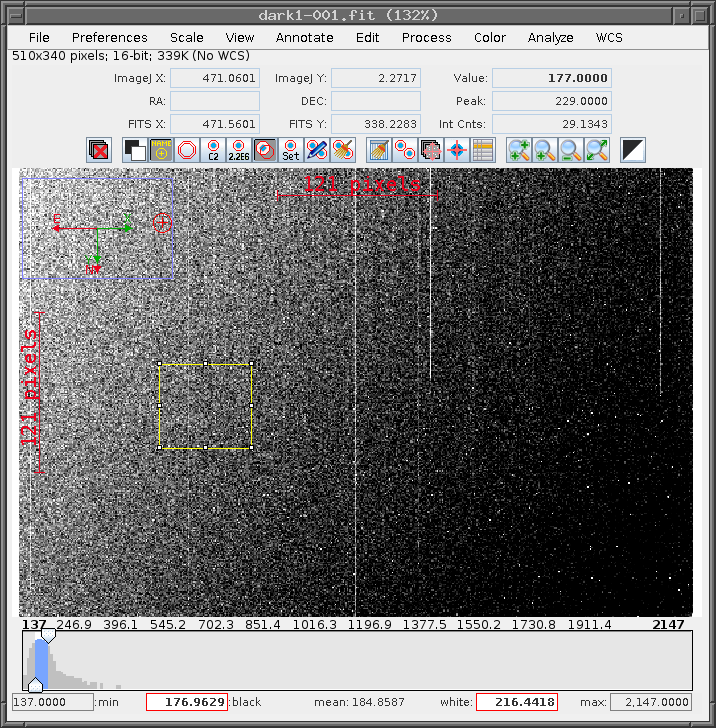
There are ten images with exposure times of 1 second, each taken with the lens cap covering the front of the telescope. These are "dark" frames. In theory, they should be empty, with all pixels values zero, since no light reached the camera. However, if you examine them, you'll see that their pixels are most definitely not zero. Let's examine them quantitatively.
Display the first in the set, dark1-001.fit. First, use the Edit -> Measurement settings command to pop up a window labelled Set Measurements. In this window, check the box for "Standard deviation."
Next, use the Analyze -> Measure * command to compute the mean and standard deviation of all the pixels in the image.
We can also draw a little box by choosing the AstroImageJ main window (the thin little window not attached to any image) and clicking on the left-most box, which shows a rectangle. After pressing that box, move your cursor to the image and left-click-and-drag to create a region which roughly the size shown below.
Now use the Analyze -> Measure * command again to compute the mean and standard deviation of the pixels in this region.
The plan is to subtract the "dark current" shown in these 1-second dark images from a set of 1-second flatfield frames; but, as you can see, these individual dark images are pretty noisy. We could create a less noisy version of the 1-second dark current by combining a set of individual 1-second exposures. Here's how to do that.
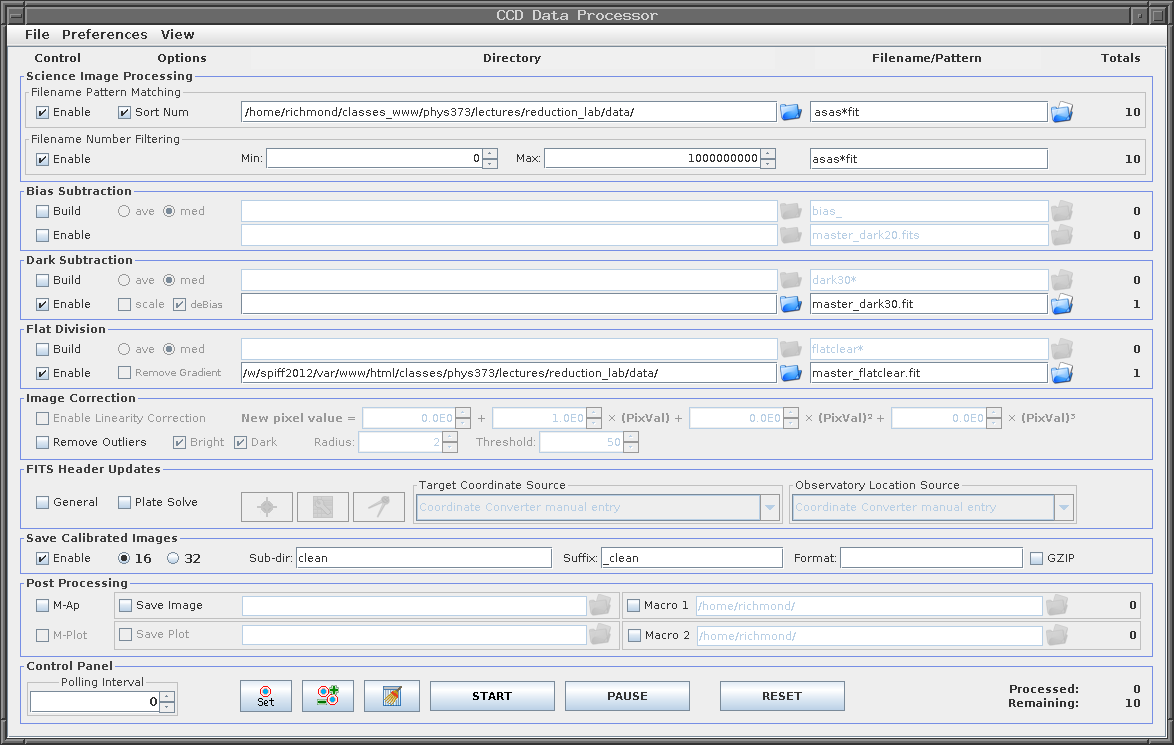
In the image window, Process -> Data reduction facility .... The "CCD Data Processor" window will appear. We will give it a list of images to process, and tell it that it should "Build" a master dark image. Fill in the portions of the window shown below -- but replace the name of the folder in the "Filename Pattern Matching" box with the name of the folder on your computer which contains the raw images.
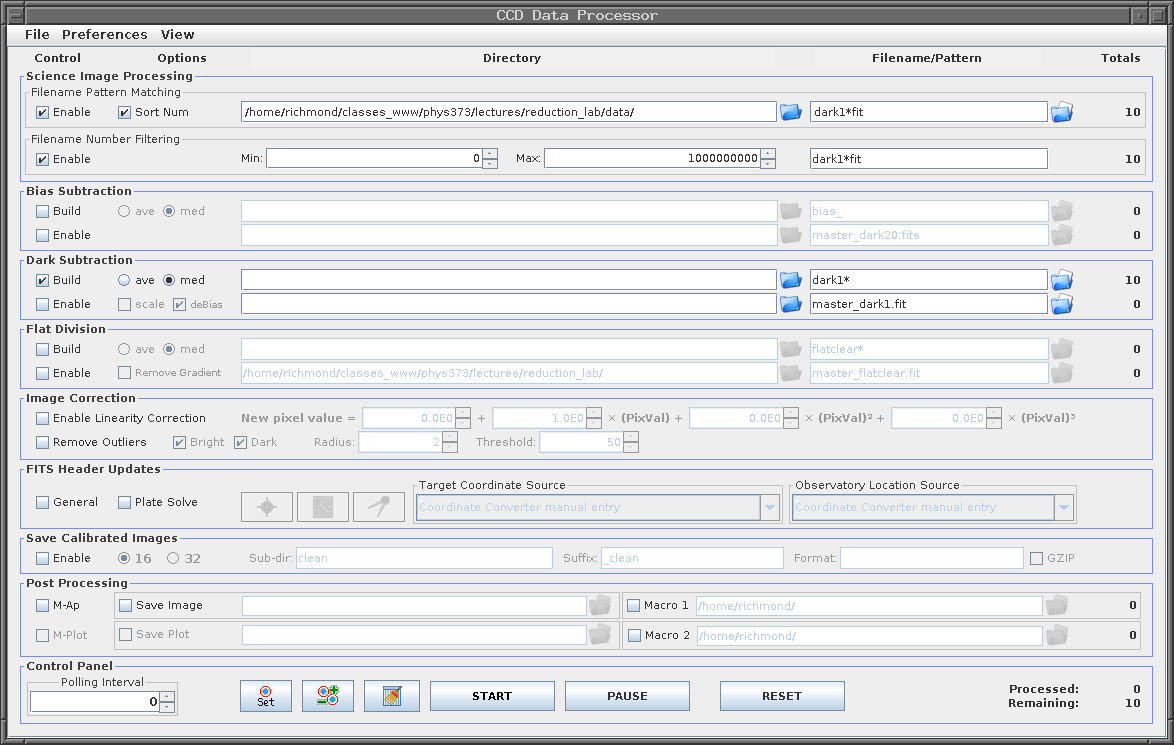
(Note that we choose the median option, rather than the average, when we create the master dark frame)
Click on the "START" button at the bottom to bring the procedure. After a short time, two new windows should pop up: a "Log" window should pop up, with a list of the operations it has carried out, and a new image window.
There should now be a new image in your folder, with the name master_dark1.fit. Open this image in a new window, and compare it visually to one of the raw 1-second dark images.
Now, use the Analyze -> Measure * command to compute the mean and standard deviation of this master dark frame.
Our target images have an exposure time of 30 seconds, so we'll need a "master" dark frame with an exposure time of 30 seconds, too. Fortunately, our dataset contains ten dark images with exposure time 30 seconds. You can repeat the steps from the previous section to combine these ten individual dark images into a single "master" image.
Do so, creating a new image with the name master_dark30.fit.
In addition to correcting for the "dark current", we'd also like to remove any variations in sensitivity across the focal plane. A perfect telescope and camera would respond to light equally in all locations ... but real telescopes tend to concentrate more light at the center of the image, and real cameras often suffer from the shadows of dust particles. In order to remove these effects, we create "flatfield images" by pointing the telescope at a blank white card, or a region of the sky at twilight. The result OUGHT to be a uniformly lit picture; we can use any deviations to gauge the sensitivity of each pixel, and remove it later.
On this night, I took pictures of the sky during twilight. It was still too bright to show any stars, so the pictures should be uniformly bright. Let's take a look at one. Open the image called flatclear-001.fit.
In addition to the big systematic variations you can see easily, this image contains also contains random pixel-to-pixel variations. When we divide our target images by the flatfield frame, those random variations would introduce a source of noise into our measurements. So, in order to make a less noisy flatfield frame, we can combine ten individual 1-second flatfield frames to create as "master" flatfield frame.
Note that we ought to subtract the 1-second master dark frame from each individual flatfield image first, and THEN combine them.
Fortunately, AstroImageJ's "CCD Data Processor" window can do all this work for us. Open the window again, if necessary, and enter information as shown below. Again, replace the folder name in the Science Image Processing box with the appropriate folder on your computer. Note how we've modified the entry in the Dark Subtraction box from "Build" to "Enable"; that means that the master dark will be subtracted from each raw flatfield frame first, before they are all combined. Once again, we have chosen the median, rather than the average, when combining the images.
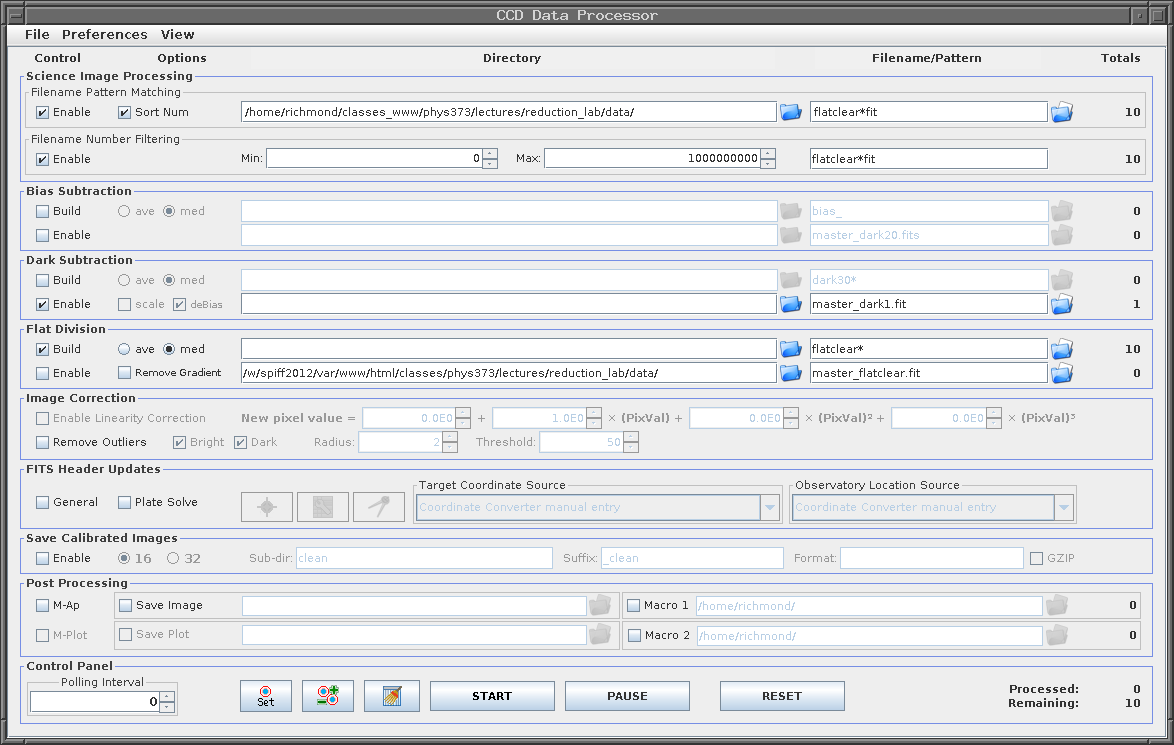
Click on the "START" button to create the master flatfield frame, which should have the name master_flatclear.fit.
We are finally ready to clean the target images. The procedure is
The "CCD Data Processor" window can do both steps at once, and save the results in a new folder. Enter information in the window as shown below. Note the changes:
Click the "START" button, and again, two windows will appear. One lists all the actions taken by AIJ, and the other shows the results of the work; specifically, a clean version of the final target frame.
Hooray! We now have a set of clean CCD images of our target, plus a number of comparison stars. We are ready to make measurements of stellar brightness.
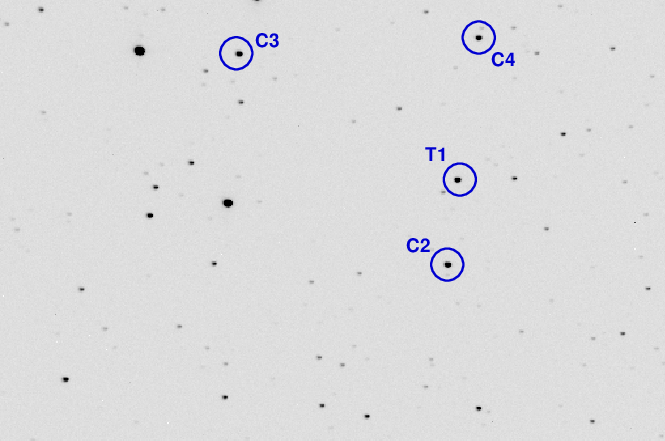
It's time to measure the brightness of the target star and three other stars on each of the images. The chart below identifies the target (T1) and the three comparison stars (C2, C3, C4) that we will use.
As we saw in the previous lecture, in order to perform aperture photometry properly, we need to choose the size of three circles:
There are a number of ways to do this. One way is to move the cursor to a star, hold down the "Alt" key, and left-click on the star. Doing so will cause a "Seeing Profile" window to appear.
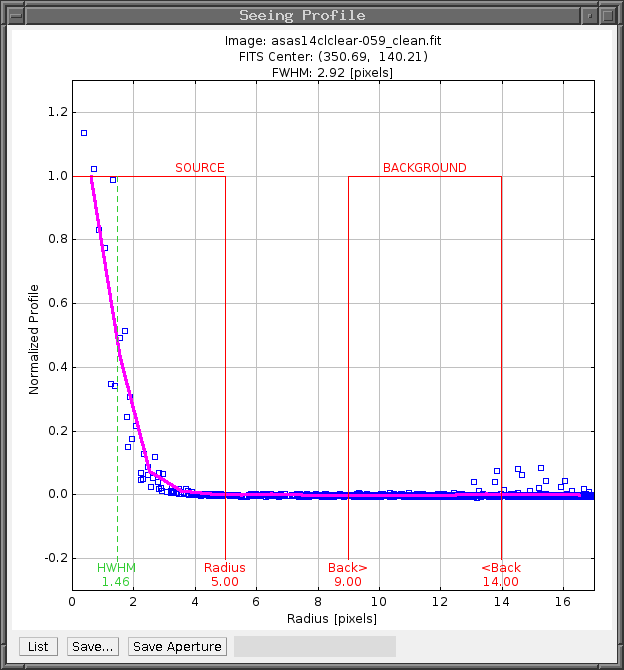
In this window, you can see the radial profile of the star, and judge how far out its light extends. The window will provide suggested values for the three radii (shown in red), but you should make your own decisions.
Examine several different stars in the image to get some idea for the range of stellar widths. Then, choose values for these three radii.
Run the image window's Analyze -> Multi-aperture command. A new window, "Multi-Aperture Measurements", will pop up. It will look something like this:
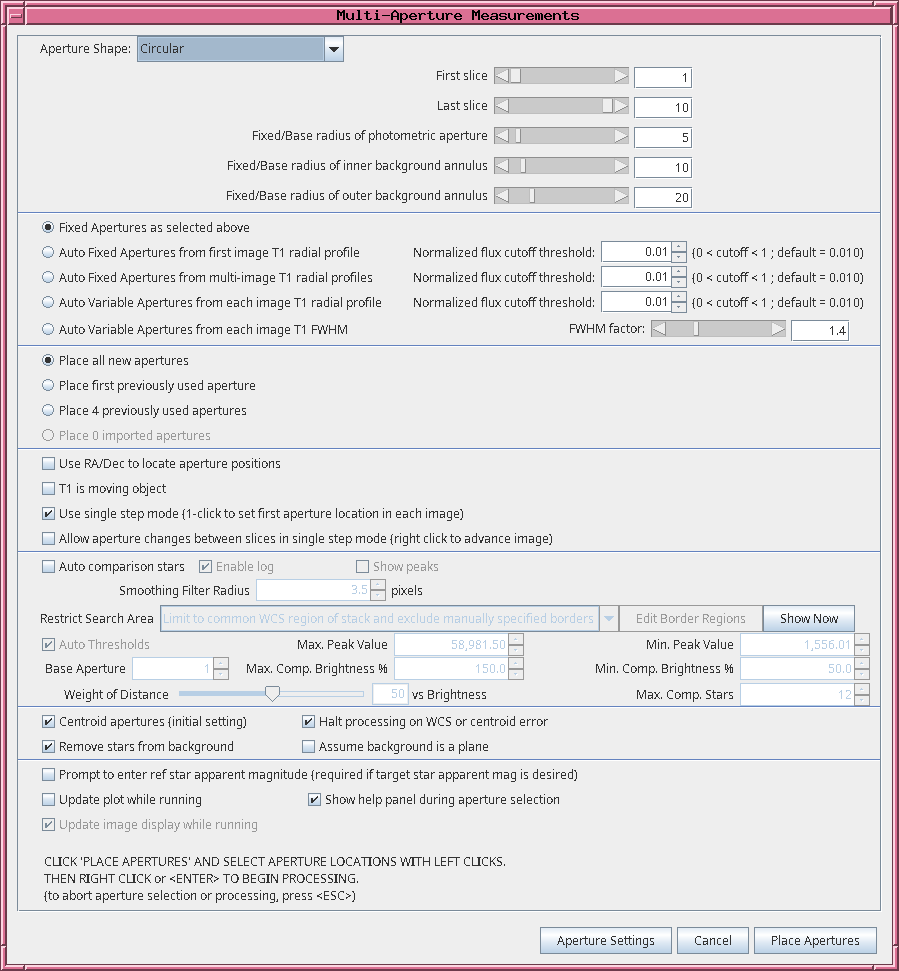
First, enter your values for the aperture sizes into the three boxes near the top of the window (the ones labelled "Fixed/Base radius ...").
Next, make sure that the checkboxes and radio buttons match the values shown in the image.
Phew. You are now ready to measure the stars!
It's time to measure the brightness of these four stars in all ten of the images. AIJ will do most of the work for us, we just have to give it a little guidance. Here's the basic idea: using the image window which shows one of the clean images,
In this way, we can quickly loop over a bunch of images, measuring the stars in each one. AIJ will save all the measurements in a single large spreadsheet file. Later, we can grab numbers from this spreadsheet to calculate relative magnitudes and make a light curve.
So, let's start. To simplify things, close all image windows. Now open a new image window to display the first clean image, in the clean folder.
Next, use File -> Open image sequence in new window to open all 10 of the clean images as a sequence in a new window. To do that, choose the first clean image, then, when the "Sequence Options" window pops up, enter "10" into the "Count" box (labelled "Number of images" in some version) and click "OK". The result should be a window with a set of ten clean images of the target. You can move the horizontal slider bar under the image to the left or right to display different images in the sequence.
Run Analyze -> Multi-aperture, and make sure that the "First slice" is set to 1, and the "Last slice" is set to 10. That will cause our measurements to run from the first to the last of the clean images.
Now click on the "Place Apertures" button at the bottom of the window. Indicate the locations of the target and the three comparison stars by
It's Show Time! You can begin the measurement process by clicking the right mouse button. A window called "Measurements" should appear, containing measurements from the first image.
In addition, a new image will appear in the window. All you need to do is indicate the position of the target star:
AIJ will figure out where all the stars are in this image, measure them, and write its results to the "Measurements" window. Afterward, it will again display the next image in the sequence.
Repeat this procedure in order to measure stars in all ten target images. All you have to do is left-click on the star "T1" in each image, and AIJ will do the rest.
When you have finished, the "Measurements" window should contain 10 rows. Use its File -> Save as command to save these measurements in a spreadsheet (.xls) file.
Congratulations! You have measured a set of stars in a bunch of images.
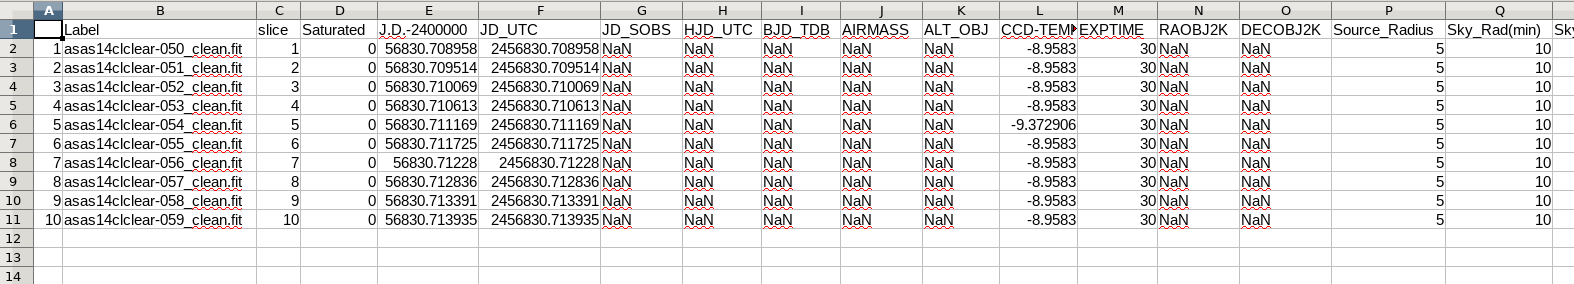
If you open the measurements file with a spreadsheet program, you should see many, many columns of numbers. The columns are separated from each other by "Tab" characters. The first few columns should look something like this:
If you scroll to the right, you will eventually find columns labelled "Source-Sky_T1" and "Source_Error_T1":
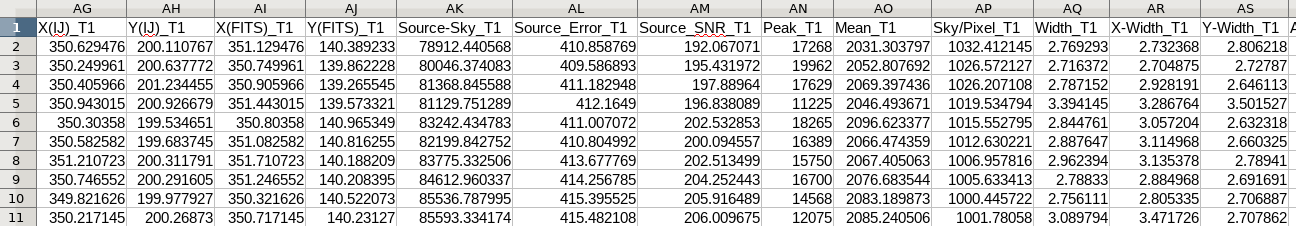
There are several more columns, even farther to the right, which will be necessary to extract.
Create a new, much smaller, spreadsheet which contains only the following columns from the original:
Save this smaller spreadsheet in a separate file for easy reference.
Your last task is to create a light curve for the target star, and the comparison stars. You can follow exactly the same methods you used back in
This section is optional, but, if completed properly, will add 10% to your score for this lab.
The data you've analyzed so far is just a small fraction of the images acquired on that night. The full dataset includes 209 images of the target and comparison stars, covering a time span of about 3 hours. If you clean and measure the stars in this entire set, you'll see that the star makes more than one complete cycle in its variation in brightness. Can you make a light curve covering this entire set, and use it to determine the period of the star?
Copyright © Michael Richmond.
This work is licensed under a Creative Commons License.