 Copyright © Michael Richmond.
This work is licensed under a Creative Commons License.
Copyright © Michael Richmond.
This work is licensed under a Creative Commons License.
In order to gain credit for this exercise, you must create a PDF document which provides the answers to all the questions. Submit the PDF to the instructor via the "Assignments" tab in myCourses.
Today, you will analyze some RIT Observatory measurements of a real eclipsing binary star. The identity of the star is a secret, which you must discover from a careful analysis of the observations. In addition, you will determine the period of this variable star, combining data taken on six different nights.
The field of this "mystery star" lies near the coordinates
(J2000) RA = 23:11:28.64 Dec = +52:59:50.3
and looks like this:
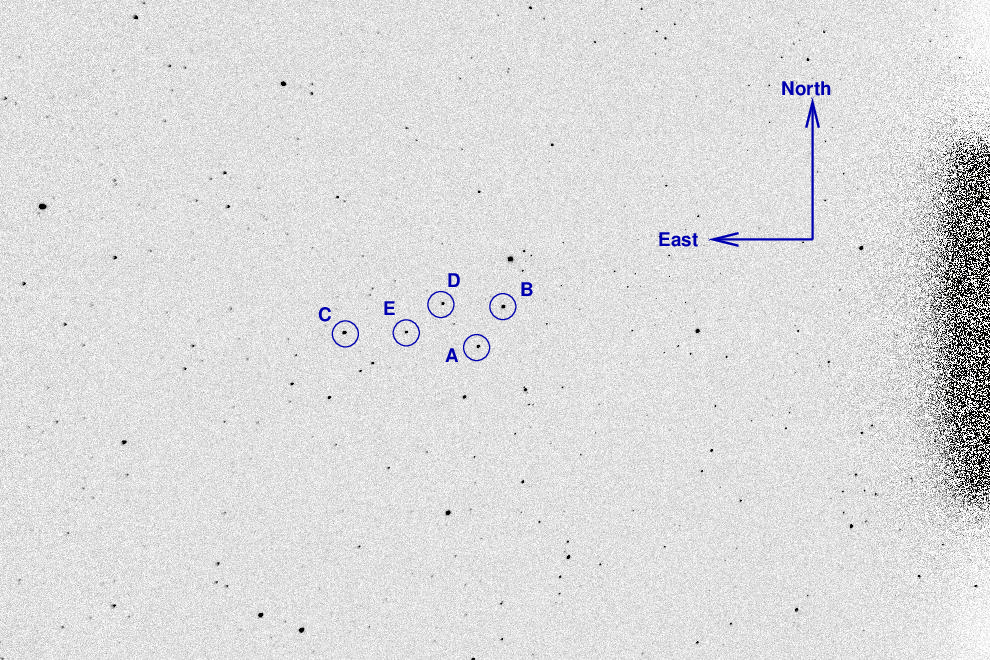
       Star              RA                Dec
    --------------------------------------------------
        A

        B

        C

        D

        E
    --------------------------------------------------
The files you will use as input for your work are plain ASCII text files with a format like this (although the header in the example below is not present in the actual data files):
# measurements of the intensity of five stars
# JulianDay         A          B          C          D          E
#
 2459092.81016    78777.1   207778.2   108043.8    49659.2    49659.2
 2459092.81035    78054.9   206633.2   107349.5    48932.8    48932.8
 2459092.81051    78198.8   205873.3   107448.4    48573.6    48573.6
There are six columns: the first records the time when the image was taken, in the form of a Julian Date.
The following columns are simply measures of the brightness of five stars A, B, C, D and E, in INTENSITY units. In other words, something like "how many photons from this star struck the camera during the exposure?" If star A is twice as bright as star B, then its intensity value in this datafile will be twice as large. Simple.
Here are links to the measurements from each night ...
Just in case it might help, I'll also provide a single data file with ALL the measurements from ALL the nights. Be cautious -- this one contains over 2900 lines.
A good way to start is to identify the variable star. Here's one hint: this system has stars of two rather different temperatures. That means that the light curve contains one deep dip in brightness (when the hot star is covered) and one shallower dip in brightness (when the cool star is covered).
Here's a second hint: plot the intensities of each star versus time, using data only from the nights of Nov 06, 2020, and Nov 07, 2020.
We can use the measurements on these two adjacent nights to make a ROUGH guess at the period of the star. Look at your graph to estimate the times of the deeper (primary) minimum, and shallower (secondary) minimum.
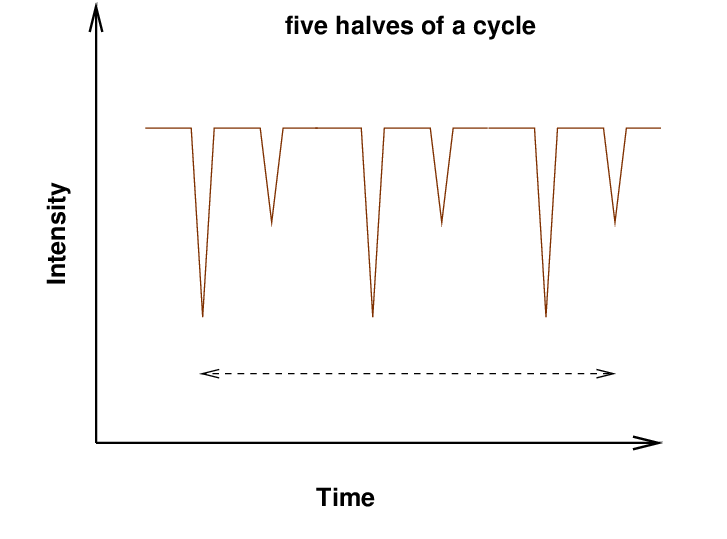
There are three reasonable possibilities for the two dips observed on these two nights.
They might have covered exactly one half of a cycle.
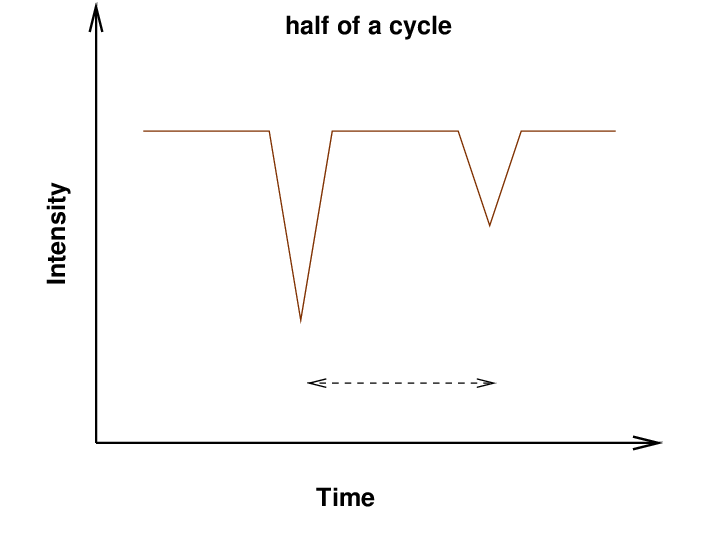
Or perhaps we saw the secondary of one cycle, and the primary of a following cycle.
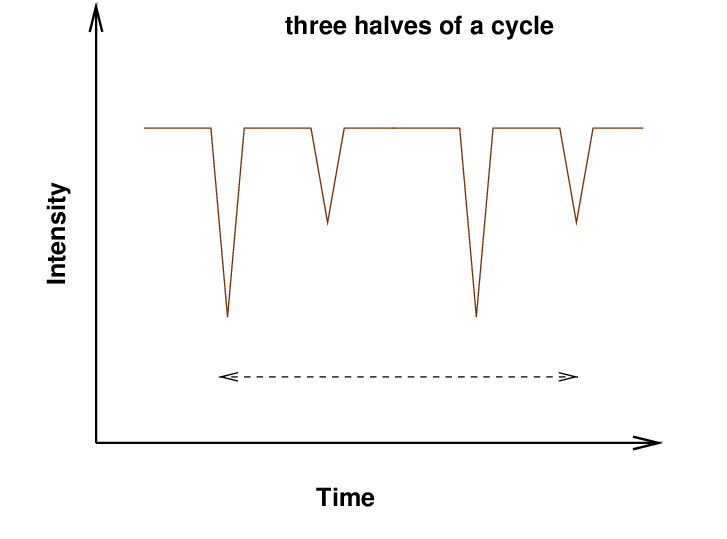
Or maybe there were two complete cycles in between our observed dips.
We can't be sure which of these possibilities is correct, so let's cover all the bases.
       if the time between observed        then the period should be
           dips was ....                       roughly ....
      -------------------------------------------------------------------

         one  half    of a period

         three halves of a period

         five  halves of a period

      -------------------------------------------------------------------
We'll come back to this question of the period of the binary star a bit later.
When astronomers want to compare their results, they convert optical measurements to magnitudes. There are many steps involved in this procedure, but we'll look at a simplified version for this exercise. You will convert each measurement of intensity into a relative magnitude using the following equation:
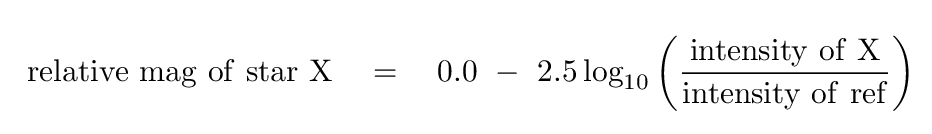
Use this equation to convert all the measurements of intensity into relative magnitudes. Adopt the star "A" as the reference. We'll use the magnitude values in all the following analysis.
                           For Nov 06, 2020

				 Star            mean mag      stdev of mag
		  -----------------------------------------------------------
				  A

				  B

				  C

				  D

				  E
		  -----------------------------------------------------------
Our images were taken through an R-band (red) filter, so we need to look up appropriate magnitude values for the reference and comparison stars in a catalog. Let's choose the APASS9 catalog, and use the values in its field labelled r'mag.
        from Nov 06, 2020         from APASS9 catalog
 Star   mean relative mag                r'
-----------------------------------------------------------------------
  A

  B

  C

  D

  E
------------------------------------------------------------------------
Now, if our measurements were accurate, and if our equipment was similar to the equipment used to make the APASS9 catalog, then our mean magnitudes from Nov 06, 2020, and the catalog r'mag magnitudes, ought to show a strong relationship: there ought to be a nearly constant offset between our magnitudes, and the catalog magnitudes (well, except for the variable star, of course).
Before we make light curves, let's calibrate our measurements. You've estimated the offset between the relative magnitudes (based on our measurements) and the r'-band catalog magnitudes, using the reference star. We can now use this offset to perform a calibration.
In this step, use the datafile with ALL measurements from ALL the nights.
Use the same method as before to compute a relative magnitude for all the stars in this datafile.
Then, add the offset you determined in step "J" above to all these relative magnitudes. The result should be that the magnitudes are now similar to those in the catalog.
        #                             calibrated r' magnitudes
        #
        # JulianDay         A          B          C          D          E
        #
        #-------------------------------------------------------------------

         2459092.81016
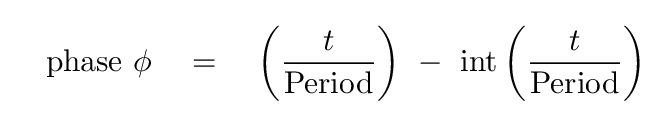
It's time to put all the information together. Concentrate only on the variable star. Use the columns in the big datafile for the Julian Date, and the calibrated r'-band magnitude of the variable star, for the final portion of the analysis.
Use one of your guesses at the period of the star from earlier, plus these two columns of information, to create a new column of data with the phase of each measurement.
Hmmm. That first attempt might not be so pretty. If measurements from different nights don't line up just right, it suggests that your guess at the period might not be correct.
In order to find the true period, pick the best of your guesses and play around with it. Try values which are slightly larger, and slightly smaller. Look at the appearance of the phased light curve to guide you.
You've done your best to find the period. Let's see how your work compares to that of a tool made by NASA.
Warning, warning! Danger Will Robinson! You are about to use a piece of software that you did not write, the source code to which you can not read. This is a Black Box. Beware -- you cannot trust the results on their own
The NASA Exoplanet Archive website is a great place to find information about the planets circling other stars. In addition to a veritable encyclopedia of the planets we've discovered so far, the site also contains a number of tools to help astronomers as they search for new planets. We will use one of those:
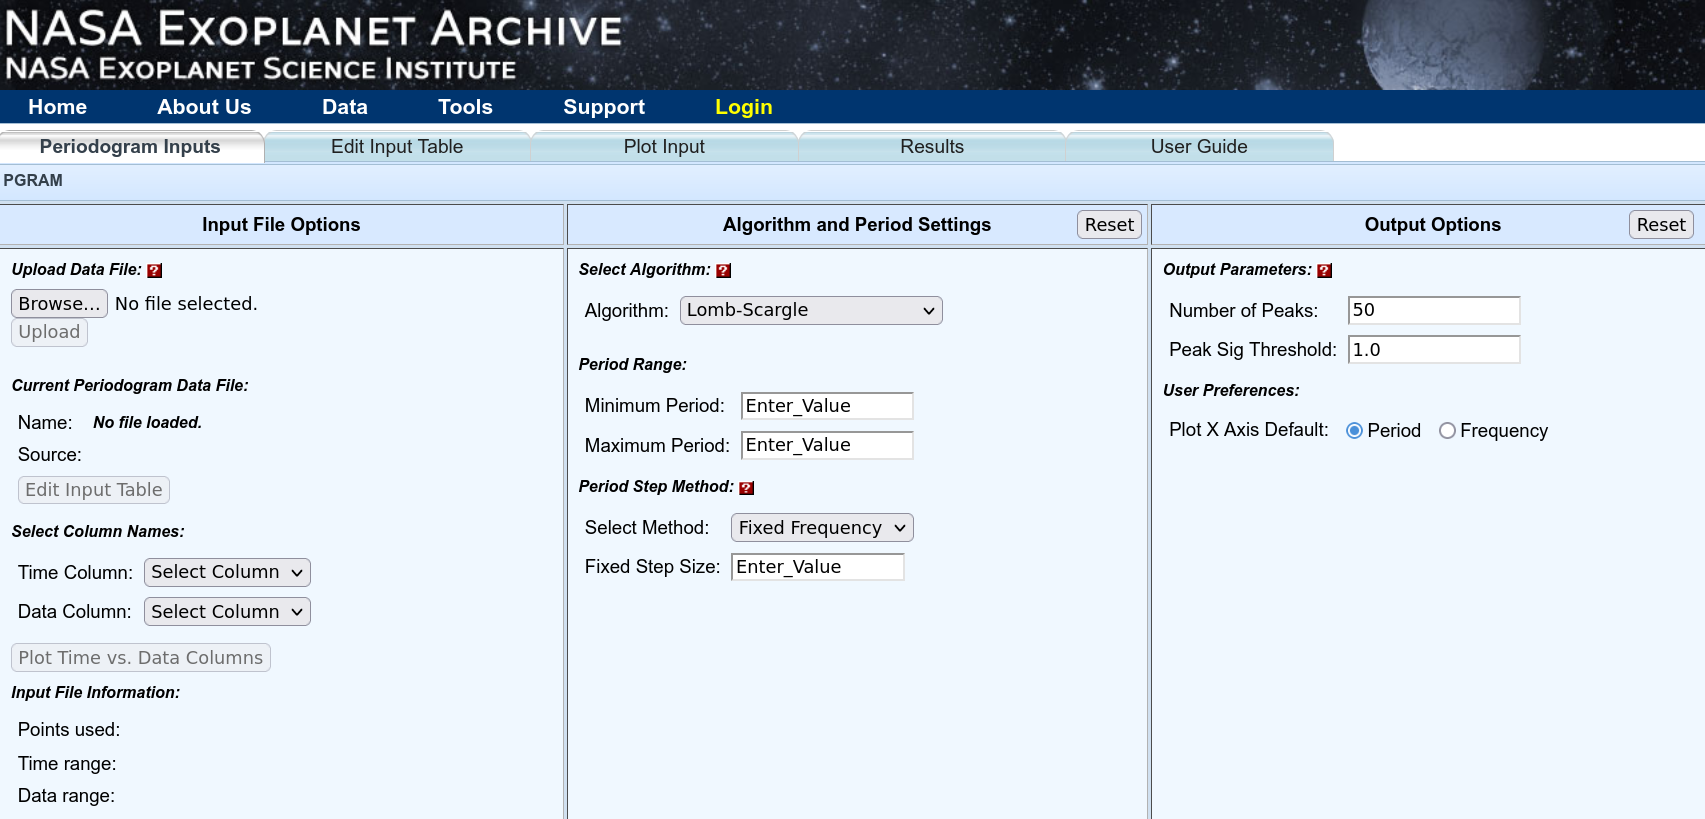
Here's what you need to do:
After a brief time, a new tab will appear in your browser with the results. In the lower-right corner of the window will be a table of peaks; the top entry is the "best" period, the next the "second best", and so forth. You can look at the light curve when each entry is adopted as the period by clicking on the View item next to each candidate period.
I've been keeping this star's identity a secret for a long time, but it's finally time to spill the beans. Go the Vizier interface to the
and enter your variable star's position, RA and Dec, into the "Target name or coordinates" box at the top.
Copyright © Michael Richmond.
This work is licensed under a Creative Commons License.