 Copyright © Michael Richmond.
This work is licensed under a Creative Commons License.
Copyright © Michael Richmond.
This work is licensed under a Creative Commons License.
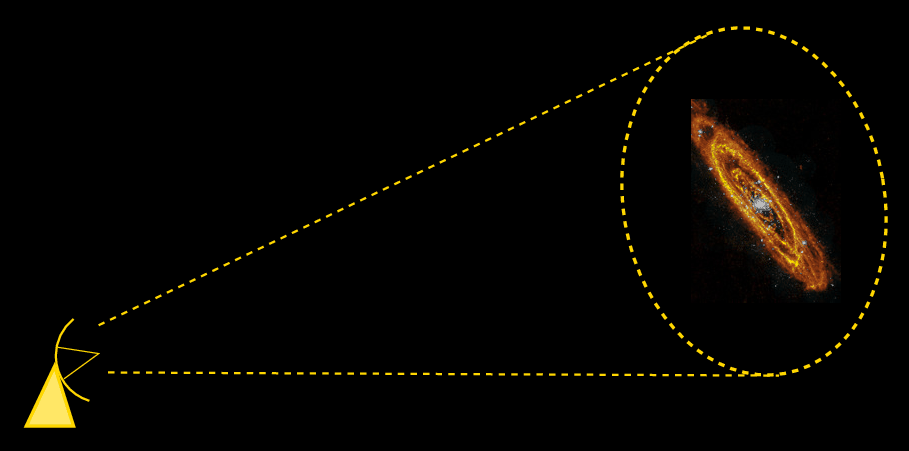
As we look farther and farther into space, we see things less and less clearly. Individual stars, for example, not only grow fainter, but also become crowded together -- their light is combined with that of all their neighbors. At some point, we can't make out individual stars, or even individual collections of stars.
Eventually, we must give up on the details, and try to find some way to use the bulk properties of entire galaxies to estimate their distances. Our next two lectures are devoted to two such methods: one appropriate for spiral galaxies (today), and another for ellipticals (next lecture).
The key point of the Tully-Fisher relationship is that the speed of rotation of material in a spiral galaxy is related to the luminosity of that galaxy: high speeds occur in galaxies of high luminosity.
To establish this fact, Tully and Fisher, A&A 54, 661 (1977) (hereafter TF77 ) carefully selected galaxies for which rotation velocities could be measured accurately. They used radio telescopes tuned to the 21-cm line of neutral hydrogen, which is plentiful in the disks of many spirals. Gas is a very convenient tracer of dynamics because -- in ordinary spirals, at least -- it orbits the center of the galaxy in circular paths.
If one points a single-dish radio telescope at a typical galaxy -- as TF77 did -- the beam of the telescope is so large that it captures radio waves from the entire galaxy in a single pointing.
The radio image produced by an observation like this is bland: just a single unresolved blob of emission. However, one can easily measure the intensity of the radio waves at different frequencies, which corresponds to the amount of emission at different velocities within the galaxy. Here are eight examples from TF77, showing the measured radio intensity as a function of velocity.
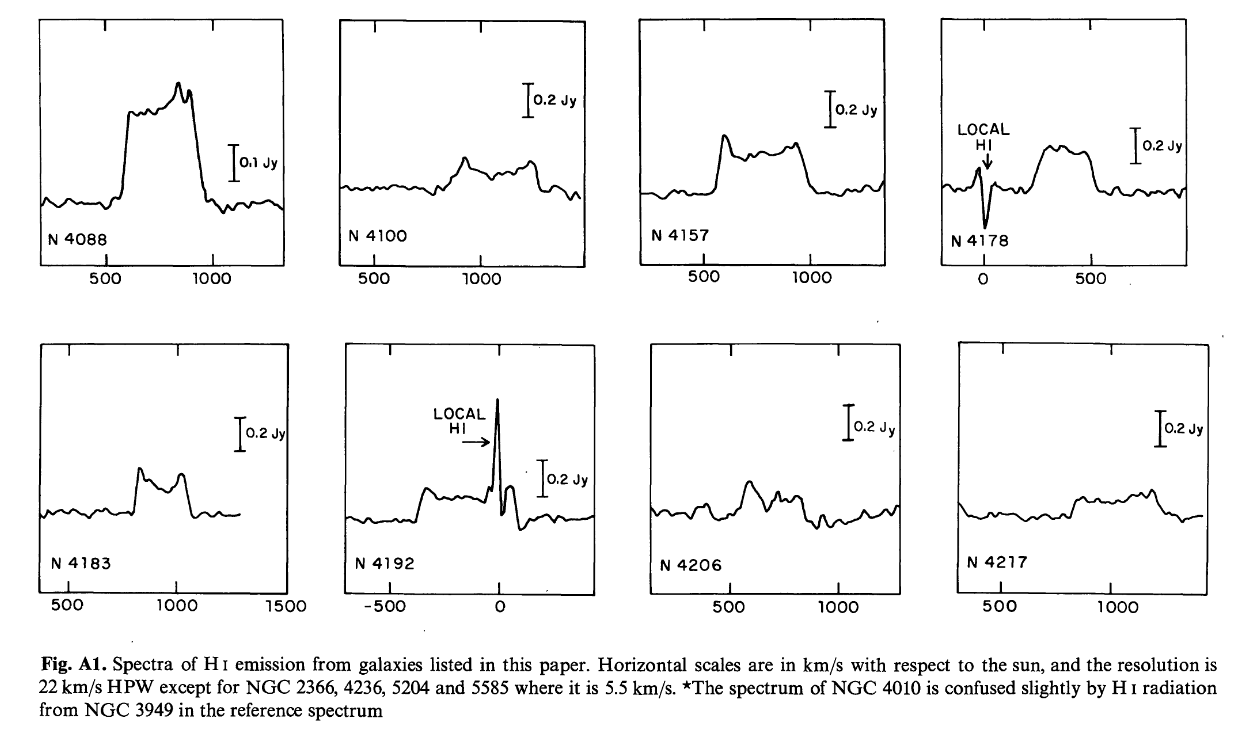
Figure A1 taken from
TF77
The measured width of the HI line needs to be corrected for the inclination of the galaxy: the more edge-on the galaxy, the smaller the correction. TF77 selected only galaxies with an inclination angle of at least 45 degrees, in order to minimize errors caused by this inclination correction. Notice the light tension here:
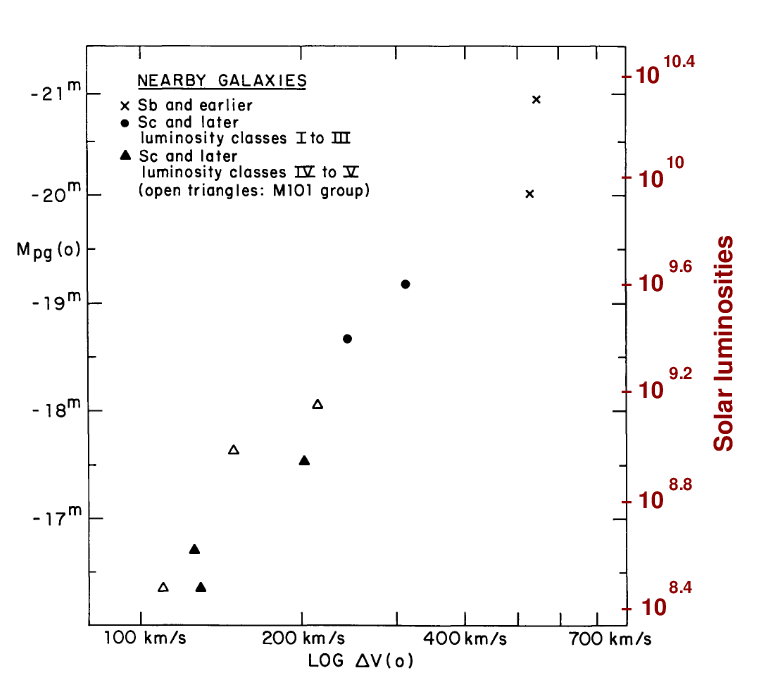
To calibrate their relationship, TF77 chose a set of galaxies which were close enough that astronomers had decent measurements of their distances; and, therefore, their luminosities (or absolute magnitudes). Unfortunately, this set didn't have very many high-luminosity systems. But the trend is clear: galaxies with large HI line widths tend to have higher luminosities (and so more negative absolute magnitudes).
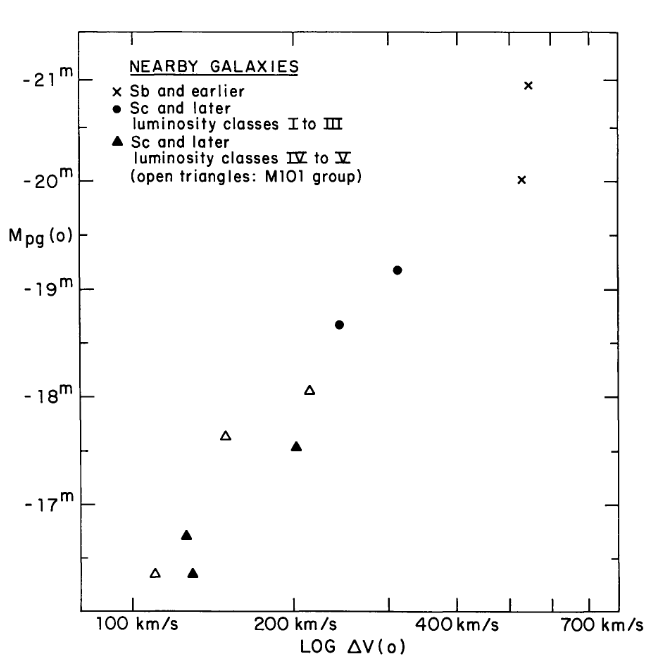
Fig 1 taken from
TF77
Now, before we go on to take advantage of this correlation, we ought to ask "Does it make sense?" Is there any underlying physical reason why large HI line widths should appear in very luminous galaxies?
One can look at this question in a simple way, but also in a more sophisticated manner. Let's start with the simple one.
Consider two galaxies, A and B, of the same shape and composition, but one of which (A) contains ten times as many stars as the other (B). Clearly, galaxy A will emit ten times as much light, and have a more negative absolute magnitude.
It seems obvious that the larger mass of galaxy A will create a stronger gravitational force on its stars. This, in turn, will cause the stars themselves, and any clouds of gas within galaxy A, to move faster, leading to larger Doppler shifts. As a result, we ought to see a broader HI emission line in galaxy A than galaxy B. QED.
(This chain of reasoning skips over the exact spatial distribution of the stars in galaxy A, compared to galaxy B. Are the more numerous stars in A packed into the same volume as galaxy B? Or are the stars in A spread out over a much larger region, which might decrease their mutual gravitational forces? Good question -- and this argument just ignores the possible consequences ...)
The following is a very much oversimplified model, but it should give you the flavor of the method by which one can properly try to derive this relationship.
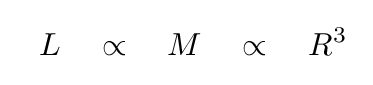
Pretend that a galaxy is a uniform mixture of gas and stars, with overall density ρ, distributed in a sphere of radius R. Real spiral galaxies are not like this at all, of course, but just play along to see how the argument goes. The mass of this sphere is simply
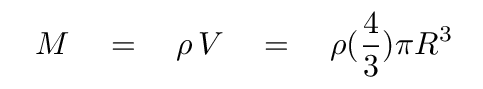
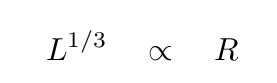
Now, the optical luminosity of the galaxy depends on the number of stars in it. Clearly, in this uniform mixture of stars and gas, the number of stars is exactly proportional to the overall mass; and since the mass is proportional to R cubed, the luminosity must be also.
Now let's turn to the velocity of stars in this galaxy. Pretend that the galaxy is rotating around some axis, so that stars and gas move in perfectly circular orbits. What is the centripetal acceleration of a star at the equator of the galaxy, a distance R from the center? All the mass of this spherical galaxy acts as if it were concentrated at the center, so we can compute the gravitational acceleration very easily, and set it equal to the centripetal term.
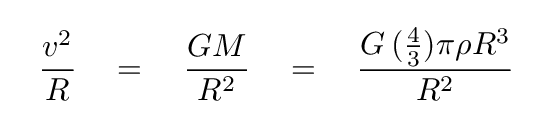
A bit of algebra shows
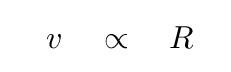
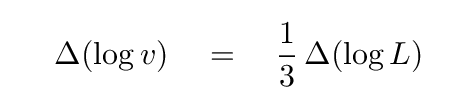
Okay! Since we have expressions for both velocity and luminosity in terms of R, we can set them equal to each other, yielding a power-law relationship between the two observable quantities.
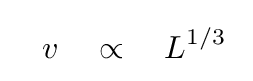
If one were to make a log-log plot of a set of measurements, the slope on that plot would be given by
Interesting. Do we see this sort of relationship in the actual measurements?
Okay, enough theory -- let's get back to practice. We've seen that for a sample of NEARBY galaxies, there's a nice relationship between velocity and luminosity. How can we use this correlation to measure distances?
In their paper, Tully and Fisher provide measurements of galaxies in two nearby clusters, Virgo and Ursa Major. They didn't know the distance to those galaxies, but they could -- with some effort, as they describe in the paper -- find samples of objects which ought to be at the same distance, so that the apparent magnitudes would differ from the absolute magnitudes by a fixed offset.
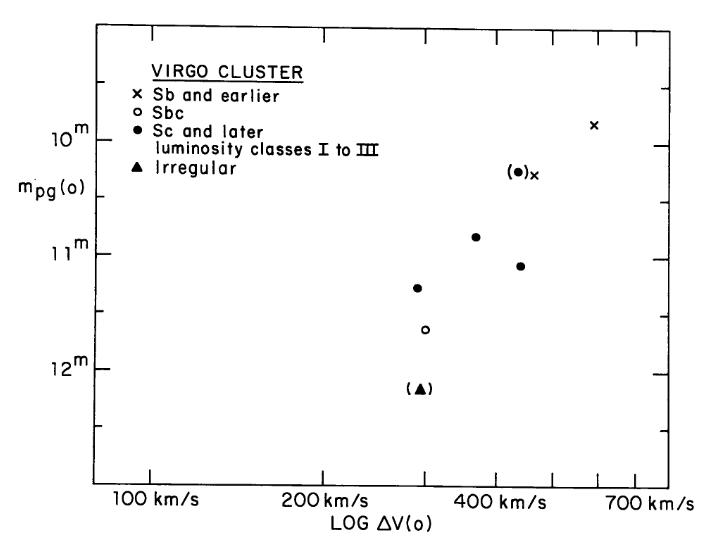
Fig 3 taken from
TF77
Now, the first question was -- is there a similar connection between rotational velocity and magnitude for both groups of galaxies? Take a look for yourself in the figures above. TF77 concluded there was.
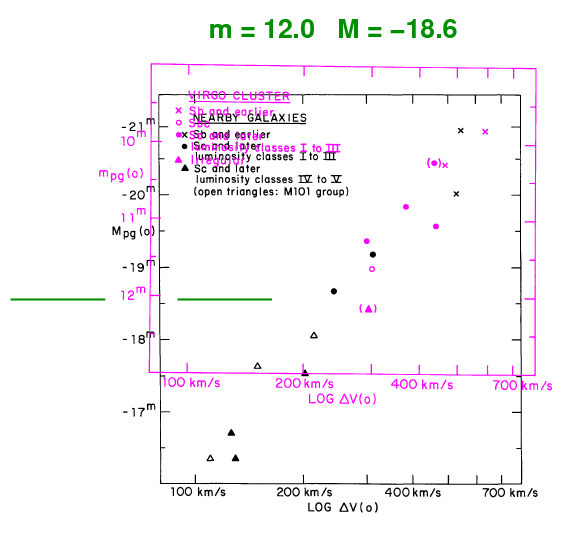
The second question was -- how can we USE this relationship? Well, if the connection is the same for all spiral galaxies, everywhere, then we should be able to determine the distance modulus (m - M) by simply sliding the data for the Virgo cluster galaxies until they line up with the results for galaxies with known absolute magnitudes.
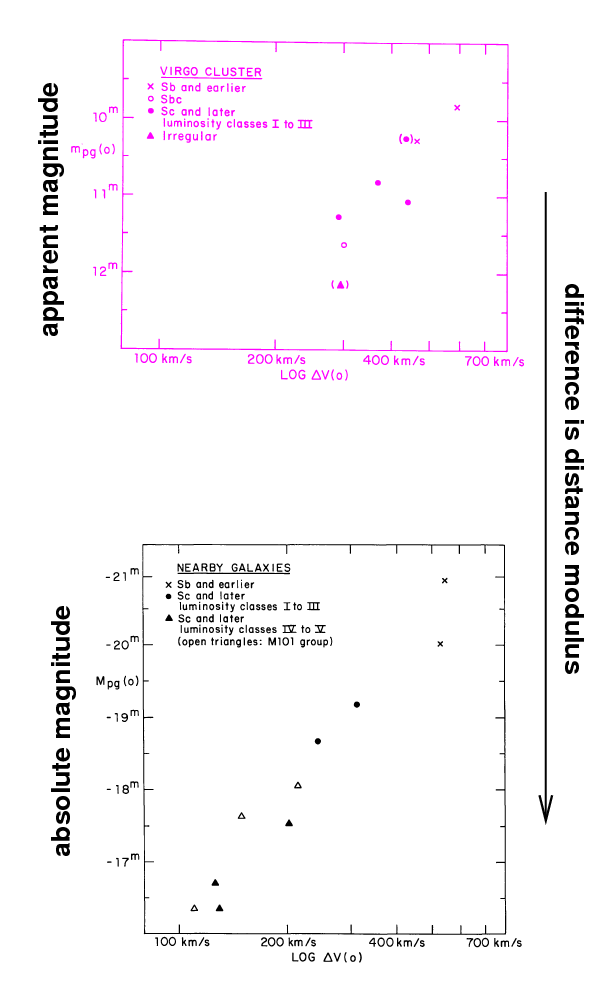
  Q:  How much must one shift the Virgo Cluster galaxies
        in magnitude to make the match the nearby galaxies?


  Q:  What is the distance to the Virgo Cluster by this method?
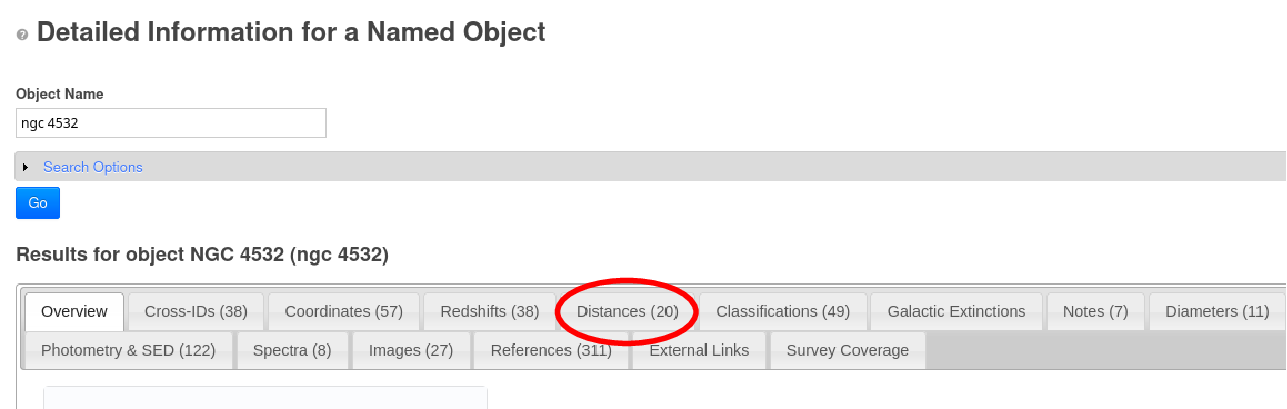
You can check your results by looking in NED - the NASA Extragalactic Database for the entries of some of these galaxies. Pick a galaxy, type its name into the "Object Name" box, and click "Go".
Then choose the "Distances" tab, and look at the values which other astronomers have estimated for your galaxy.
If you wish, you can read a brief discussion of the term "luminosity class" when applied to a galaxy.
A good summary of recent work on the Tully-Fisher relationship can be found in Sakai et al. ApJ 529, 698 (2000) . The authors test the connection between HI velocity and luminosity in several different passbands, rather than the single bluish photographic passband of the earlier work. They find that the relationship grows tighter if one measures luminosity in the near-IR:
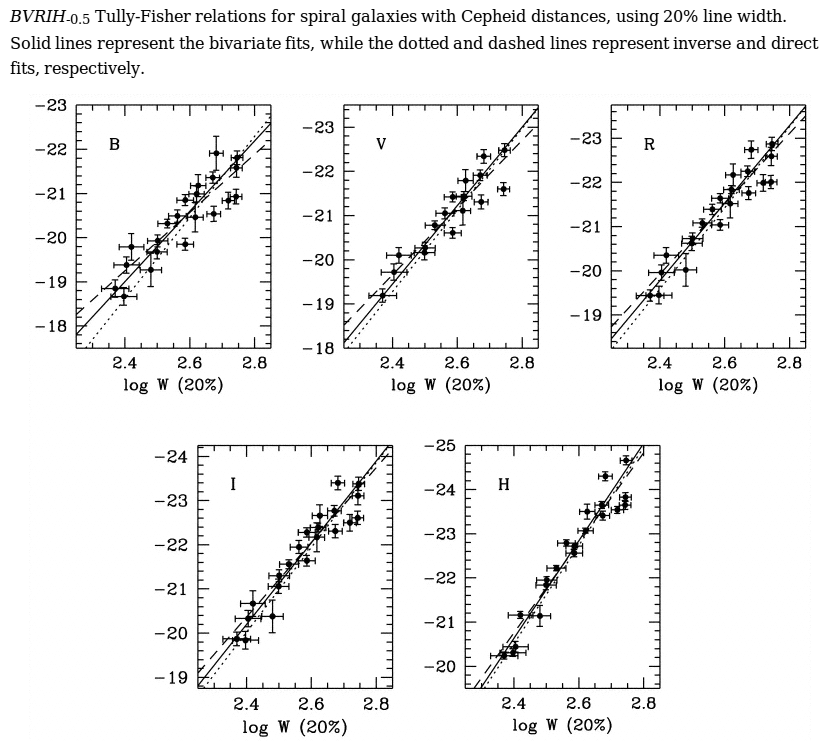
Figure 1 taken from
Sakai et al., ApJ 529, 698 (2000)
Note that TF77 found that the distance modulus to the Virgo cluster was (m - M) = 30.6 mag, or 13.2 +/- 1 Mpc; that agreed with the "short" value of the time, as opposed to the "long" value of (m - M) = 31.45 mag proposed by Sandage and Tamman. More recent work, such as Mei et al. ApJ 655, 144 (2007), finds a value somewhere in between, but closer to the "short" scale: (m - M) = 31.1 mag, or 16.5 Mpc. TF77 found the distance modulus to the Ursa Major cluster was (m - M) = 30.5 +/- 0.35 mag, or 12.6 +/- 2 Mpc. This is again a bit smaller than more recent values of (m - M) = 31.3 mag (Tully and Pierce ApJ 533, 744, 2000) or (m - M) = 31.6 mag (Watanabe et al. ApJ 555, 215, 2001).
How far away can one apply the Tully-Fisher method? Since all one needs to observe are the apparent magnitude of the entire galaxy (very easy), and the rotational velocity of objects in it (a bit harder), astronomers have tested it as far out as redshift z=1.4 (or many thousands of Mpc)! There are some complications at great distances, though:

That last point could be a real killer. Imagine a galaxy in the early universe, at an age of perhaps 2 Gyr, with some mass M and rotational velocity v and luminosity L. If we look at that same galaxy in the current universe, at age 13 Gyr, it will have basically (unless there is some major merger) the same mass and same rotational velocity, but (probably) a very different luminosity L -- simply because some stars have disappeared, while others have formed.
So it's not surprising that one compares the properties of low-redshift and high-redshift samples, one can find some differences. As the figure below shows clearly, galaxies with the same rotational velocity at high redshift (filled black symbols) are considerably bluer than galaxies with the same rotational velocity at low redshift (open symbols).
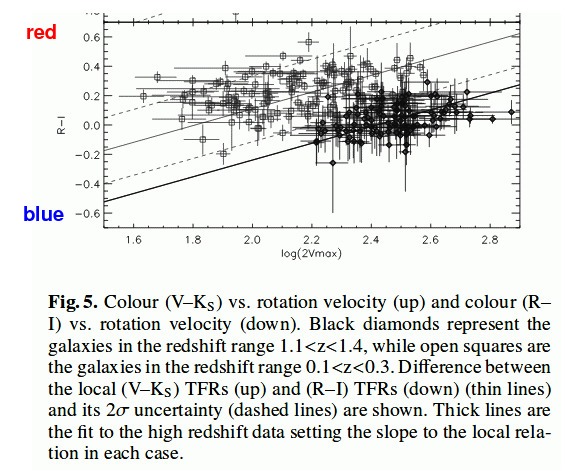
Taken from Figure 5 of
Fernandez-Lorenzo et al., A&A 521, 27 (2010)
It's probably safest to apply the Tully-Fisher method only to galaxies in which the effects of evolution aren't too large; perhaps out to redshifts of z = 0.1 - 0.2, which corresponds to around 500 or 700 Mpc. That's still a very large region!
Copyright © Michael Richmond.
This work is licensed under a Creative Commons License.