 Copyright © Michael Richmond.
This work is licensed under a Creative Commons License.
Copyright © Michael Richmond.
This work is licensed under a Creative Commons License.
For the past several decades, astronomers have been studying a group of stars at the very center of our Milky Way Galaxy. It's not an easy job. Ordinary optical telescopes can't see the stars there, because clouds of gas and dust in the disk, lying between us and the center, block the view.
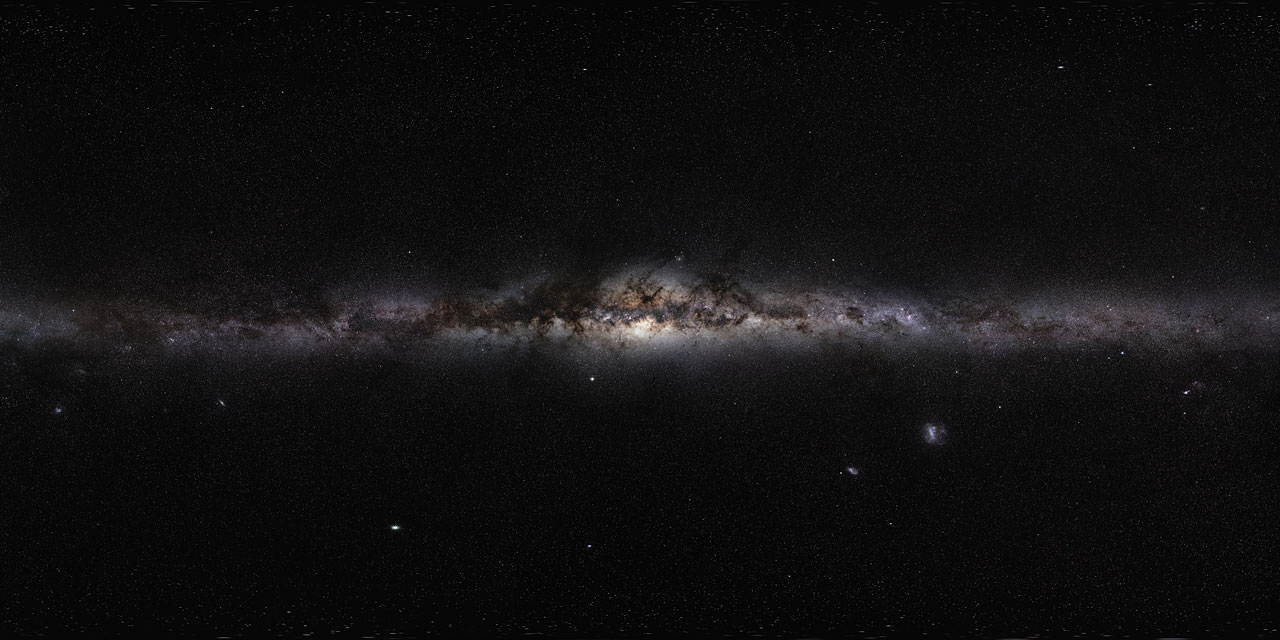
Image of Milky Way courtesy of
ESO/S. Brunier
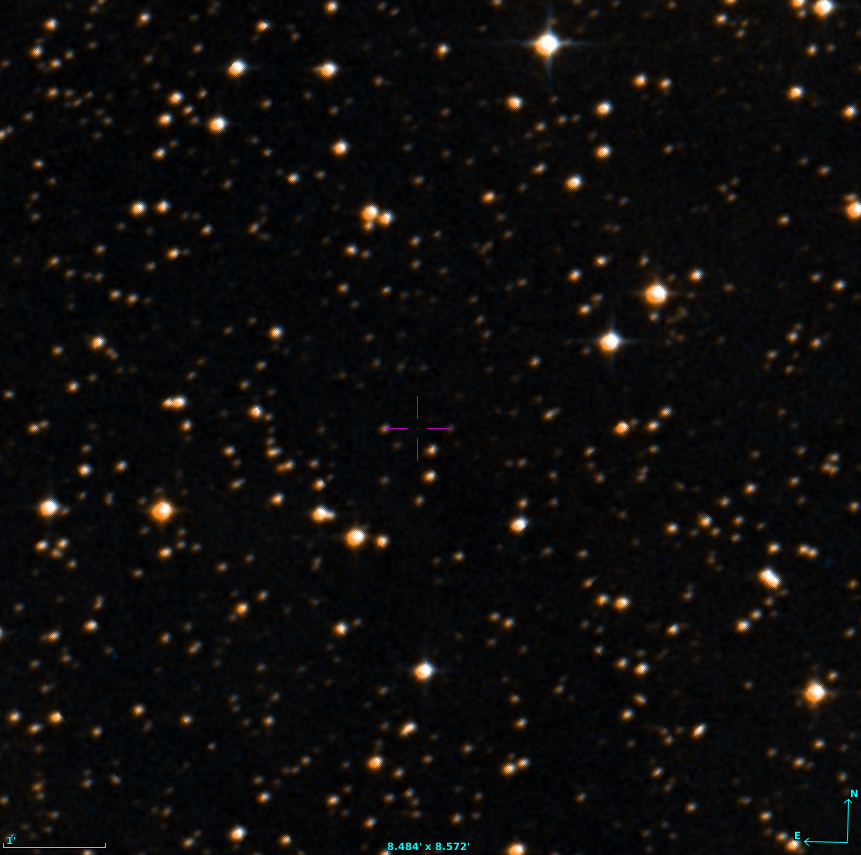
If we zoom in toward the center ...
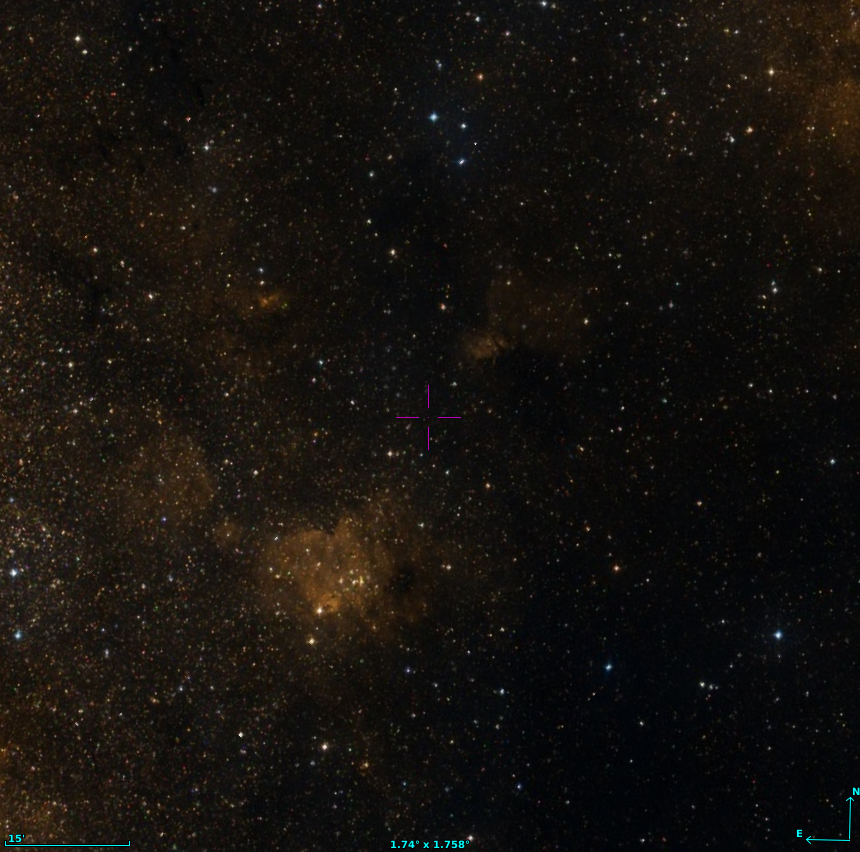
... we just see a few stars in the foreground ...

... and then a black background of dust.
But in recent years, we've been able to train infrared cameras on this region of the galaxy. Infrared light can penetrate clouds of dust, revealing the stars all the way to the heart of the Galaxy. Moreover, adaptive optics -- which work much better in the near-infrared than in the optical -- can provide very sharp images, allowing us to discern and measure individual stars accurately.

Infrared (1.43 and 2.29 micron) image courtesy of
UCLA Galactic Center Group - W.M. Keck Observatory Laser Team.
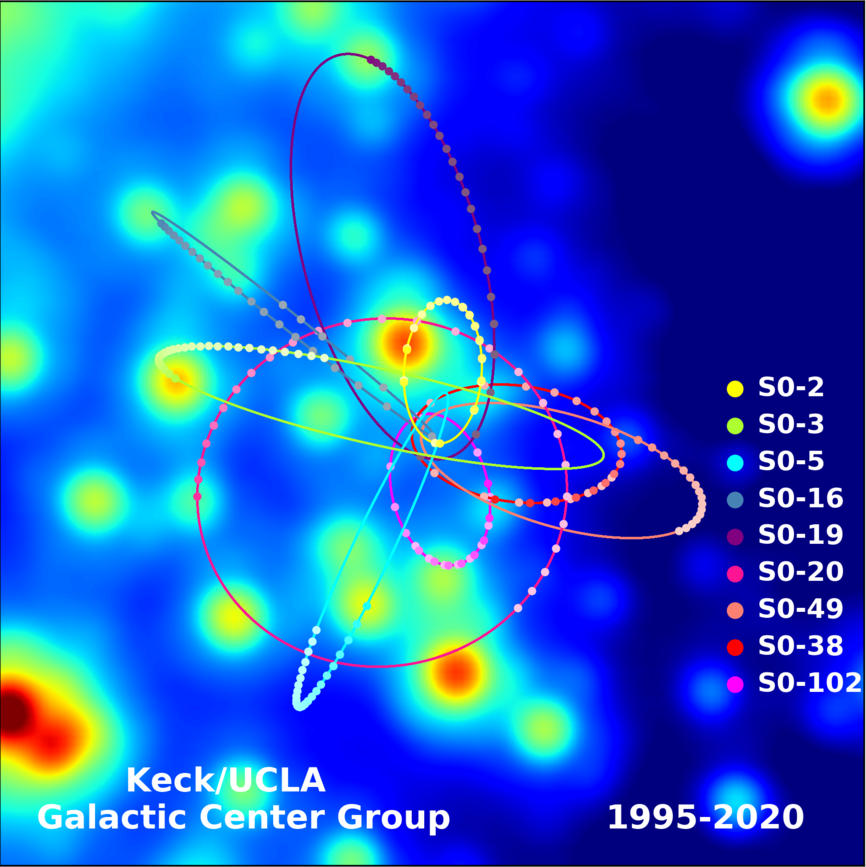
A group led by Andrea Ghez at the University of Califonia, Los Angeles, has measured the positions of stars in a small cluster at the center of the Galaxy over more than twenty years. Click on the image below to watch an animation of their motions.
If one can measure the PERIOD and SIZE of a star's orbit around some central object, then one can use Kepler's Third Law to determine the mass of the object. Let's give it a try! We can focus on the star called "SO-2".
First, look at the picture below.
  Step 1:  Use the scale bar to estimate the longest diameter
              of the yellow elliptical orbit of the star "SO-2".
              Divide this diameter by two to find the semi-major
              axis of the orbit.

              Call this angle θ.  It will have units of arcseconds.
We know that the distance to the center of the Milky Way is about 8500 parsecs. You can calculate the physical size of the orbit by combining this distance with the angular size from Step 1.
  Step 2:  Compute the physical size of the orbit by multiplying
              the angular size of the orbit by this distance.
              The result will be the semi-major axis a in Astronomical Units.


                  a   =   (8500 pc) * (θ arcseconds)


                      =   ______________   AU
We next need to know the period P of the star's orbit. Watch the animation again. It starts in the year 1995.5. Note the time when the star "SO-2" returns to its starting position.
Step 3: Compute the period of the orbit, P, in years.
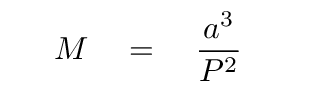
Now, way back in the seventeenth century, Johannes Kepler figured out that there is a relatively simple relationship between the period of an orbit, the physical size of that orbit, and the mass of the central object. If we choose the proper set of units, then

where
We can re-arrange Kepler's Third Law to solve for the mass of the central object:
  Step 4:   Compute the mass of the object at the center of the
               Milky Way (in solar masses).
The galaxy M84 is one of the largest ellipticals in the nearby Virgo Cluster of galaxies.

In 1997, astronomers pointed the Hubble Space Telescope at the very center of this galaxy and took the spectrum of light from a narrow slit running vertically through the nucleus. The spectrum concentrated on light emitted by hydrogen gas at a wavelength of about 6563 Angstroms. The right-hand panel in the figure below shows the results: light from the upper half of the slit was blueshifted (shifted to shorter wavelengths), and light from the lower half of the slit was redshifted (shifted to longer wavelengths).

Image courtesy of
Gary Bower, Richard Green (NOAO), the STIS Instrument Definition Team, and NASA
  Q:  Why did gas above the center of the galaxy appear blueshifted,
          why gas below the center appear redshifted?
The answer is -- because it is circling around a very massive object at the center of the galaxy: gas above the center is coming TOWARD us, and gas below the center is moving AWAY from us.

Image of accretion disk taken from NASA/Goddard Space Flight Center
Let's use the observed Doppler shifts of the light emitted by the gas to estimate the mass of the object(s) at the center of this galaxy. The authors of the paper describing these observations provide a very helpful figure: it shows the velocities of the gas as a function of distance from the center of the galaxy.

Modified from Figure 5 of
Gary Bower, Richard Green (NOAO), the STIS Instrument Definition Team, and NASA
We can see that the fastest motions of the gas
First-year physics students learn that an object moving in a circular path must be pulled on by a centripetal force, the size of which depends on the object's speed and the circle's radius. In our case, that force is the gravitational pull of a central mass.
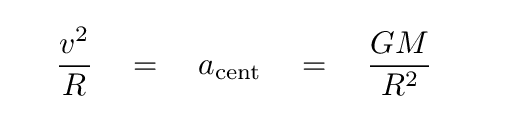
So, re-arranging the variables, if we know the speed of the gas, and the radius of its orbit, we can solve for the mass of the central object. (You may wish to recall that the Universal Constant of Gravitation has a value of G = 6.67 x 10⁻¹¹ N*m2/kg2).

Q: What is the mass of the object at the center of M84?
Clearly, there is a lot of MASS at the center of M84. When the astronomers used the HST images to measure the amount of LIGHT at its center, however, they found comparitively little.
Lots of mass, not very much light ... sounds like a supermassive black hole to me.
In a few cases, we can observe X-rays coming from the gas which is at the very inner edge of the accretion disk. The gas there is so hot -- temperatures of many millions of degrees -- that almost all the atoms are completely ionized. Iron is the last of the common elements to become completely ionized; when it has just one electron left (out of its original 26), it can still produce emission lines. So, in a few cases, we can study the emission lines of these very hot, very fast-moving iron atoms. It's a complicated subject, due to several factors:
Consider an accretion disk which is exactly edge-on to our view, and full of gas moving both toward us (on one side) and away from us (on the other side). We would expect the light to be Doppler shifted in opposite directions on the two sides of the center, and so we would expect a spectrum to show a double-peaked profile:

Image modified from Fig 1 of
Guainazzi, ApSS 320, 129 (2009)
However, if the gas is moving a relativistic speeds -- which would only be possible close to a supermassive black hole -- then the light emitted by gas coming toward us is boosted to higher intensity, and the light emitted by gas receding from us is diminished.
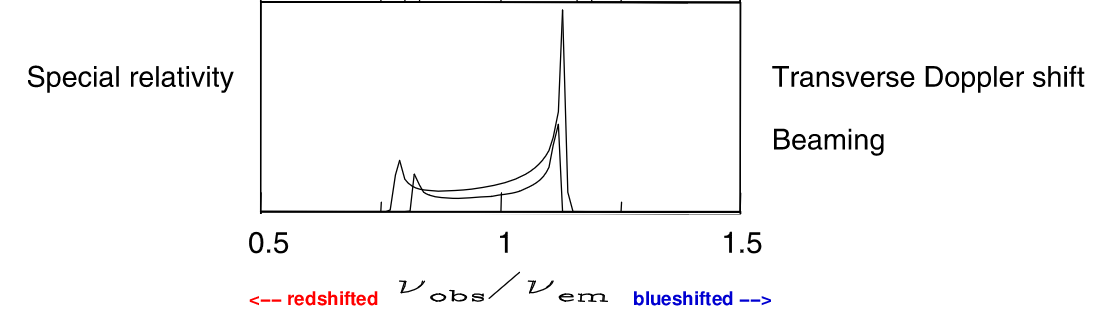
Image modified from Fig 1 of
Guainazzi, ApSS 320, 129 (2009)
On top of THAT, if the gas really is circling a supermassive black hole, all the light emitted in its vicinity will be redshifted as it crawls up and out of the gravtitational potential well.

Image modified from Fig 1 of
Guainazzi, ApSS 320, 129 (2009)
That's what we would expect to see if we observed the spectrum of the inner portions of an accretion disk with an ideal X-ray telescope. Unfortunately, our actual X-ray telescopes are unable to show such fine details, due to diffraction and the small number of photons they can collect from these distant sources. As a result, the spectrum we actually measure ought to be somewhat smeared out.

Image modified from Fig 1 of
Guainazzi, ApSS 320, 129 (2009)
So -- that's a lot of THEORY, describing what we ought to see if we examine the accretion disk around a supermassive black hole with an X-ray telescope. But -- what about in PRACTICE? Do we actually observe such shifted and asymmetric emission lines of iron when we look at real active galaxies?

Image modified from Fig 2 of
Guainazzi, ApSS 320, 129 (2009)
A few days ago, I mentioned one of the reasons that early radio surveys were unable to pin down the locations of celestial radio sources precisely: diffraction. The smallest feature that a telescope can resolve is given by

where
For ground-based optical telescopes, this value is usually somewhere around 1.0 arcsecond (and is often set by turbulence in the Earth's atmosphere). The very early radio telescopes had diffraction limits which were much larger -- thousands of arcseconds.
However, in the decades since, radio astronomers have figured out how to combine the signals from several radio dishes in order to produce images with high angular resolutions. The technique of interferometry allows astronomers to create a synthetic telescope with a diameter D equal to the largest separation between the dishes.
A recent collaboration called The Event Horizon Telescope (EHT) organized an observing campaign in 2017 which involved telescopes spread all over the world.

Image 1 taken from
First M87 Event Horizon Telescope Results. II. Array and Instrumentation
ApJ, 875, L2 (2019)
To a very rough approximation, the largest separation of this multi-continent instrument was the diameter of the Earth.
   Assume that the maximum separation of the EHT really was the
       diameter of the Earth:  D = 1.2 x 10⁷ meters.

   The typical wavelength observed was λ = 1.3 mm = 0.0013 meters.


   Q:  What was the diffraction limit of EHT?
The goal was to point this fastastically powerful telescope at the nucleus of the galaxy M87 -- you remember, the big elliptical with the jet:
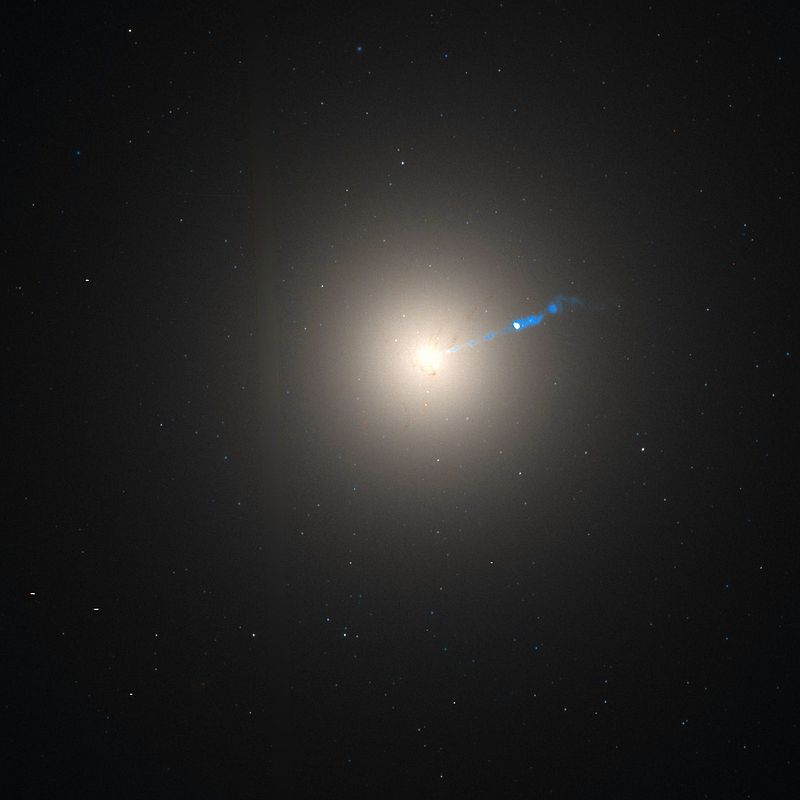
Image courtesy of
NASA and Wikimedia
We know the distance to this galaxy is about 17 Mpc. At that distance, a black hole with a mass of a few billion solar masses would have an angular size of roughly 10-10 radians, or 10 microarcseconds. That means that, in theory, it might be possible to resolve gas in the innermost accretion disk with the EHT.
What did the scientists see when they finished all the (many) calculations necessary to combine the information from all the different dishes?

Figure 1 taken from
EHT Collaboration, ApJ 875, 5 (2019)
Ta-da! Pretty much just as expected.

Image and video courtesy of
ehtelescope
Copyright © Michael Richmond.
This work is licensed under a Creative Commons License.
