 Copyright © Michael Richmond.
This work is licensed under a Creative Commons License.
Copyright © Michael Richmond.
This work is licensed under a Creative Commons License.
Disclaimer -- I'm not a radio astronomer, so it's possible that the next few lectures may contain some mistakes. Please do read some of the references by real experts listed in the 'For more information' section at the end of this document.
Do you remember the two-slit experiment from your early physics classes? A source of light shines through two narrow slits onto a distant screen. The resulting pattern of light on the screen depends on the exact distance that light rays have travelled from each of the two slits when they meet on the screen.
If the two rays have travelled a distance which differs
If the two holes are vertical slits, they create a pattern which looks something like this:
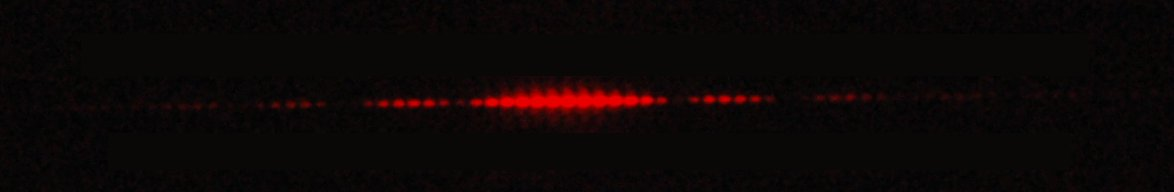
If the two holes are perfect point sources, the pattern they create looks more like this:
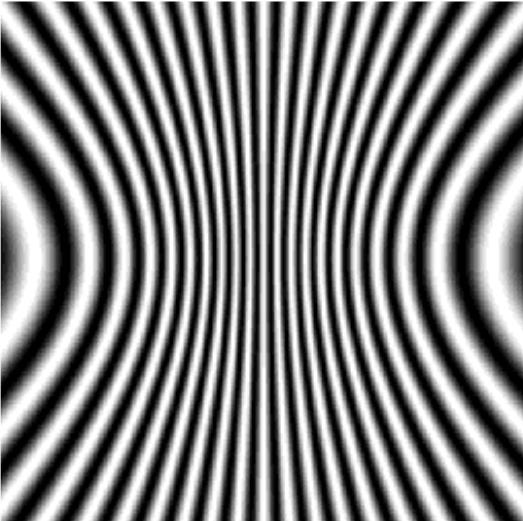
Image courtesy of
Frederic Boone
The job of an interferometer is to sample the interfering waves at several locations, and then to use the measured pattern to re-construct the number and locations and brightness of the sources.
Note that this will only work for waves, because it requires the presence of interference. The wave nature of the experiment is crucial.
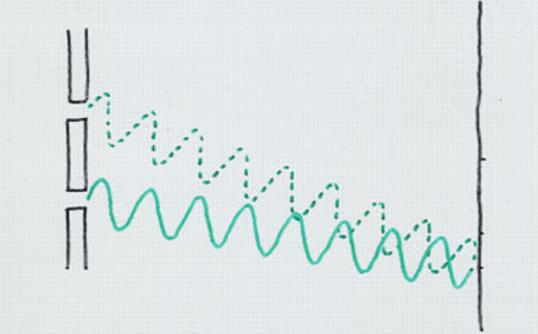
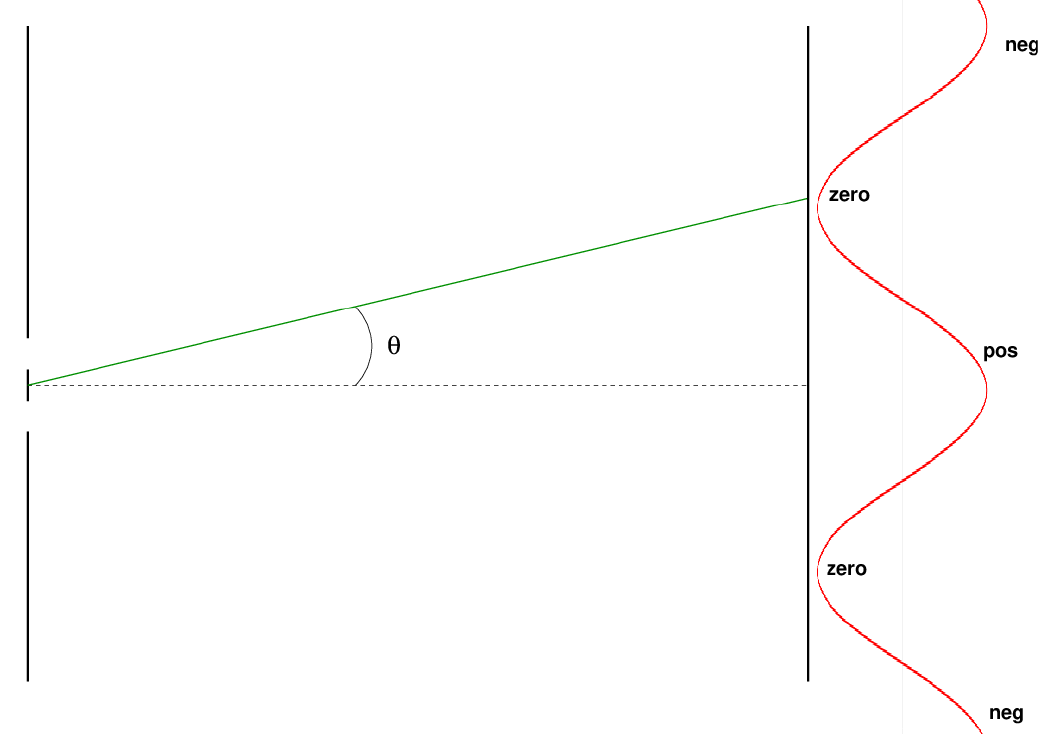
You've probably seen diagrams like this many times when discussing the two-slit experiment, right? The wavy line next to the screen illustrates the result of the waves from the two slits interfering: a bright spot at the center of the screen, then a dark spot a small distance to the side, then a bright spot again at a larger distance. And it's correct: if you measure the amplitude of the combined light waves at these locations, there is a maximum at the center, a minimum (zero) a small distance to one side, and then a maximum again a bit farther to the side.
But if you were to measure the phase of the wave at these locations, you'd find that the central bright spot has a positive phase, while the first bright spot to the side has a negative phase. The dark spots correspond to zeroes of the wave.
The ability to measure the PHASE, as well as the amplitude, of the combined waves, is what gives interferometry its true power. And so, in order to make full use of this technique, we need to employ detectors which can record not only amplitude, but also phase.
  Q:  Can a radio antenna measure the phase of a passing
          electromagnetic wave?
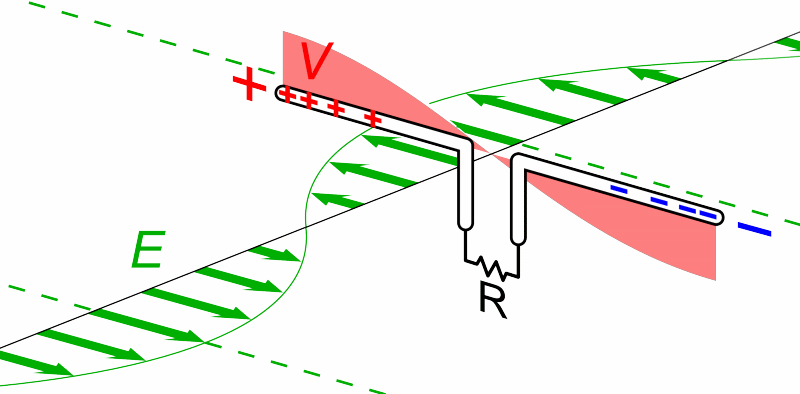
Animation courtesy of
Wikipedia
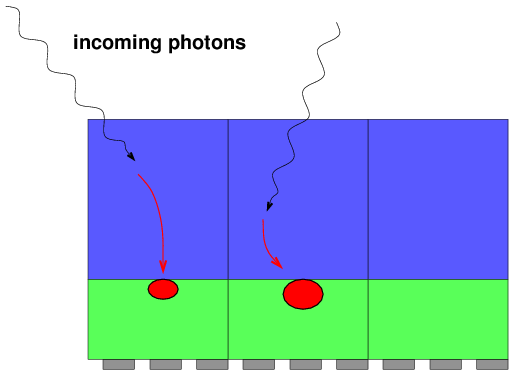
Q: Can a CCD measure the phase of a passing electromagnetic wave?
And that's one of the main reasons why optical astronomers don't use interferometry very often. There are a few other reasons, of course.
Combining information from several telescopes is way more complicated than using a single telescope ... so why do it? Optical and X-ray astronomers do just fine without any fancy multi-dish techniques, so what's the big attraction in the radio?
Maybe the biggest reason scientists have spent so much time and energy developing interferometry in the radio is simply
because single-dish radio telescopes make blurry images
Remember that the diffraction limit for a single telescope is roughly
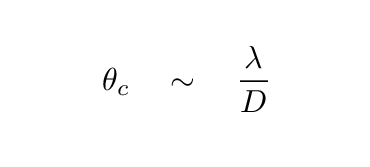
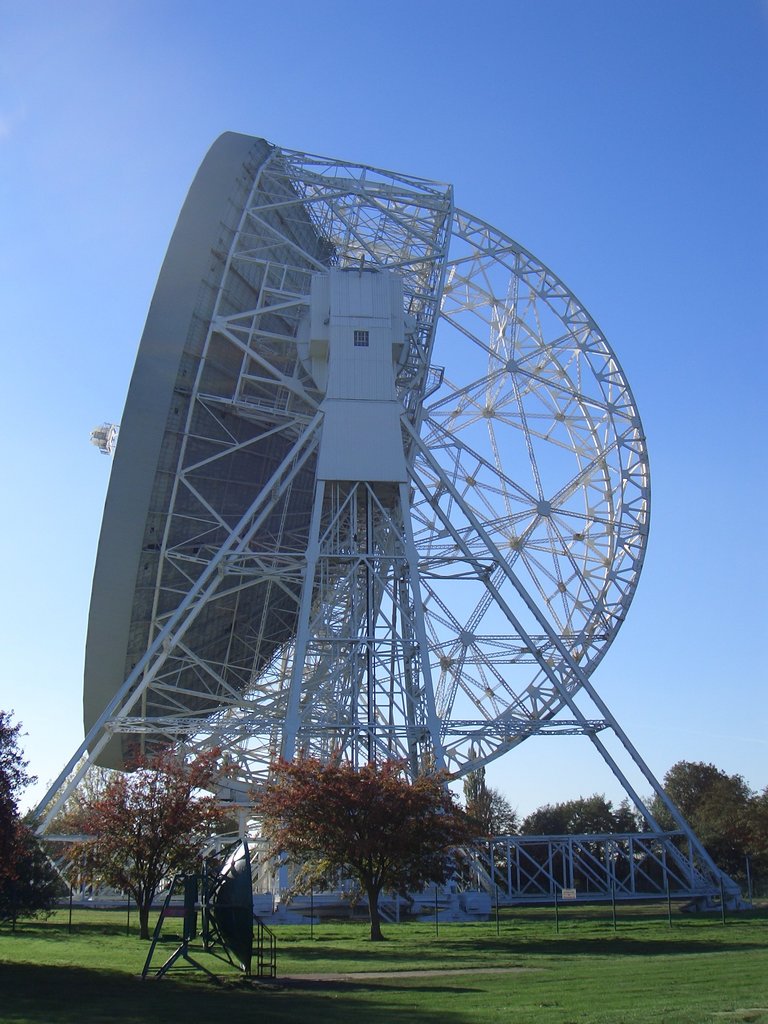
Image courtesy of
Wikipedia
  Q:  The Lovell Telescope at Jodrell Bank was for many years the
         largest radio telescope in the world, with a diameter
         D = 76 m.  If it observes 21-cm radiation,
         what is its resolution?
That's ... not very sharp. Would you be satisfied with pictures of M33 like this ...
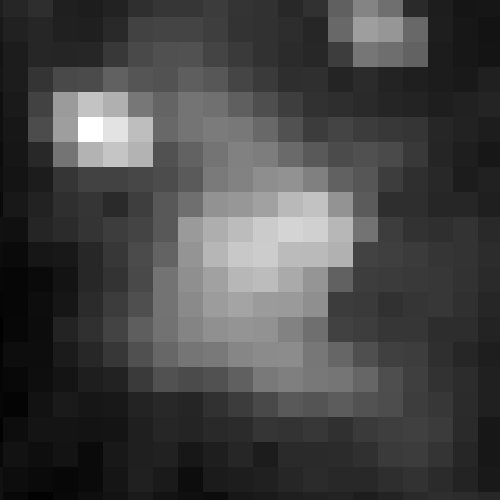
... instead of this?
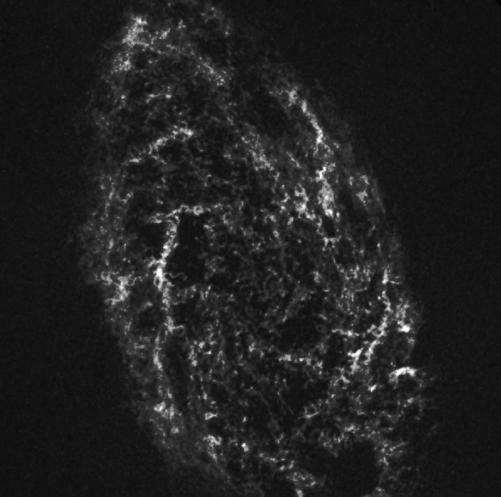
Image taken (and slightly modified) from
VLA observations of M33 at 21 cm
But how large would radio telescopes have to be to provide resolutions similar to that of optical telescopes? Suppose we want to provide a resolution of 1 arcsecond.
  Q:  How large a telescope operating at 21-cm would be required
          to produce a resolution of 1 arcsecond?
Building structures that large seems ... difficult.
A very simple system consists of two antennae, separated by some distance D. We point both antennae at the same source in the sky, measure the electric signal induced in each one, and combine those two signals. Note that, in general, one of the antennae will be a bit closer, dL, to the target than the other; hence, wave fronts from the target will reach that antenna a bit earlier. We need to delay the signal from that antenna by the extra time, dt = dL / c, that it takes the waves to reach the farther antenna before we combine the signals.
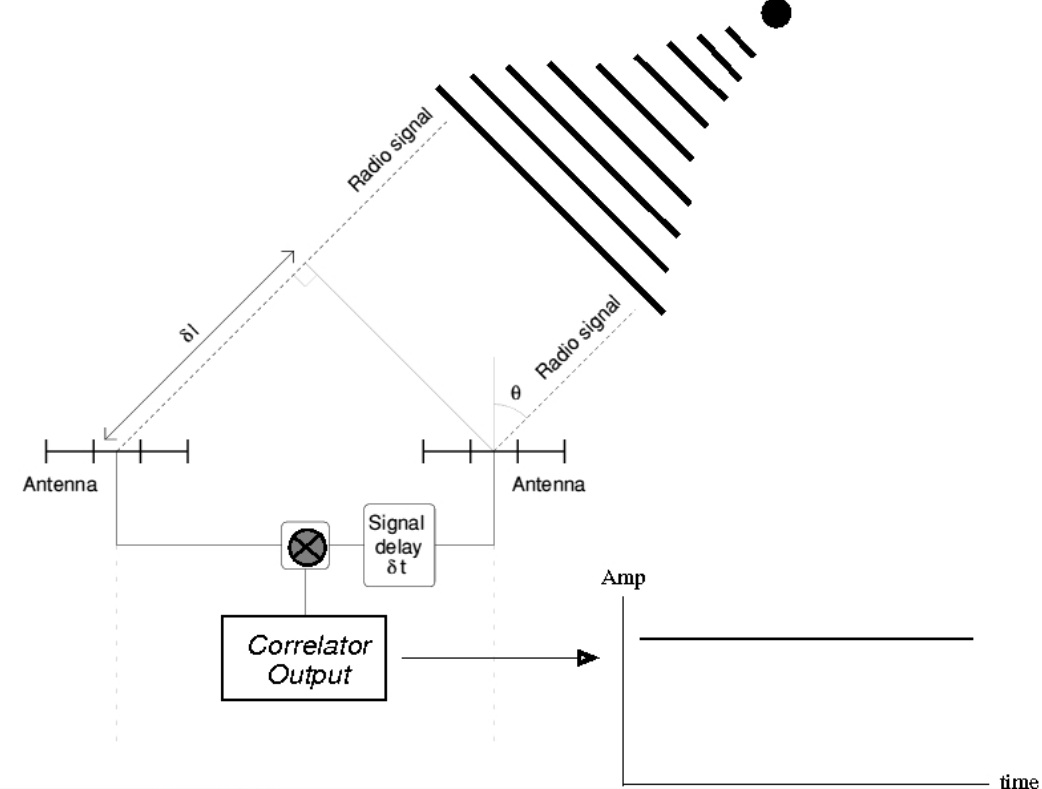
Image taken from
Introduction to Radio Interferometers
by Mike Garrett (ASTRON/Swinburne)
A single point source of waves will produce a simple, constant output. Easy peasy. This will be true no matter how far apart the dishes are placed.
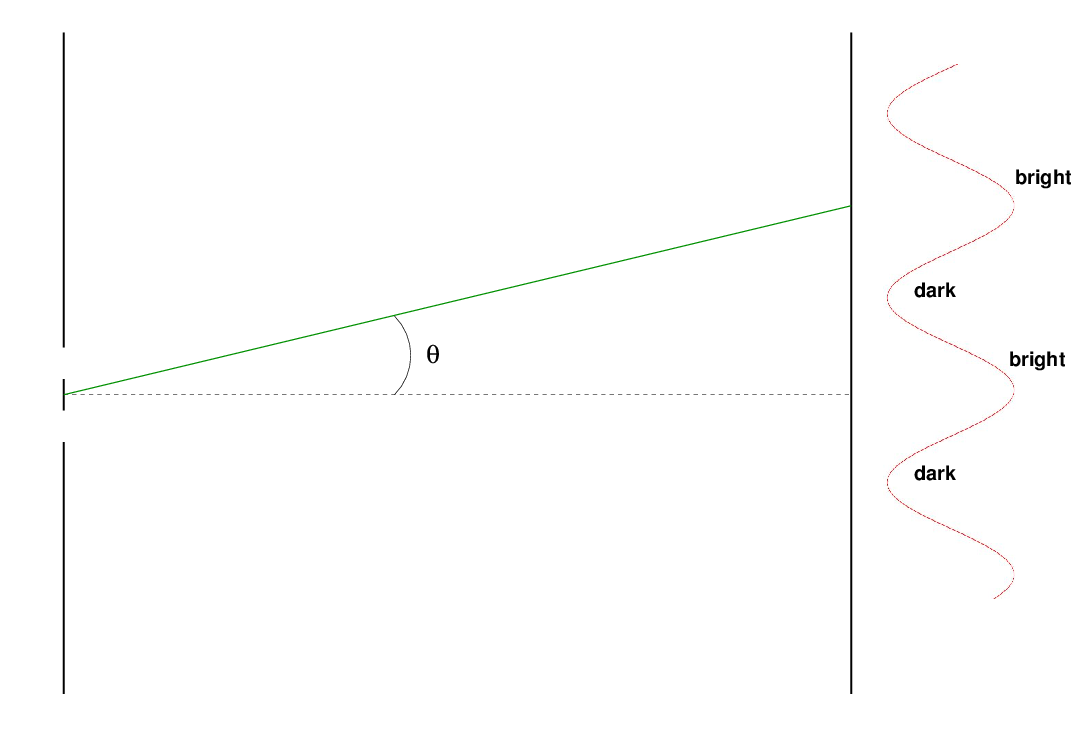
But what if the source is more complicated? Suppose that the source is double: two points of radio waves, separated by some angular distance θ. The waves from these sources will interfere with each other, creating a familiar pattern when they reach the ground:
Figure taken in part from
The Physics Classroom
If the two dishes are close together, they will record almost exactly the same combination of the two wave fronts ... and so we would deduce a single source.
But if we move the dishes farther apart, they will sample the combined waves in signficantly different regions, recording very different results. That will be our clue that the source is NOT a single point.
Figure taken in part from
The Physics Classroom
One might build a simple two-element interferometer with movable dishes, so that one could change the spacing and measure the combined signal at many different separations. Radio (and a few optical) astronomers use the term "visibility amplitude" to describe something like this.
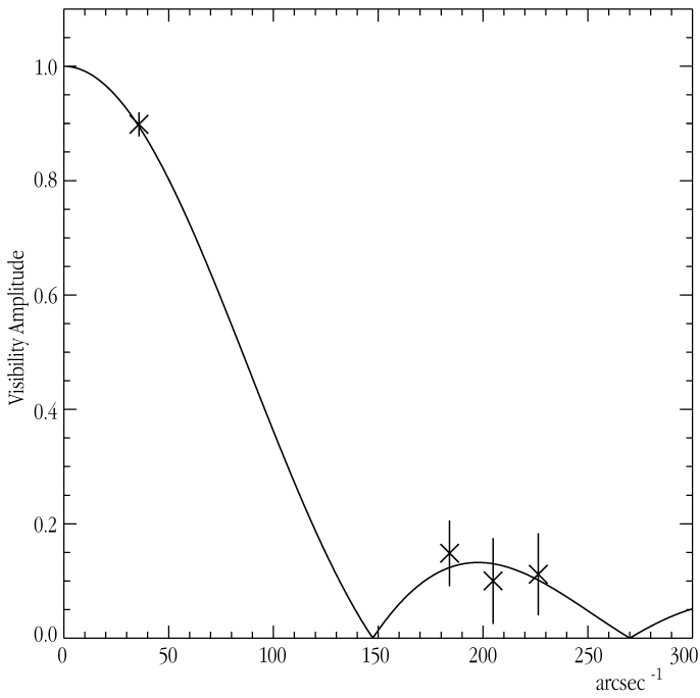
Visibility curve of psi Phoenicis measured by the VLT
courtesy of ESO
When we use an interferometer to record the amplitude and phase of electromagnetic waves at some location on the ground, we must apply some tricky mathematics to figure out how these measurements are connected to the sources of the waves in the sky. Let's give these two sets of measurements names:
Intensity T(l, m) is pretty much what you know and love: the brightness of some sources in the sky, over some small angular region. If you took a picture with a regular optical telescope and a CCD, your digital image showing intensity as a function of (x, y) coordinates on the chip would be a faithful map of T(l, m).
The connection between the intensity in the sky and the recorded signals on the ground is simply (hah!) a Fourier Transform:
For example, given a rather unusual source T(l, m) shown below, one can compute the visibility's amplitude and phase.
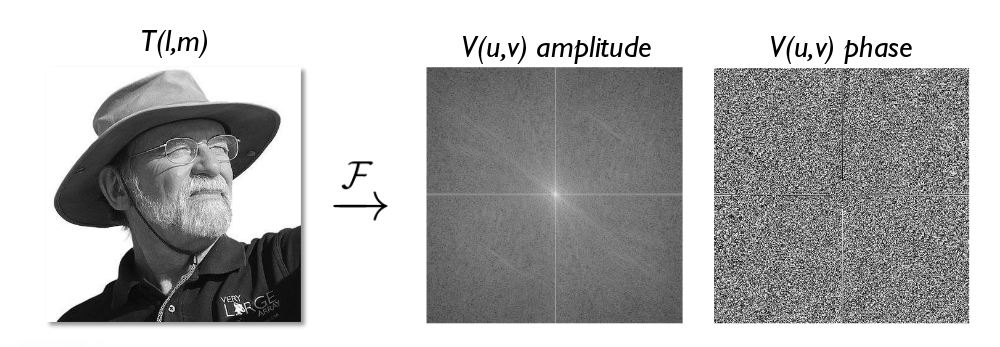
Figure taken from
Imaging and Deconvolution
by David Wilner (Harvard-SAO)
Perhaps a more simple, and familiar, example, is that of a uniform disk. Suppose you look at a star with an interferometer. The response of your combined signals on the ground will be ... an Airy function (aka Bessel function)!
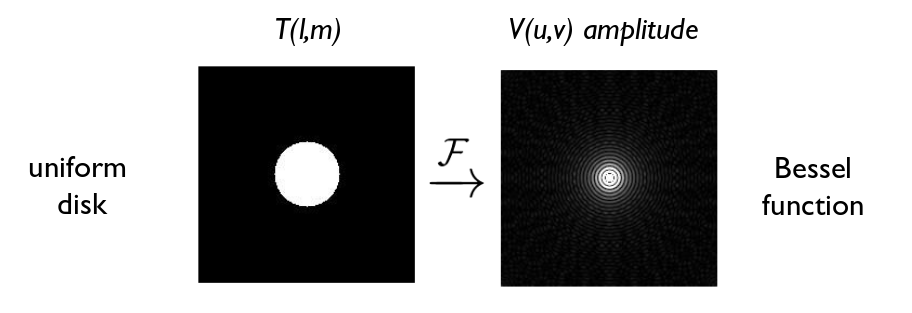
Figure taken from
Imaging and Deconvolution
by David Wilner (Harvard-SAO)
Here's a zoomed-in version of the Airy function:
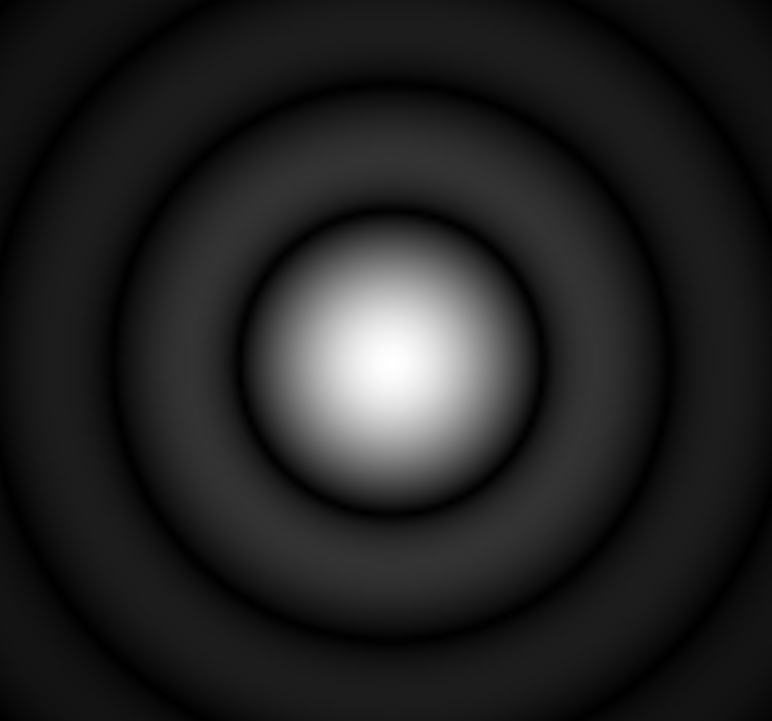
Airy pattern courtesy of
Wikipedia and
Sakurambo
This particular relationship explains the figure I showed a short time ago: the "visibility curve" for a giant star, measured using an (optical) interferometer. When the elements are close together, they see pretty much the same signal; but as they move farther apart, the dishes fall into the first zero of the Airy function, and the combined signal drops to a small value. In this particular case, astronomers were able to determine that the disk of phi Phoenicis has an angular diameter of about 0.0082 arcseconds.
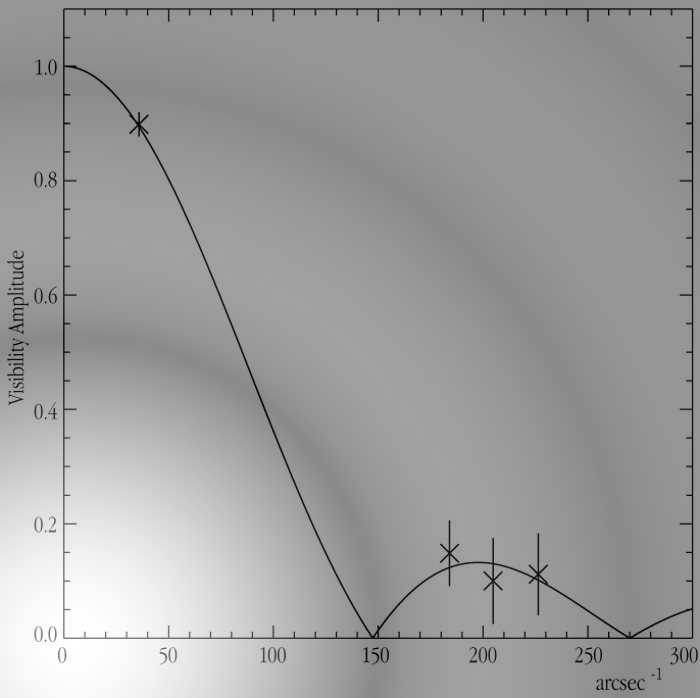
Visibility curve of psi Phoenicis measured by the VLT
courtesy of ESO
We can go the other way, too: if we start with a set of dishes on the ground, at some specific coordinates (u, v), then we can use a Fourier Transform to figure out what sort of "beam", or "shape of sensitivity", they will have on the sky.
For example, a pair of dishes which are close together on the ground, separated horizontally, will be most sensitive to sources which are separated horizontally in space, but far apart.
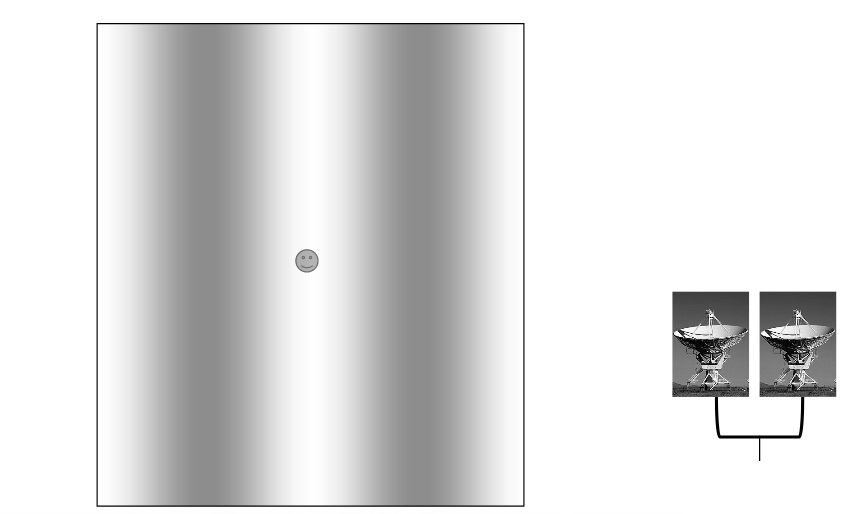
Figure taken from
Imaging and Deconvolution
by David Wilner (Harvard-SAO)
If we move the dishes farther apart, then the "beam" responds better to sources which are close together on the sky.
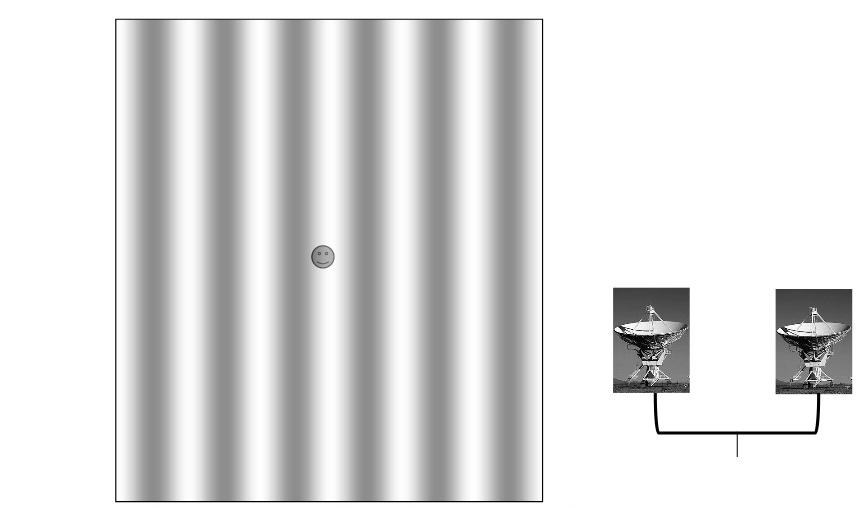
Figure taken from
Imaging and Deconvolution
by David Wilner (Harvard-SAO)
If we "tilt" the baseline between the dishes on the ground, then the pattern of the "beam" in the sky also tilts.
Figure taken from
Imaging and Deconvolution
by David Wilner (Harvard-SAO)
But what if we have more than two antennae? If we have three antennae (A, B, C) then we can compute the correlation between each pair:
(A, B) (A, C) (B, C)
So, 3 dishes give us 3 pairs; another way to say this is "3 separations". If the 3 antennae are not colinear, then each pair will create a set of fringes which are tilted in a different direction. The net result will be that our 3-element interferometer will be able to distinguish structure in more than a single spatial direction.
Why does the left-hand panel below show 6 dots, if there are only 3 separations? Because we get one vector if we move from dish A to disk B, and a different vector (same size, opposite direction) when we move from dish B to dish A. We can add another dot on the (u,v) plane, but it doesn't really make a difference in the shape or size of our beam.
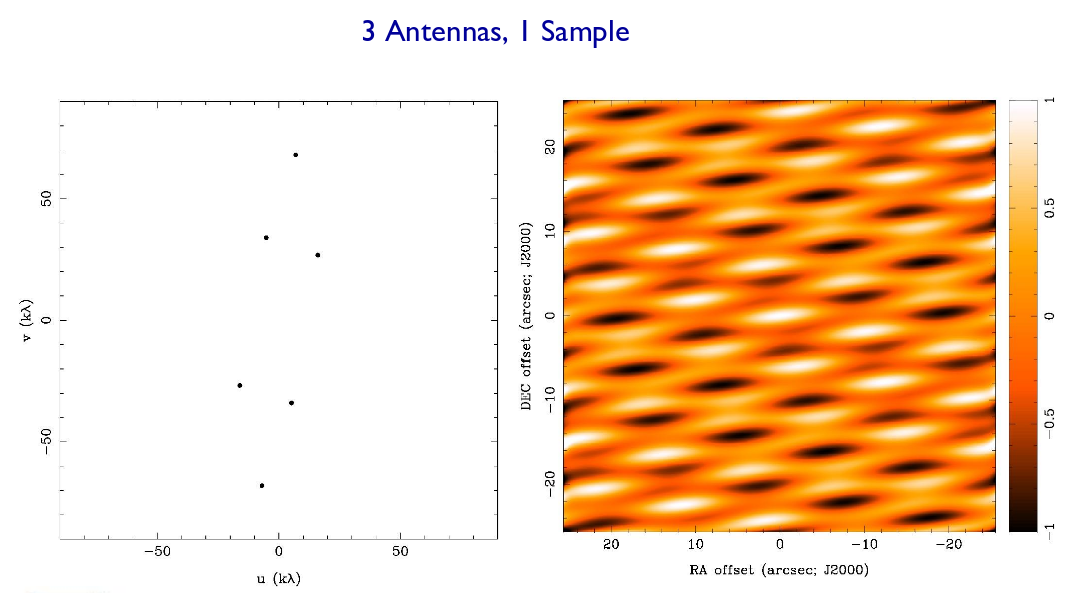
Figure taken from
Imaging and Deconvolution
by David Wilner (Harvard-SAO)
  Q:  In the figure above, in which direction is the interferometer
          MOST sensitive to small spatial features?   Why?


  Q:  In the figure above, in which direction is the interferometer
          LEAST sensitive to small spatial features?   Why?
If we add more antennae, we create more baselines, and our sensitivity to structure on different scales and in different directions increases. Suppose we have 7 antennae.
Q: How many independent pairs are there in a 7-element system?
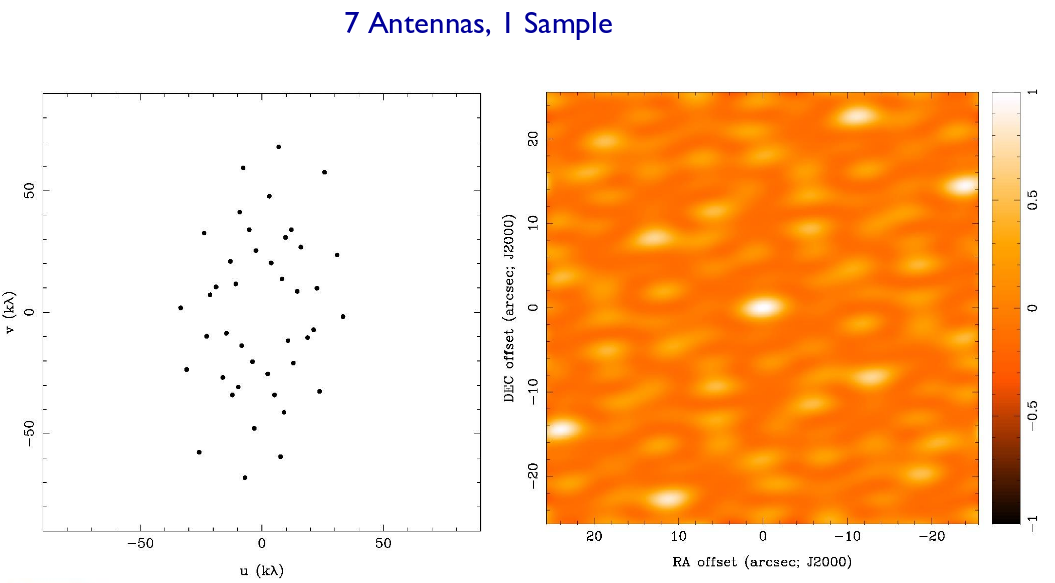
Figure taken from
Imaging and Deconvolution
by David Wilner (Harvard-SAO)
If we acquire measurements over a period of several hours, then the Earth's rotation will move our antennae in the (u, v) plane, providing a more even and uniform coverage. That means that our "beam" becomes narrower and better defined.
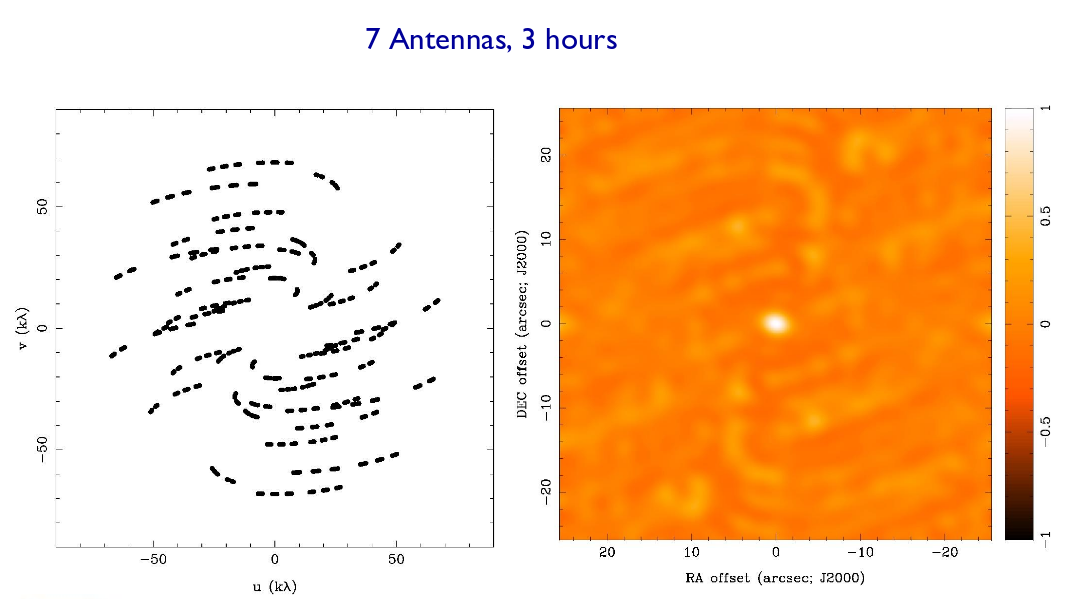
Figure taken from
Imaging and Deconvolution
by David Wilner (Harvard-SAO)
If you'd like to play around with the beams resulting from different numbers and arrangements of antennae, try the friendlyVRI program.
For any particular configuration of dishes, there will be a SMALLEST and a LONGEST baseline between elements. Those extreme separations set limits on the spatial features which can be detected with the configuration:
In other words, it's the innermost region of the (u,v) plane which gives you information on large, extended emission; but the outermost region of the (u,v) plane which lets you notice small details.
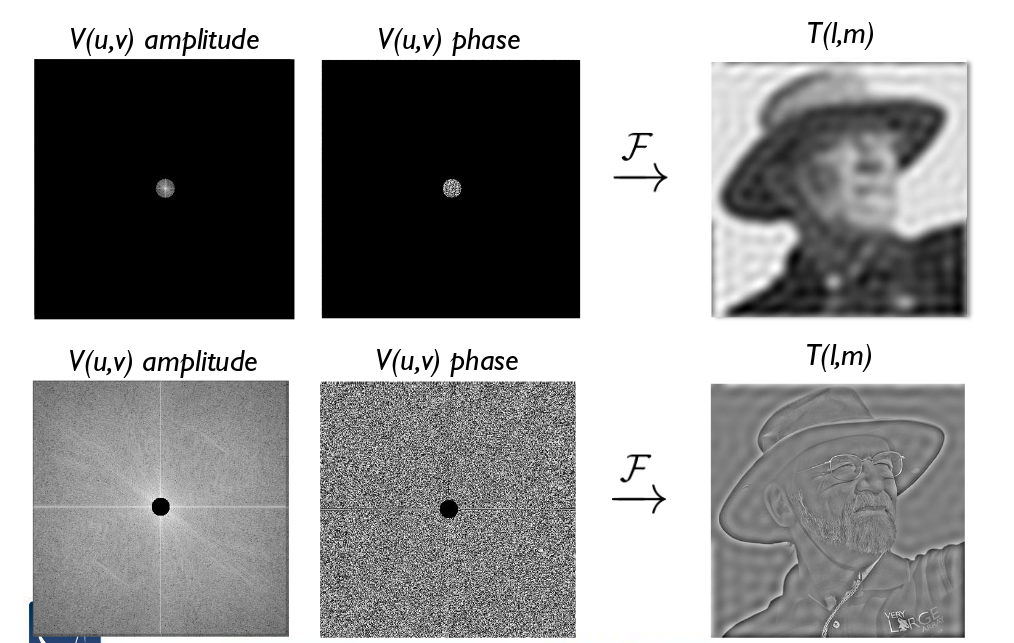
Figure taken from
Imaging and Deconvolution
by David Wilner (Harvard-SAO)
In fact, interferometers are notorious for being unable to measure the TOTAL FLUX of a source properly. If you want to be sure that you've properly recorded the flux of a source, it's best to use a single dish which creates a beam larger than the object.
So, in general, the arrangement of your antennae (and the rotation of the Earth) create a pattern in the (u,v) plane (upper right). The fourier transform of that pattern yields the shape and size of the "dirty beam" on the sky (upper left). When one convolves a true map of intensity on the sky (lower left) with this dirty beam, one finds the result of the observing session: a "dirty image", (lower right), which combines real features on the sky with artifacts due to the incomplete coverage of the (u,v) plane.
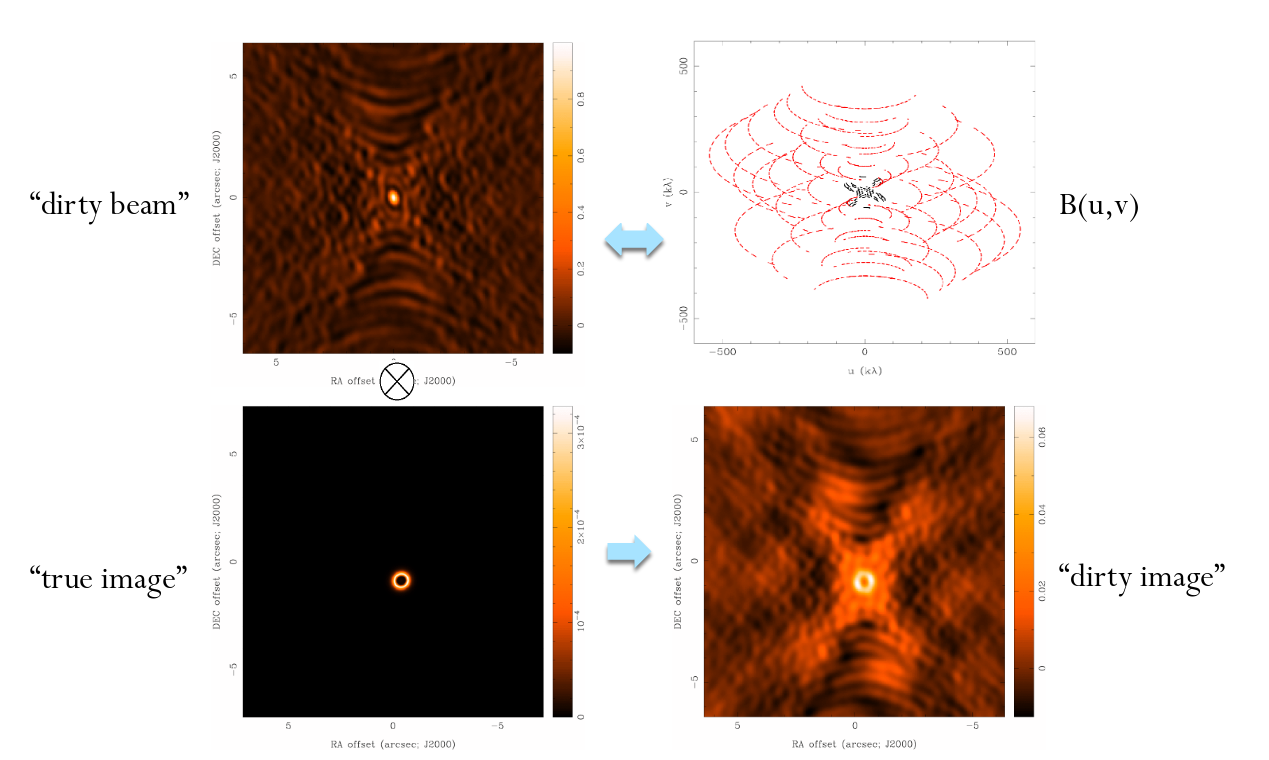
Figure created by David Wilner
The task of radio astronomers is to "clean" the dirty radio images recorded by their equipment in order to uncover the original, celestial arrangement of radio sources in the sky.
The Atacama Large Millimeter/sub-millimeter Array (ALMA) is one of the newest and most powerful interferometers. It sits very high in the mountains of Chile, at an altitude of about 5000 meters.
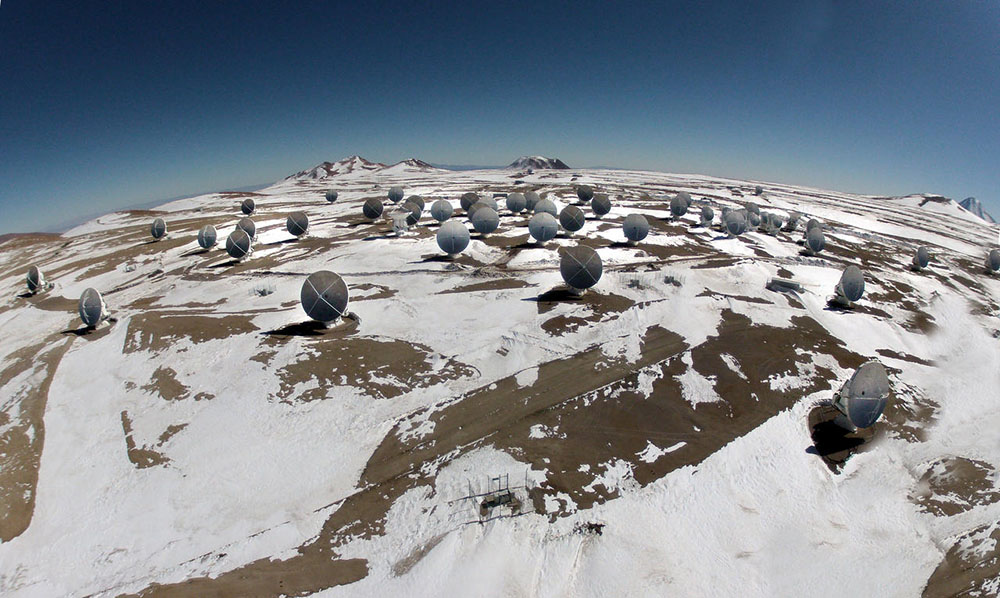
Image courtesy of
Ariel Marinkovic – ALMA (ESO/NAOJ/NRAO)
ALMA consists of 66 antennae of several different sizes, which can be arranged in several configurations. The baselines between elements range from around 150 meters to 16,000 meters.
  Q:  How many pairs of elements does ALMA contain?


  Q:  At a wavelength of 1 mm, what is the largest angular feature
          which ALMA can measure accurately?  (arcsec)


  Q:  At a wavelength of 1 mm, what is the smallest angular feature
          which ALMA can measure accurately?  (arcsec)
One of ALMA's most recent discoveries is a set of 11 young proto-stars which lie not far from the center of our Milky Way Galaxy. One of them looks like this:
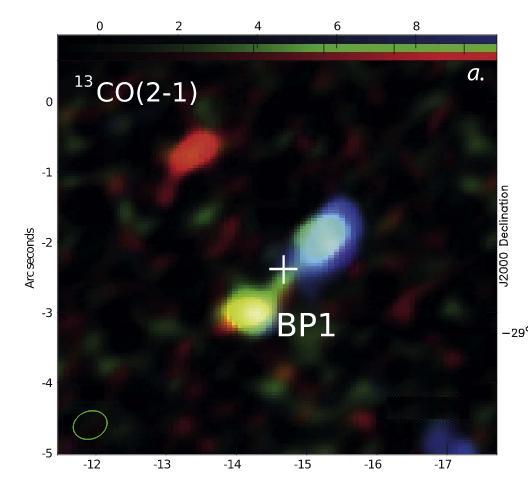
Taken (and slightly modified) from Figure 1 of
Yusef-Zadeh et al., ApJL 850 (2017)
  Q:  What is the linear distance between the two lobes of
            the bipolar outflow?
But ALMA can do more than images -- it can also provide spectra. Or spectral images.
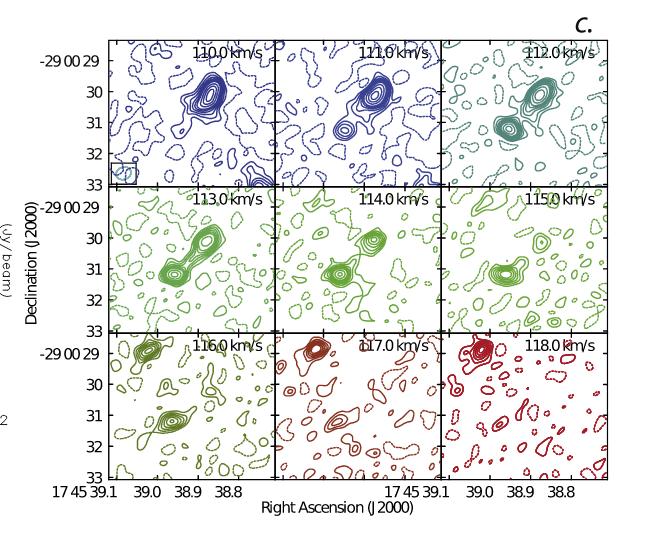
Taken from Figure 1 of
Yusef-Zadeh et al., ApJL 850 (2017)
  Q:  How fast is material flowing from the center out to each
            of the two lobes?


      How long would it take material moving at this speed to
            travel from the center of the system to the
            outer edges?  (aka "the kinematic age")


      The authors estimate the mass of each lobe to be about
            0.15 solar masses.   What is the kinetic energy
            of each lobe?


      How long would the Sun's entire luminosity have to be
            converted to kinetic energy to power these lobes?
Copyright © Michael Richmond.
This work is licensed under a Creative Commons License.