 Copyright © Michael Richmond.
This work is licensed under a Creative Commons License.
Copyright © Michael Richmond.
This work is licensed under a Creative Commons License.
Today, we continue to discuss HII regions. They appear as "warm ionized" in the table below.
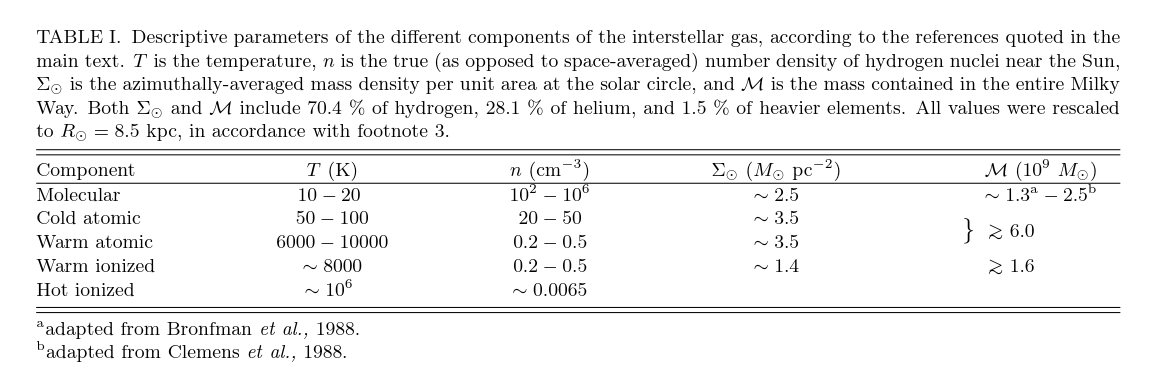
Table 1 taken from
Ferriere, K. M., Reviews of Modern Physics, 73, 1031 (2001)
Last time, we looked at the effect of a hot star on the gas around it, and derived a relationship between the number of ionizing photons emitted per second by a star and the radius of the HII region which it will create.

We choose a few representative quantities, among which was a density of hydrogen atoms and, therefore, protons:
But stars are born from dense molecular clouds, right? Suppose we imagine a NEWBORN star, formed when a clump of molecular gas collapsed on itself. When this star begins to fuse hydrogen in its core, it is still surrounded by a dense, molecular medium. Will this change in density make a significant change to the size of the ionized region around the star?
Yes, it will. First, because the recombination time tr depends on the density of the local gas. If the surrounding gas density is 1010 molecules per cubic meter, when those molecules are broken into two hydrogen atoms, and then ionized, the ELECTRON number density will be 2 x 10¹⁰ electrons per cubic meter.

  Q:  Using this larger electron density, and the same values

          T = 104 K

          σ = 5.9 x 10⁻²⁵ sq. m.


      what is the recombination time now?
Now, the formula we derived last time for the Stromgren radius around a star was

We now have a shorter value for recombination time, but a larger value for the proton density: np = 2 x 10¹⁰ protons per cubic meter, the same as the electron number density.
  The radius of a "mature" Stromgren sphere, surrounding a star with
  ionizing luminosity NUV = 1049 photons per second, was

         RS = 3.9 x 10¹⁷ m


  Q:  What is the radius of a "newborn" Stromgren sphere?
Well, this is a much smaller radius. The "newborn" HII region is much more compact.
Because it has a high density, and a high temperature, the pressure inside is also large. If the pressure inside is high enough, the HII region will start to push the surrounding cold, molecular gas outward; in other words, the HII region will grow over time.
Just what is the pressure inside, and how does it compare to the pressure outside?

If we compare two regions -- hot, ionized gas inside the HII region, and cold, molecular gas outside -- the Bolztmann constant cancels:

                 inside              outside
  -------------------------------------------------------------
  density        4 x 10¹⁰        1 x 10¹⁰

  temperature      104 K          20 K

  -------------------------------------------------------------


    Q:  Is the pressure inside the newborn HII region significantly
        larger than the pressure outside?
Okay, looks like the ionized gas will start to expand. How fast will it grow? The material will move at the speed of sound of the ionized gas.

   Q:  What is the value for mass m that we should use in this
          calculation?   Why?


   Q:  Using that correct value, what is the speed of sound in the
          ionized gas of the HII region?
Now, as the HII region expands, the density inside will decrease, which will start to modify some of the properties of the gas; doing the physics properly is complicated.
But we can do just a couple of quick, back of the envelope calculations to get a rough idea for the timescales involved. First, we can estimate the time for the newborn HII region to grow in size "significantly".

Q: What is the doubling time for the newborn HII region?
It takes much longer for the HII region to reach its final size, when the pressure inside matches that outside, so any simple calculation can't give a very accurate result. I've done some of the work, and find that when the pressures match, this particular "mature" HII region will have a size of roughly

  Q:  Assuming that the cloud continues to expand at the same speed,
      how long will it take to reach this "mature" size?

      Express your answer in seconds and in years.
That's a pretty long time.
Wait -- is it TOO LONG a time? Remember, this whole process is driving by the energetic photons emitted by the hot star at the center. Just how long will a massive, hot star continue to shine?
One might guess that a massive star ought to last longer than a low-mass star, but that's not the case. High-mass stars have much higher temperatures inside their cores, which cause the fusion reactions to run more quickly. As a result, they produce a much higher amount of energy (higher luminosity), which causes them to exhaust their fuel more quickly.
To a first approximation, then, if we know the MASS and LUMINOSITY of a star, we can estimate its lifetime, at least in a relative way.

Here's a table of properties of some high-mass, hot stars. Please fill in the final two colummns. I've estimated the main-sequence lifetime of the Sun to be about 10 billions years = 10,000 million years, which will allow you to convert a relative lifetime to a specific number.
  spType   T(K)     L(solar)  R(solar)   M(solar)     Life(solar)    Life(Myr)
------------------------------------------------------------------------------
     O5    44500      790000    15         60

     O8    35800      170000    11         23

     B0    30000       52000     8.4       17.5

     B3    18700        1900     4.2        7.6

     B5    15400         830     4.1        5.9

     A0     9520          54     2.7        2.9

     A5     8200          14     1.9        2.0

     G2     5780           1     1          1               1          10,000
-------------------------------------------------------------------------------
We've seen plenty of IMAGES of HII regions, gaudy in their glowing red costumes. But what will we see in the SPECTRUM of an HII region?
Q: Can you identify the H-alpha and H-beta lines?
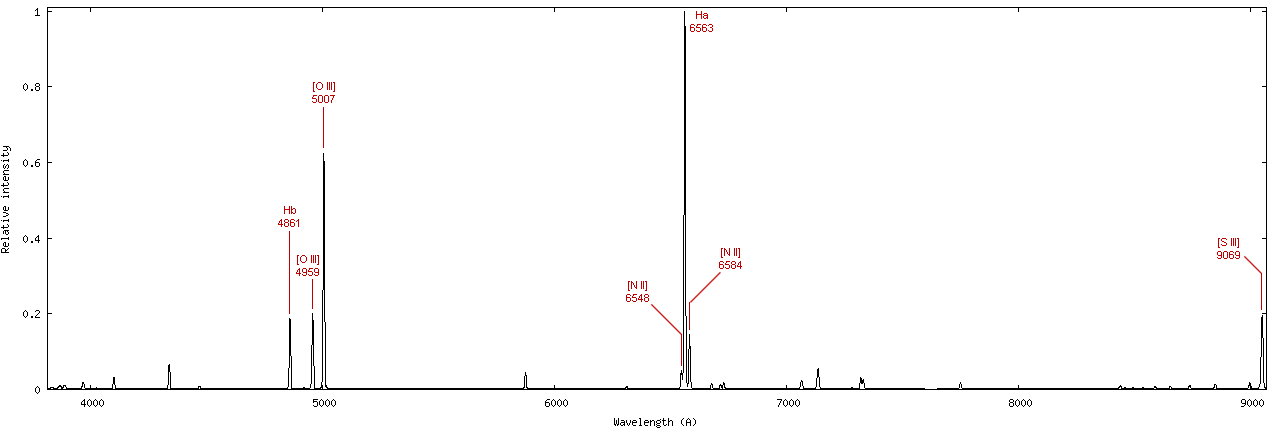
Spectrum of M42 (Orion Nebula) courtesy of
Christian Buil
In addition to the lines of hydrogen, there are strong emission lines of several other elements. Among them are oxygen and nitrogen. However, these aren't produced by ATOMS of those elements; instead, they are IONS: atoms from which one or two electrons have been stripped by high-energy photons.
  Q:  How many electrons have the oxygen atoms lost?
      What about nitrogen atoms?
If one digs down to fainter lines, one can find emission from a wide range of elements:
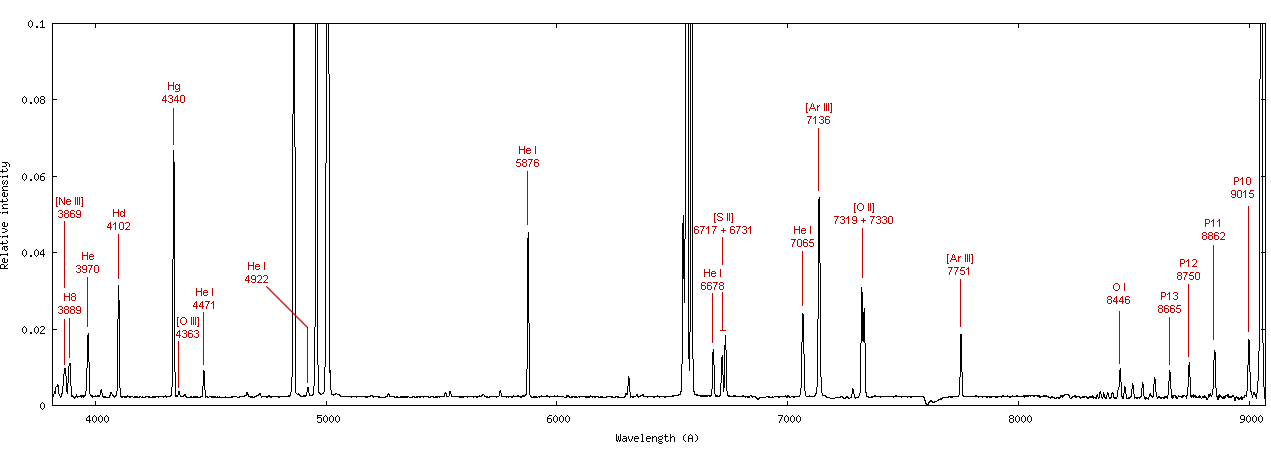
Spectrum of M42 (Orion Nebula) courtesy of
Christian Buil
Careful analysis of these spectra allows astronomers to determine the abundances of a number of elements. It's tricky, because one needs to figure out the fraction of atoms of, say, Nitrogen that are neutral, or ionized once, or ionized twice; and then, on top of that, determine how many ions are in the ground state, first excited state, etc. If you'd like to know more, consider reading about
Nevertheless, some astronomers have spent years observing HII regions from different locations inside the Milky Way, and carefully measured the abundances of elements from their spectra. The results show a clear trend with galactic radius:
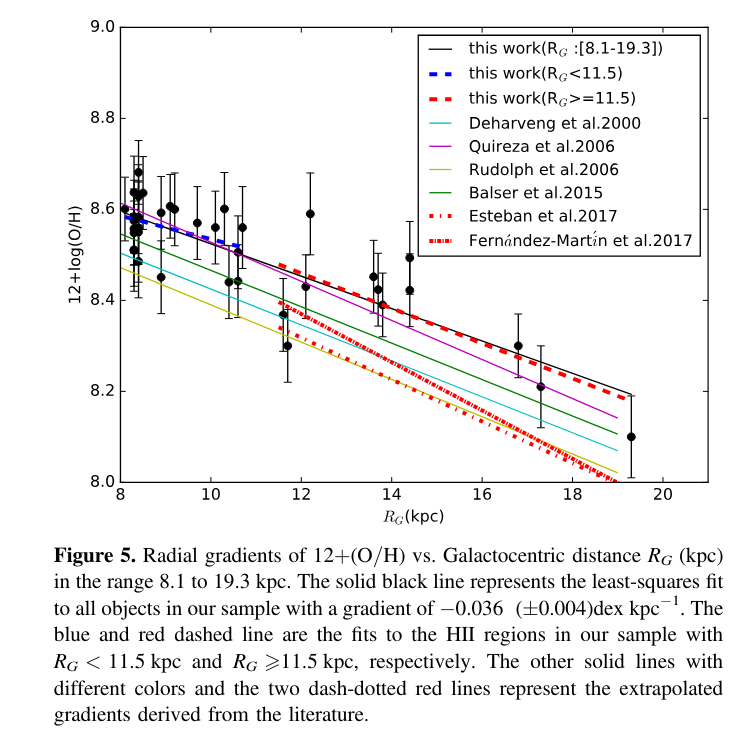
Figure 5 from
Wang et al., PASP 130, 4301 (2018)
  Q:  Compared to its abundance at the solar region (8 kpc from the center),
      how much less abundant has oxygen become at 19 kpc from the center?

      Is there half as much?  10 percent as much?
We can see HII regions in other galaxies -- the relatively nearby ones, at least. Because they glow brightly at very well-defined wavelengths, they allow scientists to measure precisely the motions of gas inside those galaxies.
For example, consider this spiral galaxy, UGC 2936. One can just barely see a few knots of brightness in the spiral arms; each one is large HII region, or complex of HII regions together in a molecular cloud.
Color image of galaxy UGC 2936
If astronomers place a long slit along the major axis of the galaxy, and then send the light from that slit through a spectrograph, they can detect the bright emission lines from different locations along the major axis.
Location of long slit placed over major axis of UGC 2936
Here's a two-dimensional spectrum of this galaxy, showing wavelengths around the H-alpha line. Recall that hydrogen atoms at rest will emit this line at λ = 6563 Angstroms.
Figure 1 (left panel) from
Pickering, T. E., et al., AJ 118, 765 (1999)
  Q:  This galaxy is moving away from the Earth as a consequence
      of the expansion of the universe.  Use the wavelength
      of H-alpha at the center of the galaxy to calculate its velocity.
But we can learn more than just the average velocity of the entire galaxy. Note that light from the spiral arms above the center are shifted to longer wavelengths, while light from the spiral arms below the center are shifted to shorter wavelengths.
Q: What could explain this pattern of different shifts?
Exactly -- ROTATION. Stars and gas in the arms above the center of UGC 2936 are moving away from us, while the arms below the center are moving toward us. By measuring the sizes of these shifts, we could determine the speed of the material, and hence the velocity which with the galaxy is rotating.
I've found several examples from the literature in which astronomers have not only measured the velocity of HII regions in different portions of a galaxy, but also determined the distance of each HII region from its galaxy's center. Let's use these rotation curves to estimate the mass of each galaxy.
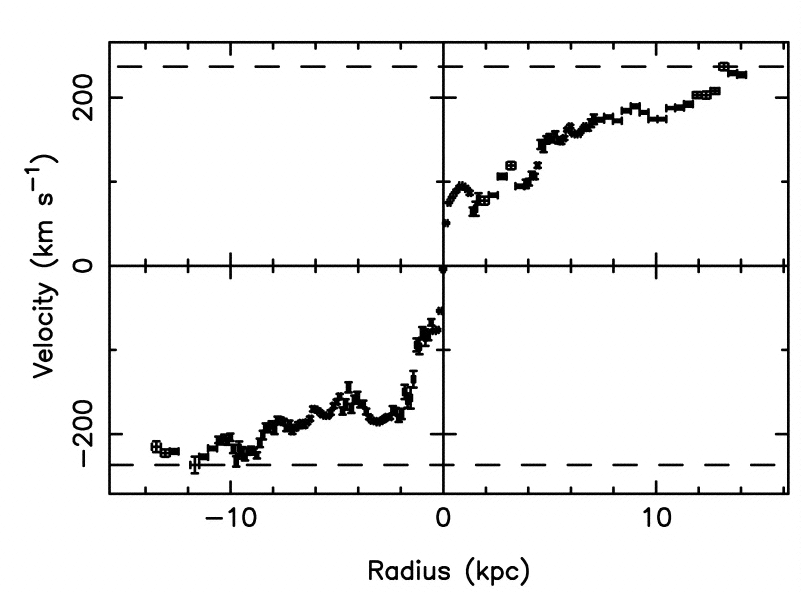
Figure 1 (right panel) from
Pickering, T. E., et al., AJ 118, 765 (1999)
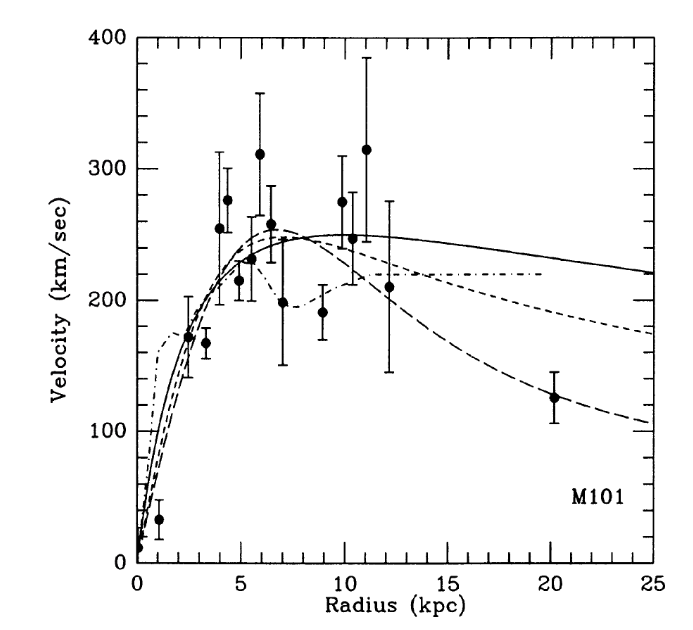
Figure 1 from
Zaritsky, Elston and Hill, AJ 99, 1108 (1990)
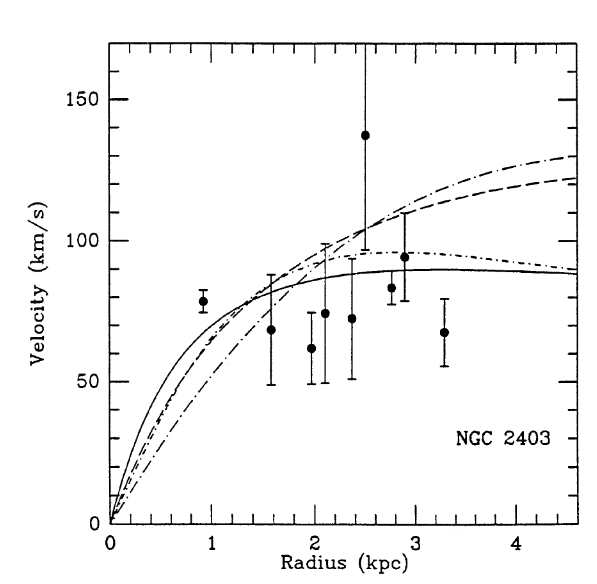
Figure 2 from
Zaritsky, Elston and Hill, AJ 99, 1108 (1990)
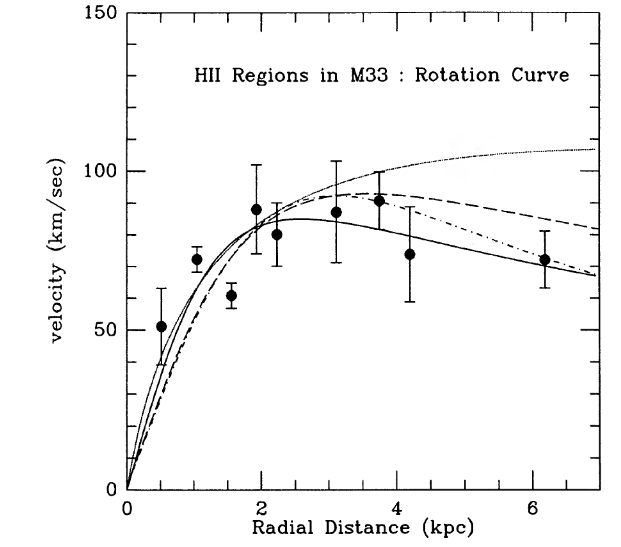
Figure 2 from
Zaritsky, Elston and Hill, AJ 97, 97 (1989)
Copyright © Michael Richmond.
This work is licensed under a Creative Commons License.