
 Copyright © Michael Richmond.
This work is licensed under a Creative Commons License.
Last time, we saw that careful measurements of the light curve of an eclipsing binary system, plus radial velocities calculated from a set of spectra, allow one to determine the physical properties -- size, mass, temperature, separation -- of an eclipsing binary system. Today, we look at two examples of how astronomers have USED this information.
Physics provides us with a set of differential equations connecting the properties of a star in static equilibrium.


We can divide a star into a set of nesting spherical shells, and use these equations to derive the properties of one shell from those of its neighbor(s). The result is more accurate the more shells we use. That's a problem for people using pencil and paper, but easy as pie for a computer. So, over the past forty or fifty years, astronomers have built more and more complicated models of main-sequence stars. You've already played with one: remember STATSTAR?
These computer models are great. We can choose any particular combination of parameters such as mass and chemical composition, and the computer will build a model telling us the properties of that star on the main sequence. I used STATSTAR to make models of stars with the following properties:
Each model contains a wealth of information about the temperature, density, luminosity, and so forth, all at a large range of positions within the star. For example, we can look at the relationship between the mass of a star on the main sequence and its radius. It appears to be nearly linear: double the mass, and you double the size.

There's just one question: are the models correct? Just because some computer program calculates a number doesn't mean it corresponds to some property of a real star.
  Q:  How could we check to see if the computer model produces
            accurate output?
Right! We could make measurements of some real stars in eclipsing binary systems, measure their properties precisely, and then compare to the predictions of the computer models.
As an example, let's pick the connection (if any) between the mass of a star and its radius. According to STATSTAR, there is a simple linear relationship, at least for stars over the range from 0.5 to 10 solar masses.
In the 1990s and early 2000s, some astronomers spent their time making careful measurements of eclipsing binary stars to see if this prediction was accurate. This isn't a trivial exercise: in order to compile a good light curve through several filters, one might need to spend five to ten nights at a telescope, taking image after image. Consider, for example, the binary star IM Vir . A group of students at Gettysburg College observed it over the course of two months to build up the light curve.
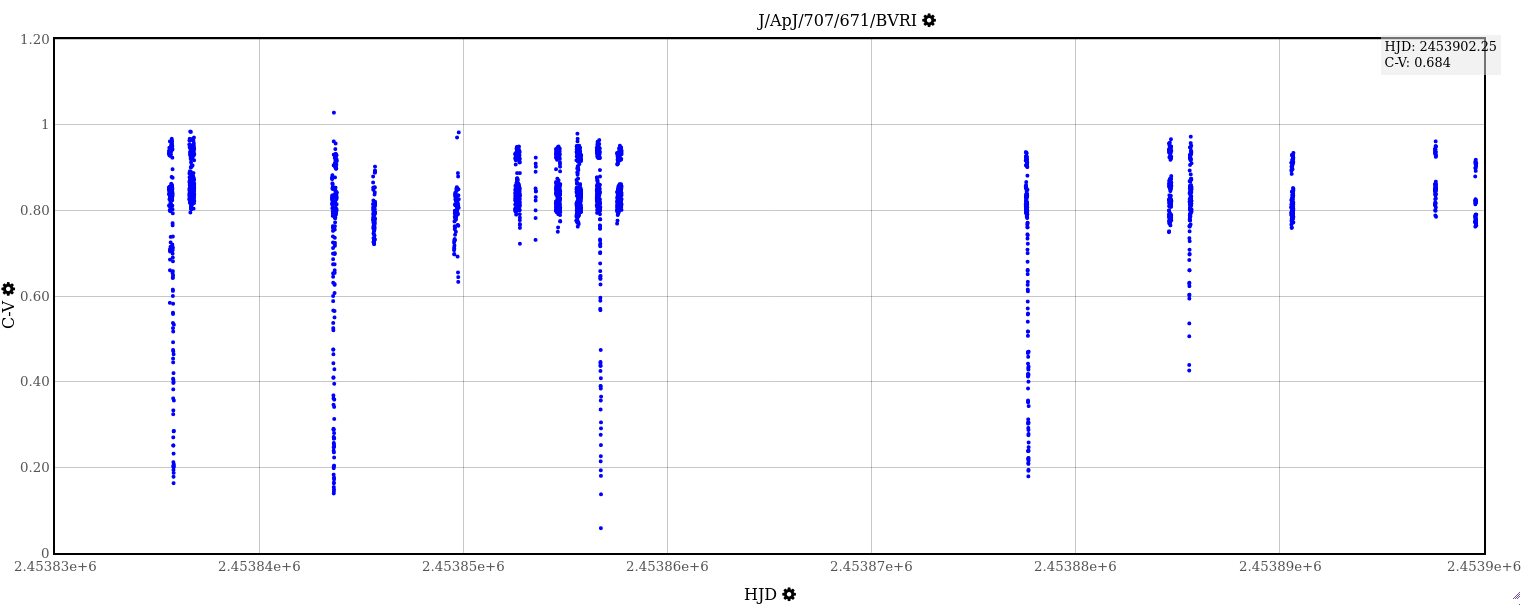
Based on data in
Morales et al., ApJ 707, 671 (2009)
Q: How many nights did the students acquire images?
Thanks to all that hard work, they were able to measure the light curve of the binary in four passbands.
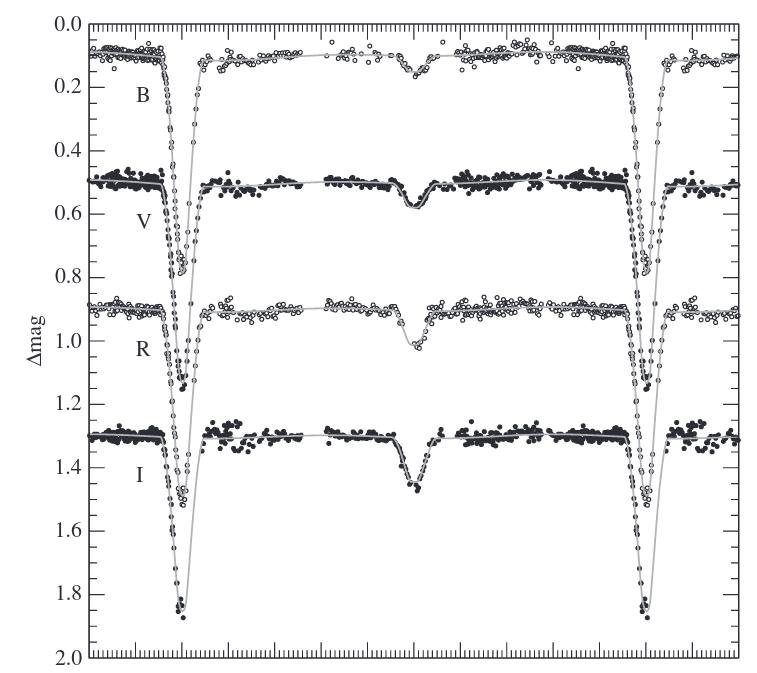
Taken from Figure 3 in
Morales et al., ApJ 707, 671 (2009)
They also analyzed archival spectra of the system acquired over 25 years, spread out over 128 nights, using three different telescopes. With these spectra, they were able to measure the velocities of each star.

Taken from Figure 2 in
Morales et al., ApJ 707, 671 (2009)
Putting all the information together, they were able to estimate many of the physical parameters of the system.

Taken from Table 11 of
Morales et al., ApJ 707, 671 (2009)
  Q:  What is the uncertainty in the mass of the primary,
            expressed as a percentage?


  Q:  What is the uncertainty in the radius of the primary,
            expressed as a percentage?
When the authors compare their results to a set of stellar models, they find ... some problems.

Taken from Figure 11 of
Morales et al., ApJ 707, 671 (2009)
"Eh, so what?" you might say. "It's just one star --- big deal."
But this isn't the only case in which actual measurements don't seem to agree very well with the theoretical models. For example, the figure below from Torres et al., ApJ 640, 1018 (2006), places onto a single mass-radius graph the locations of both primary and secondary stars in four different eclipsing binary systems. Each system has two symbols of the same shape. Various models are shown by the solid and dashed lines, with different values of age and metallicity and other properties. If all is well, then each pair of symbols should lie along a single line.

A portion of Figure 15 taken from
Torres et al., ApJ 640, 1018 (2006)
But, as you can see, for both the "solid black circle" system, and the "hairy asterisk" system, the lower-mass component doesn't lie on the same line as the higher-mass component. It seems that the lower-mass components are sometimes LARGER in radius than the models predict.
And this disagreement appears in other systems, too. Note the number of stars which lie above the predicted radius in this sample. It is again stars with masses less than the Sun which have the largest discrepancies.

Figure 6 taken from
Spada et al., ApJ 776, 87 (2013)
Another way to display the same information is to compute the percentage difference between measured radius and theoretical radius, and plot that difference as a function of stellar mass. Points lying above the line represent stars which are larger than predicted.

A portion of Figure 7 taken from
Spada et al., ApJ 776, 87 (2013)
One possible clue to this mis-match may be related to the rotation speed of the stars. Kraus et al., (ApJ 728, 48 (2011), note that the stars lying farthest above the predicted relationship tend to be those which rotate most quickly.

Figure 9 taken from
Kraus et al., ApJ 728, 48 (2011)
They write
This trend supports the hypothesis that short-period systems are inflated by the influence of the close companion, most likely because they are tidally locked into very high rotation speeds that enhance activity and inhibit convection.
Aha! Perhaps we need to add some extra physics to our models ....
You've probably heard that the universe is expanding. But what exactly does that mean? And what is the evidence for this expansion?
Well, to explain "expansion," consider a loaf of raisin bread, sitting on a counter for a few hours. As time passes, the dough rises.
Click on the image below to see it in action!
Two key elements of an expanding structure are
So, in order to verify that the universe is expanding, astronomers need to be able to measure two properties of distant galaxies:
  Q:  How can astronomers measure the radial velocity of a galaxy?


  Q:  How can astronomers measure the distance of a galaxy?
And so it turns out that the key to measuring the expansion of the universe is finding some way to determine the DISTANCES to galaxies.
One promising avenue of attack is to identify a class of objects which act as standard candles; that is, which have some fixed absolute magnitude M. If we (somehow) know the absolute magnitude of a star in some distant galaxy, and if we can measure the apparent magnitude m of that star, then we can use the distance modulus formula to compute the distance d to the galaxy in parsecs.

So, where can we find some stars with known absolute magnitudes? Astronomers have several good candidates.
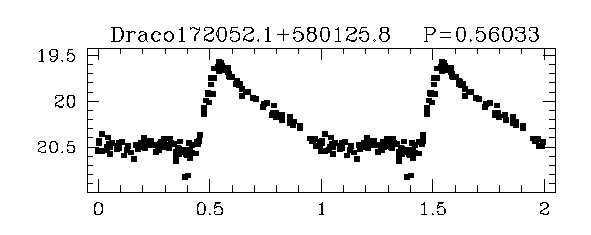

Taken from Figure 1 of
Bonanos et al., AJ 127, 861 (2004)
What makes RR Lyrae stars so important is that, to a fair approximation, all RR Lyrae stars have nearly the same absolute magnitude. That makes them good standard candles. If you look closely, though, you can see that the luminosity isn't exactly the same for all of them; it increases just a bit with the period of the pulsation.

Taken from figure 3 of
Muraveva et al., ApJ 807, 127 (2015)
The one question we need to answer before we can use RR Lyrae stars to measure distances to other galaxies is ... "What is the absolute magnitude of an RR Lyrae star?"
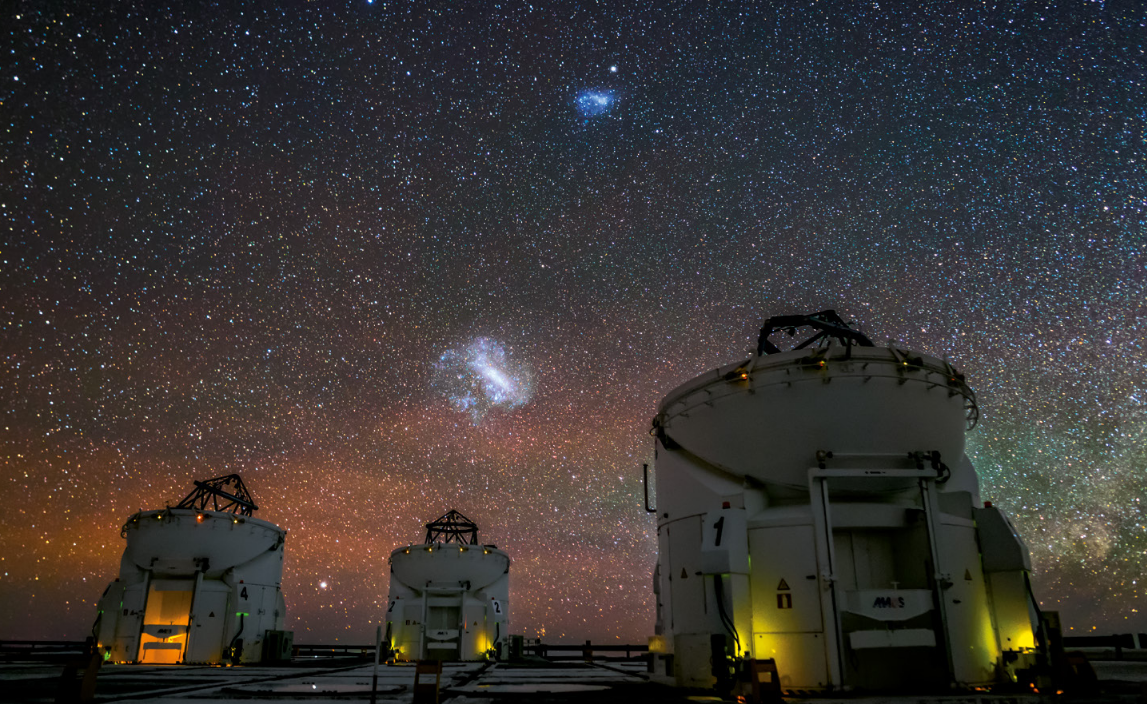
Image courtesy of
J. C. Munoz and ESO
So, if we could just determine the distance to the LMC, we could figure out the absolute magnitude of RR Lyrae stars, and then we could use them to measure distances to other galaxies.
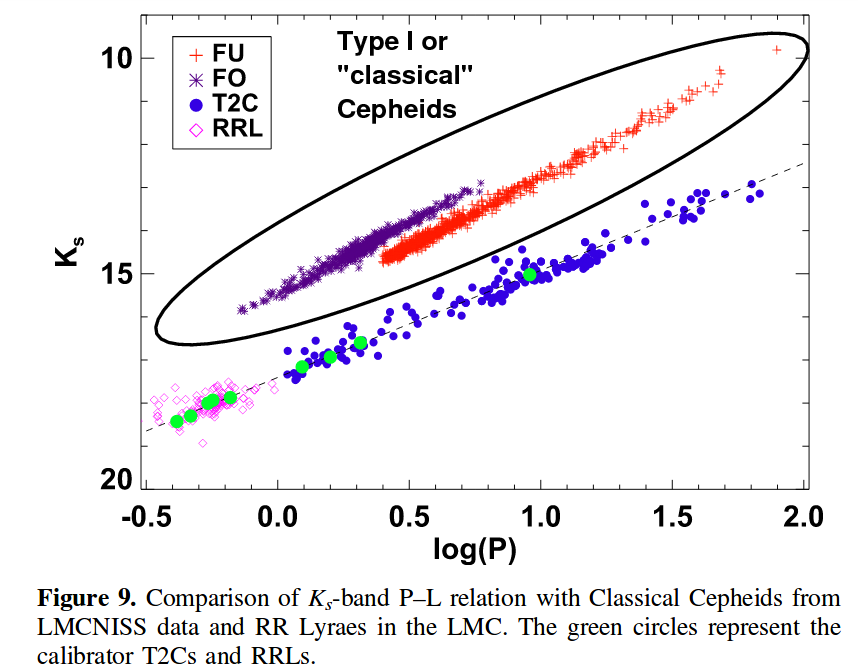
Taken from Figure 9 of
Bhardwaj et al., AJ 153, 154 (2017)
              Q:  What is the range in periods of these Cepheids?


              Q:  What is the range in magnitudes of these Cepheids?
                      Translate that to a range in luminosities (a factor
                      of 10 between brightest and faintest?  A factor of 20?)
What makes Cepheids so important is that they are very luminous, and can be seen at large distances; thus, we can use them to measure distances to very distant galaxies.
The one question we need to answer before we can use Cepheids to measure distances to other galaxies is ... "What is the absolute magnitude of a Cepheid star?" If we know the period and absolute magnitude of just one Cepheid, then we can use the linear relationship to determine the absolute magnitude of any other Cepheid.
So, if we could just determine the distance to the LMC, we could figure out the absolute magnitude of Cepheid stars, and then we could use them to measure distances to other galaxies.

This is especially true if one examines the Tip of the Red Giant Branch.
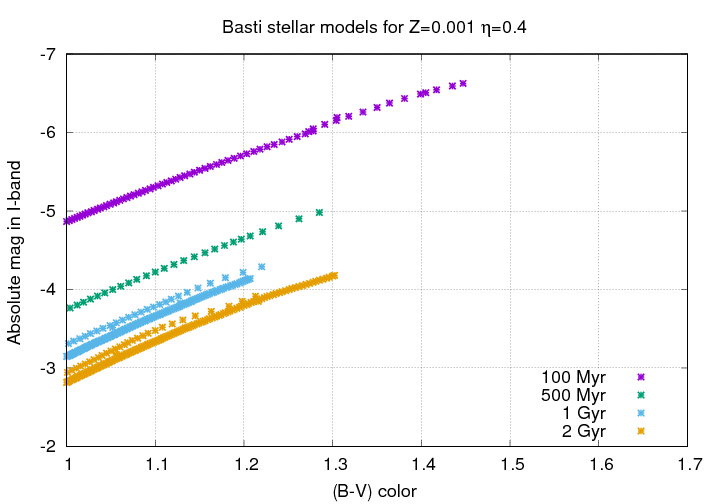
However, once the most massive stars have turned into supernovae or planetary nebulae and disappeared, a curious thing happens to the remaining stars. Over a long stretch of time, from about 0.5 to 10 billion years after a cluster of stars has formed, the evolution of stars of the remaining masses (all relatively low -- perhaps 4 solar masses and lower) brings them all the nearly the same absolute magnitude at the very tip of the RGB.

That means that if we can identify the Tip of the RGB in some galaxy or cluster of stars, we can be pretty sure that it has the same absolute magnitude as the TRGB in any other galaxy or cluster. (This is especially true if one measures the magnitude in the I-band, rather than the V-band).
In other words, the TRGB provides a good standard candle. Moreover, because these red giant stars are so luminous, we can use them to measure distances to very distant galaxies.
The one question we need to answer before we can use the TRGB to measure distances to other galaxies is ... "What is the absolute magnitude of the TRGB?" If we know this absolute magnitude, then we can use it to measure distances to other galaxies.
So, if we could just determine the distance to the LMC, we could figure out the absolute magnitude of TRGB stars, and then we could use them to measure distances to other galaxies.
Do you sense a pattern here?
If we could measure the distance to the Large Magellanic Cloud accurately, then we could use it to CALIBRATE the absolute magnitudes of RR Lyrae, Cepheids, and the Tip of the Red Giant Branch. We could then observe those stars in other, distant, galaxies, and use them to measure distances. We could, in short, investigate the properties of our universe on large scales.
For this reason, the LMC is considered one of the most important rungs in the Cosmological Distance Ladder. Alas, it is too far away for us to detect small shifts in position due to parallax, even with the wonderful Gaia spacecraft. Astronomers have tried a number of different methods to measure this distance, but, until recently, there was still quite a bit of uncertainty.
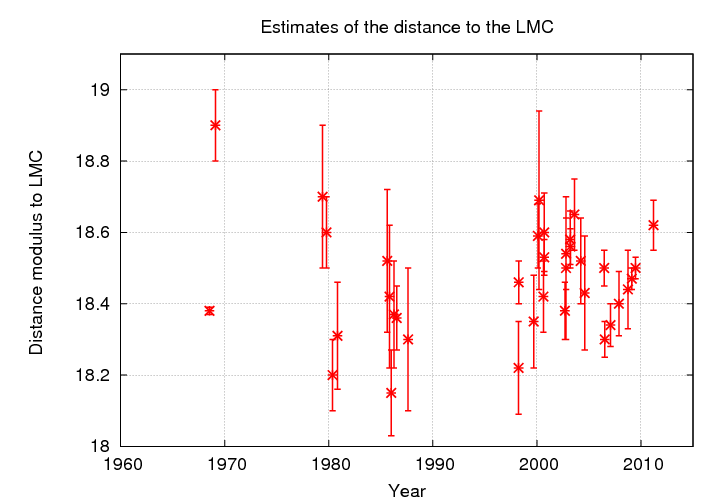
  Q:   Estimate the uncertainty in the distance modulus to the LMC, based on
             the range of these values.


  Q:   How does the uncertainty in distance modulus translate into an
             uncertainty in distance?
Oof. If we start with an uncertainty of +/- 5 percent in the distance to the LMC, then we'll add an uncertainty of +/- 5 percent to the distance of every other galaxy. That could prevent us from distinguishing an accelerating expansion from a plain old constant expansion.
  Q:   Is there some method we could use to measure the distance
               to the LMC more precisely?
Yes, of course: we could use ECLIPSING BINARY STARS. In the past decade, several teams of astronomers have searched for eclipsing binary systems in the LMC, and then followed up using larger telescopes to measure the light curves and spectra of the binaries. One of those groups is based in Poland, and they aren't shy about announcing their result.
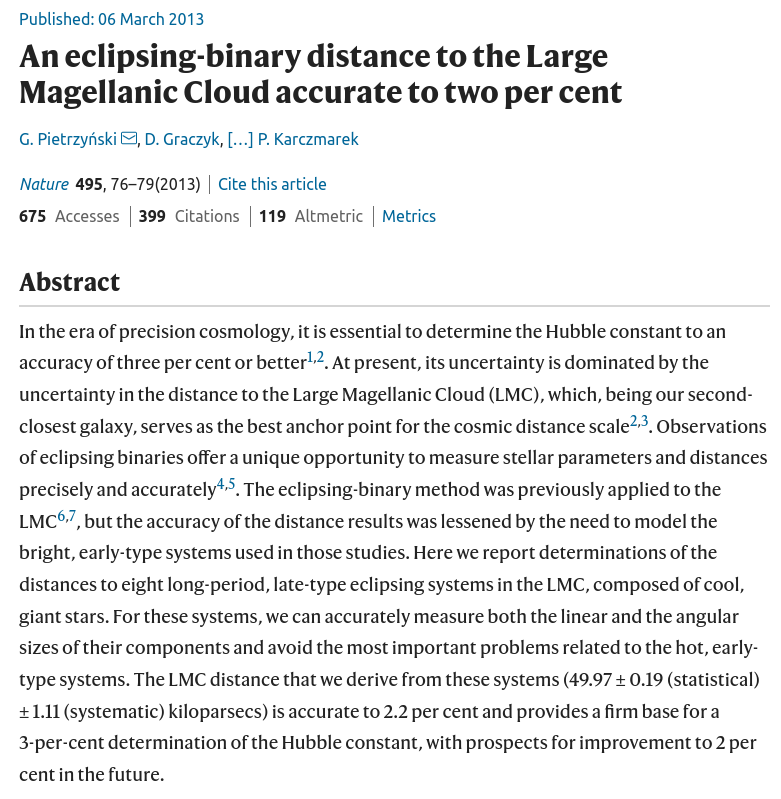
Abstract of the paper
Pietrzynski et al., Nature 495, 76 (2013)
They found 8 promising eclipsing binary stars in the LMC
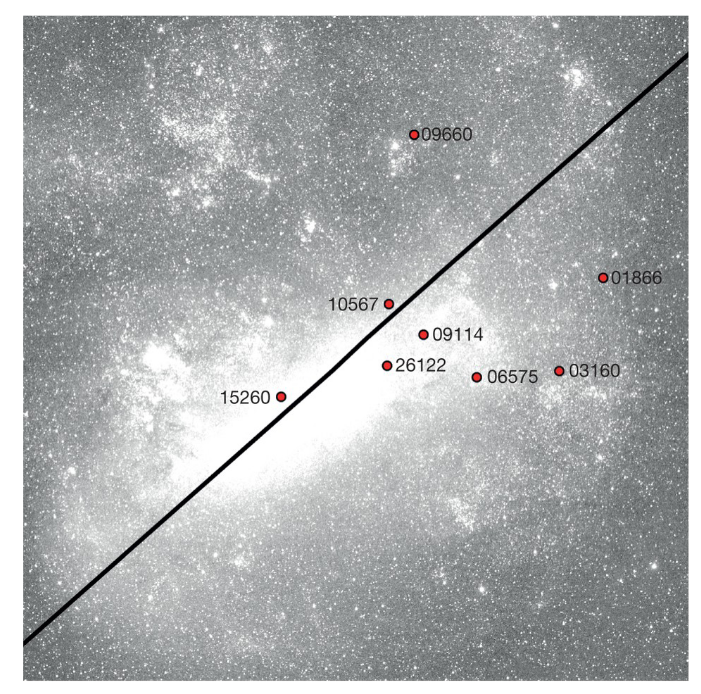
Figure 3 taken from
Pietrzynski et al., Nature 495, 76 (2013)
and measured the properties of each one. Based on the radii and temperatures, they computed the absolute magnitude of each system, and then compared that to the apparent magnitude in order to calculate the distance. Their results for the eight systems have a very small scatter.
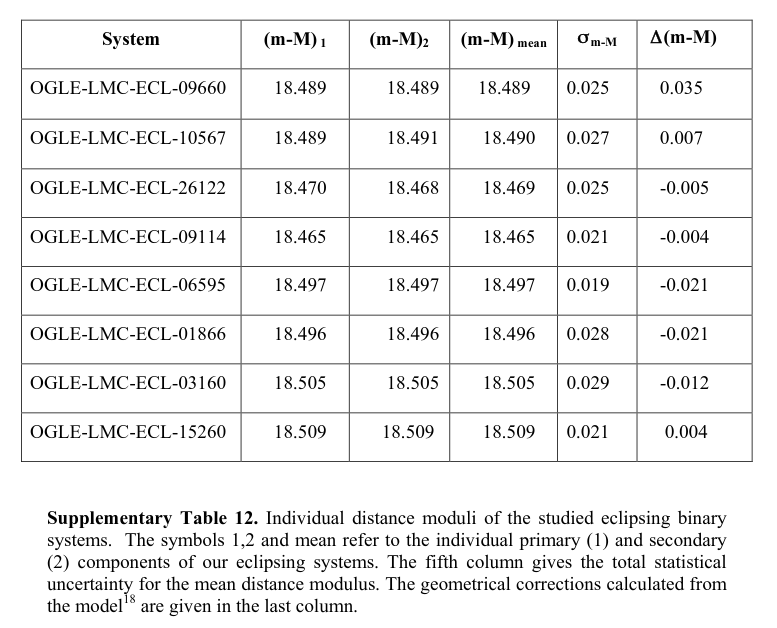
Table 12 taken from
Pietrzynski et al., Nature 495, 76 (2013)
  Q:   Estimate the uncertainty in the distance modulus to the LMC,
             using the standard deviation from the mean of these values.
The team behind this measurement has continued to search for additional eclipsing binaries in the LMC and to observe them very carefully. You can find a good summary of their work at this article -- which is written for a more general audience than the usual technical paper.
By now, they are up to a sample of 20 binary systems.
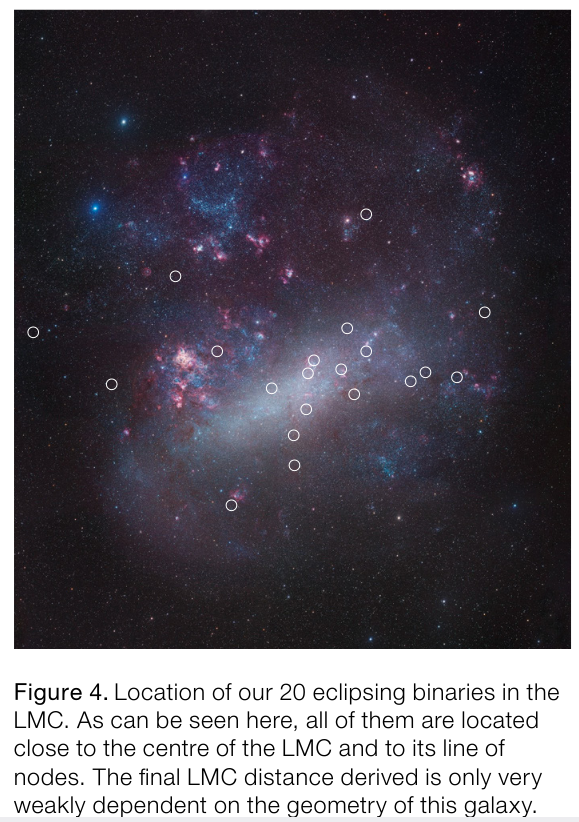
Image courtesy of
Pietrzynski et al., The Messenger, vol. 179, 24 (2020)
 Copyright © Michael Richmond.
This work is licensed under a Creative Commons License.