 Copyright © Michael Richmond.
This work is licensed under a Creative Commons License.
Copyright © Michael Richmond.
This work is licensed under a Creative Commons License.
Let's review the known properties of the universe at large, based on the early measurements of Hubble and other astronomers:
One simple way to explain these observations is to state that the universe is expanding. Or, more accurately, that on very large scales, space is expanding, and carry galaxies along with it like raisins in a loaf of bread.
Click on the picture above to watch the bread rise
Note that, from the point of view of ANY raisin, all other raisins are moving away: there is nothing special about the location of any particular raisin.
Note also that nearby raisins recede relatively slowly, while more distant raisins recede quickly.
  Q:  Does this mean that there is some force pushing
      the distant raisins harder than the nearby ones?
No, there is no such force. There is no difference between the action of the rising bread at one location and the action of the bread in another location: it is puffing up equally fast in every place. The consequence of this sort of uniform expansion, however, is that more distant objects appear to be receding more quickly.
What can we say about the evolution of this expanding universe? Well, in the simplest case, if the ordinary laws of physics apply everywhere throughout the universe, then there is only one force which is important on these intergalactic scales: gravity. The gravitational attraction between galaxies and cluster of galaxies will oppose their motion away from each other. If the gravitational forces are strong enough, they may slow the expansion down to a complete halt, and even reverse the motion into a contraction.

Click on the image above to run an applet showing
evolution of a simple universe
The fate of the universe depends on the amount
of matter within it.
Astronomers use the symbol "Omega"
![]() to describe
the average density of matter in the universe
on very large scales.
As you can see by running the applet above
with different values of Omega,
to describe
the average density of matter in the universe
on very large scales.
As you can see by running the applet above
with different values of Omega,
The critical density of matter required to
permit the universe to continue expanding
can be expressed two ways:
in absolute terms, it's very roughly
10-26 kilograms per cubic meter,
or about 6 hydrogen atoms per cubic meter.
Astronomers often express this in
a normalized way, saying that
the critical density is by definition
![]() .
.
The $64,000 questions were: just what is the actual density of the universe, and how does it compare to the critical density?
Astronomers have tried to figure out the overall density of the universe for a long time. There are two main ways to calculate it.
The first method yields a relatively small matter density. If we were to spread out all the material into a uniform, very thin, gas, it would come to roughly one hydrogen atom per 5 cubic meters. That's nowhere close to the critical density.

The second method indicates that there is much more mass in the universe than we can see directly: we sometimes call this inferred material dark matter. There appears to be very roughly ten times as much dark matter as visible matter! If we include the dark matter, then the overall density is about ten times higher, but still not high enough to close the universe:

So, in the 1980s and early 1990s, the best available evidence suggested that the universe was open, and would expand forever.
During the 1990s, several groups of astronomers devoted a great deal of time and effort to pushing the observations of distant supernovae to new limits. Using fainter and fainter Type Ia supernovae, they were able to measure the distances to galaxies farther and farther away. When they placed their new measurements of distance onto a Hubble diagram (together with the radial velocities of the host galaxies of the supernovae), they found something peculiar: the most distant supernovae did not lie in the expected location.
The figure below is a slightly modified version of the the normal Hubble diagram. Instead of placing the velocity on the vertical axis, it is here on the horizontal axis, expressed in terms of redshift instead of km/s; and, instead of putting distance on the other axis, we have a form of distance modulus.

Graph taken from
Perlmutter et al., ApJ 517, 565 (1999)
The lines you see drawn in this diagram show the expected locations for supernovae for particular models of the universe. If the universe contained only the visible matter we can see, plus the dark matter whose gravitational influence we can detect, the supernovae ought to lie close to the second line from the bottom. But they don't: if you average over the scatter, the most distant supernovae appear just a little bit FAINTER than we expect.
Here's another graph, with a slightly different way of looking at the measurements. Once again, redshift is on the horizontal axis, so nearby objects are on the left, distant on the right. The magnitude of supernovae is on the vertical axis -- note that a positive magnitude (upward) means FAINTER. On this graph, a horizontal line corresponds to the brightness supernovae ought to have if the universe consisted only of the matter (visible plus dark) that we can detect.
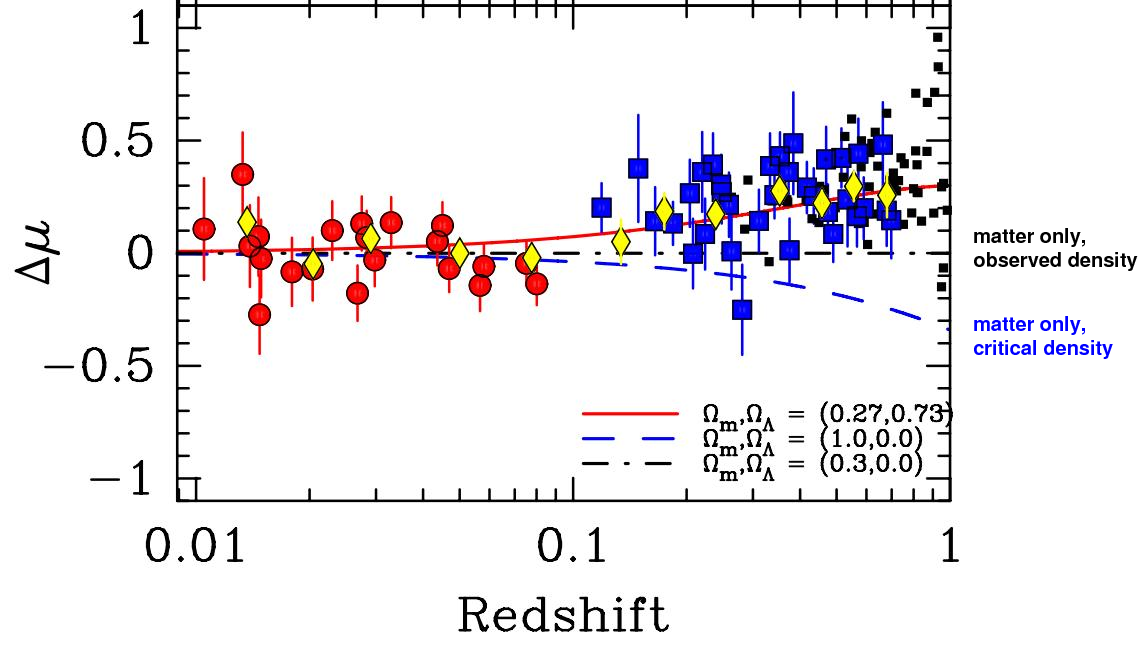
Figure taken from
Freedman et al., ApJ 704, 1036 (2009)
and then modified slightly.
  Q:  Do the measurements of distant supernovae have
      the expected brightness, corresponding to a
      universe consisting of dark + visible matter?
The reason is not clear or obvious. One way to explain it is to say that the supernovae which exploded very early in the universe are slightly fainter than the ones which explode today. We can't rule out this possibility, but we also don't have very strong independent evidence to support it.
Another possibility is that our model of the universe -- visible matter plus dark matter -- may be missing a critical piece. Theorists as far back as Albert Einstein realized that the equations of general relativity permit one to add a cosmological constant to the universe. This mathematical entity, often written with the Green letter lambda, Λ, is outside the bounds of our normal, everyday experience. If it exists, it has the property that it tends to "push space apart", or enhance the expansion of space on very large scales.
Click on the image below to run an applet which shows you how Λ can affect the evolution of the universe.
Thanks to
the Smithsonian Institution.
This cosmological constant has many names: it is sometimes called dark energy, though I don't understand why. Astronomers are currently trying several different methods to figure out what value this mysterious entity might have. One group of astronomers is building a very large electronic camera, with 74 CCD detectors and a total of 570 million pixels. Each exposure taken with this camera will require over 1 GB of storage space!
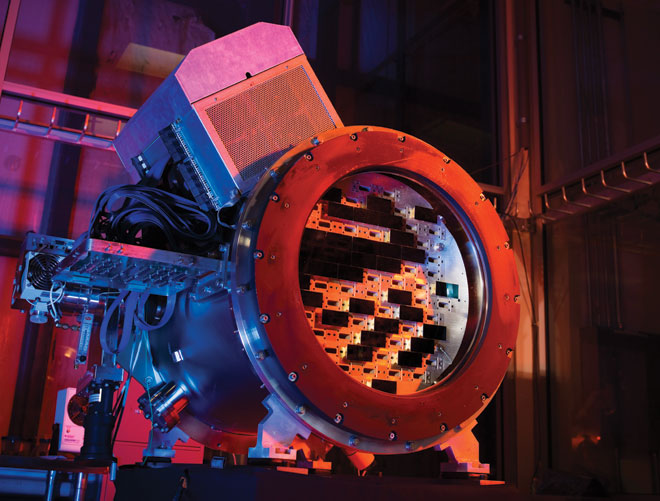
Image courtesy of
University of Pennsylvania
The camera will carry out the Dark Energy Survey (DES for short), sitting inside the Blanco 4-meter telescope on Cerro Tololo, Chile.
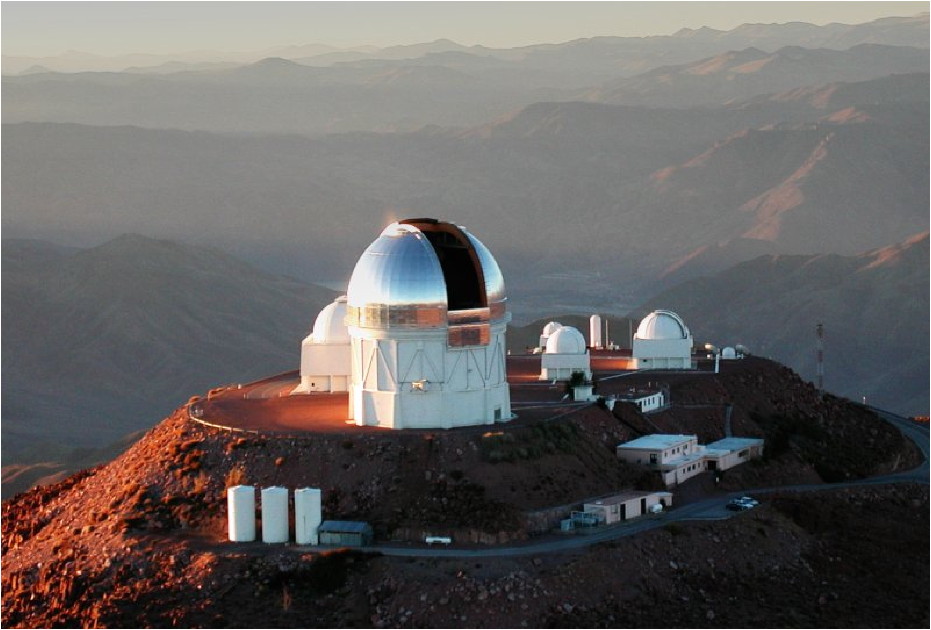
Image courtesy of
Jon Thaler
Using this camera, astronomers will be able to take very deep pictures of a large region of the sky, measuring the properties of hundreds of thousands of galaxies at a large range of distances, and, therefore, sampling the properties of the universe at different stages in its evolution.
Other astronomers are looking at the cosmic microwave background, very faint radio waves coming from all directions. Very long ago, when the universe was young and full of gas -- before any stars formed -- the hot gas emitted lots of visible light. Over the past 13 billion years, as the universe has expanded, this visible light has been stretched to longer and longer wavelengths.
     THEN                               NOW

    visible   -->    infrared  -->   microwave  -->   radio
The WMAP satellite spent 5 years in orbit, measuring these faint microwaves and making a map of the entire sky. If one looks very closely, one can find tiny patches of sky which are slightly warmer or cooler than the average.
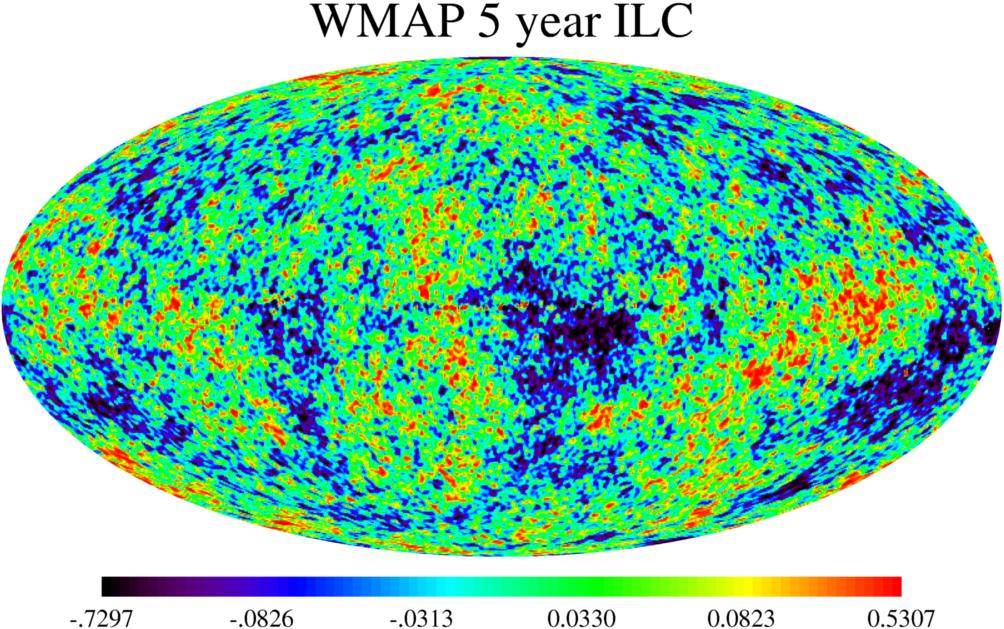
Image courtesy of
NASA and WMAP.
The scale shows the fractional size of the temperature
fluctuations, in hundredths of one percent.
The distribution of these warm and cool spots is related to the lumpiness of matter in the universe long, long ago. Analyzing this data is tricky, but it can tell us quite a lot about the mysterious cosmological constant Λ.
The current evidence suggests that the energy density of the universe consists of roughly
          3  percent   ordinary matter

         24  percent   dark matter

         73  percent      Λ
In other words, we have no idea what most of the universe really is ... and we actually understand only about 3 percent!
The search for Λ is one of the biggest efforts in astronomy today. I don't know how it will turn out, but keep your eyes open!
Below are just a very few of the projects which are focused on improving our knowledge of Λ.
If you want more technical details on the expansion of the universe and the contribution of Λ, you might start with
Copyright © Michael Richmond.
This work is licensed under a Creative Commons License.