 Copyright © Michael Richmond.
This work is licensed under a Creative Commons License.
Copyright © Michael Richmond.
This work is licensed under a Creative Commons License.
In the early twentieth century, the largest telescopes in the world were constructed on Mount Wilson, in southern California.
The 60-inch telescope was built in 1908,
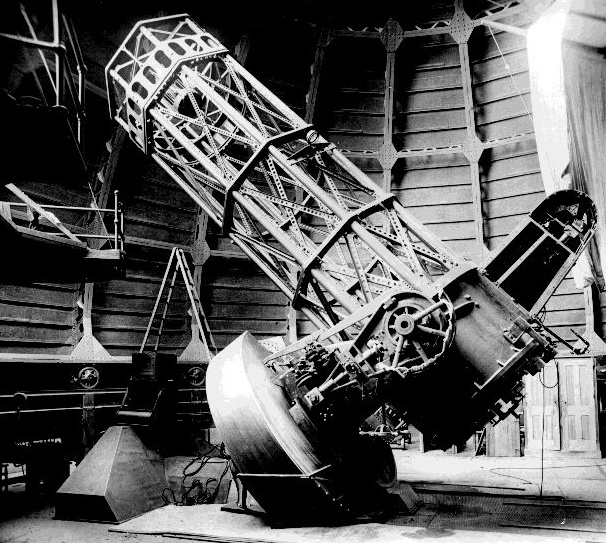
Image courtesy of
Caltech astronomy
followed by the 100-inch telescope in 1917.
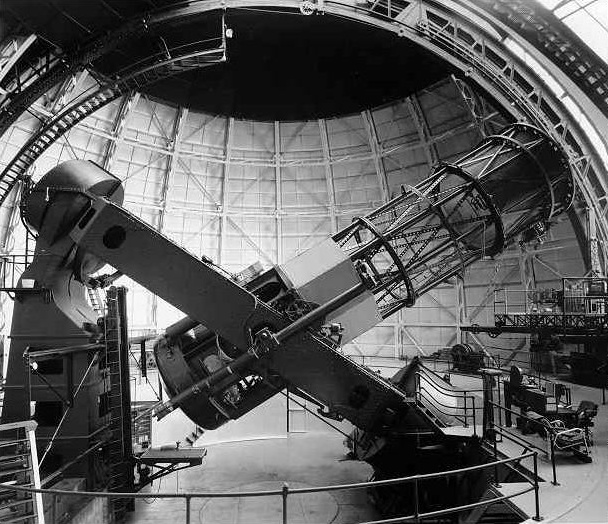
Image courtesy of
Caltech astronomy
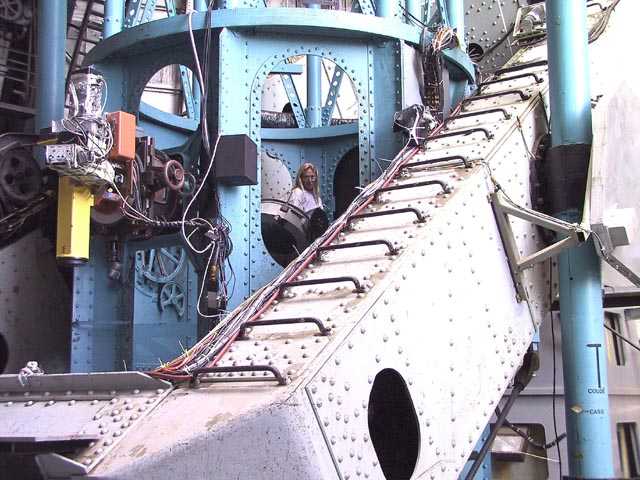
Adjusting the tertiary mirror of the Mt. Wilson 100-inch telescope (thanks to
MWOA Photo Gallery )
Thanks to the collecting area of these big telescopes, and to advances in photographic emulsion, astronomers at Mount Wilson were able to determine the motions of galaxies for the first time, using the Doppler shift their spectral lines.
Measuring these radial velocities wasn't easy. Even nearby galaxies are relatively faint, and, unlike stars, their light is spread out over an extended area. Milton Humason used the 100-inch telescope on Mt. Wilson to obtain a spectrum of NGC 7619 in 1929, which yielded the largest radial velocity ever seen (up to that time): 3779 km/sec away from us. His paper describes the difficulties in an understated manner:
During the past year two spectrograms of N. G. C. 7619 were obtained with Cassegrain spectrograph VI attached to the 100-inch telescope. This spectrograph has a 24-inch collimating lens, two prisms, and a 3-inch camera, and gives a dispersion of 183 Angstroms per millimeter at 4500. The exposure times for the spectrograms were 33[h] and 45[h], respectively.At six hours per night, each exposure took at least five nights!
Even after the spectrum was obtained successfully, measuring its properties was no easy task:
Below are some examples of the spectra acquired by Milton Humason with the 100-inch telescope.
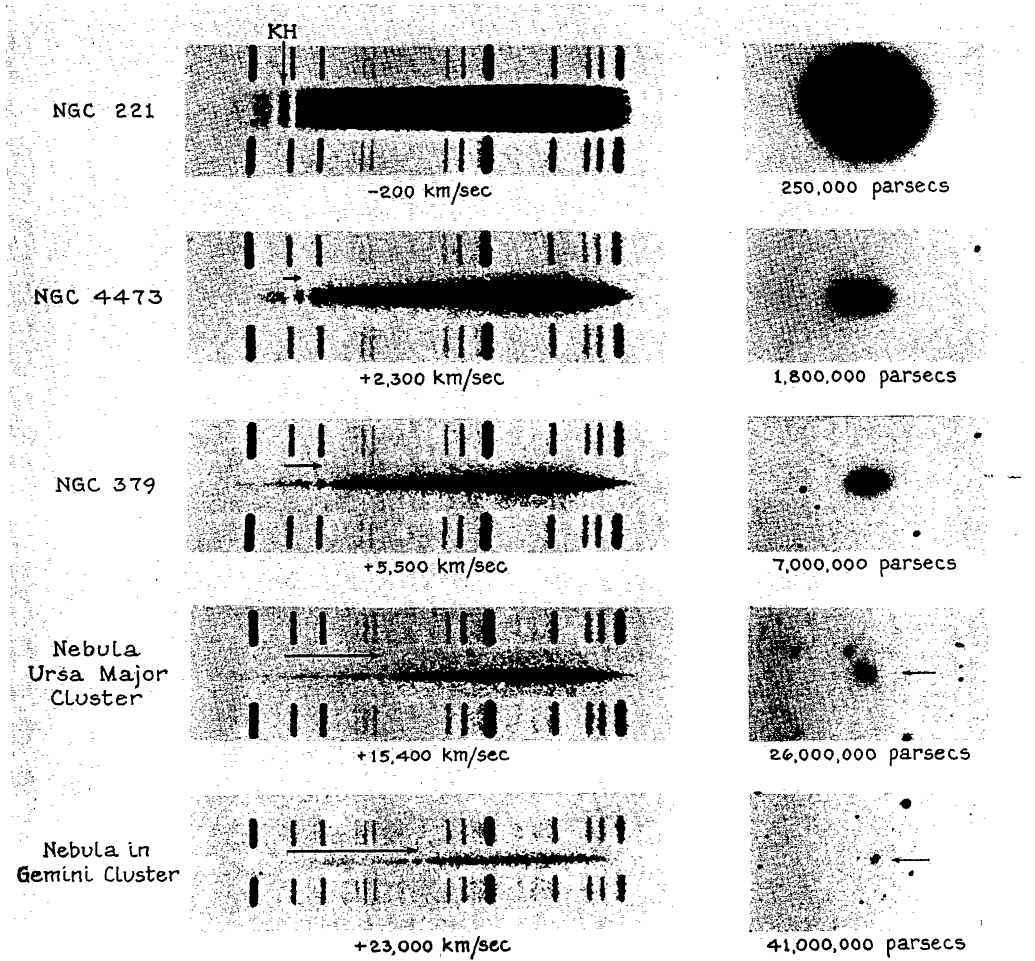
Figure taken from
Humason, ApJ 83, 10 (1936)
Edwin Hubble used the Mount Wilson telescopes to studie galaxies. He photographed nearby galaxies and tried to find ways to determine their distances. In the nineteen-twenties, his best method (and it wasn't a great one) was based on the brightest stars in a galaxy. He assumed that the brightest stars were all of the same absolute luminosity, or standard candles; by comparing the apparent brightness of the brightest stars in different galaxies, he could calculate the distances.
It turns out that Hubble made several errors in his distance measurements; one of the most serious was mistaking compact clusters of many stars and clouds of glowing gas -- HII regions -- for the brightest stars in some galaxies. Although his relative distances weren't bad, his absolute distances were all much too small.
When Hubble plotted the velocities of nearby galaxies against their distances, he found a strong correlation:
Hubble used the slope of the line in this diagram to determine what has become known as the Hubble constant:
                  radial velocity  (km/sec)
       H0   =    --------------------------
                       distance  (Mpc)
  Q:  What is the value of the Hubble constant
      based on Hubble's distance estimates?
Over seventy years have passed since Hubble and Humason first compared the recession velocities of galaxies to their distances. Astronomers no longer use the brightest stars or HII regions in a galaxy to estimate its distance (unless they have no other information at all). Modern equipment unavailable to Hubble (telescopes in space, and CCD detectors) allows us to use Cepheid variables to determine the distances to relatively nearby galaxies. We believe that our modern measurements are more accurate than the early ones.
  Q:  What is the value of the Hubble constant
      based on these recent measurements?
As we shall see tomorrow, these nearby galaxies are a little TOO close to serve as accurate markers of the expansion of the universe. Nonetheless, it is clear that the modern value of the Hubble constant is much smaller than the original version.
One simple way to explain these observations is to state that the universe is expanding. Or, more accurately, that on very large scales, space is expanding, and carry galaxies along with it like raisins in a loaf of bread.
Click on the picture above to watch the bread rise
Note that, from the point of view of ANY raisin, all other raisins are moving away: there is nothing special about the location of any particular raisin.
Note also that nearby raisins recede relatively slowly, while more distant raisins recede quickly.
  Q:  Does this mean that there is some force pushing
      the distant raisins harder than the nearby ones?
No, there is no such force. There is no difference between the action of the rising bread at one location and the action of the bread in another location: it is puffing up equally fast in every place. The consequence of this sort of uniform expansion, however, is that more distant objects appear to be receding more quickly.
Copyright © Michael Richmond.
This work is licensed under a Creative Commons License.