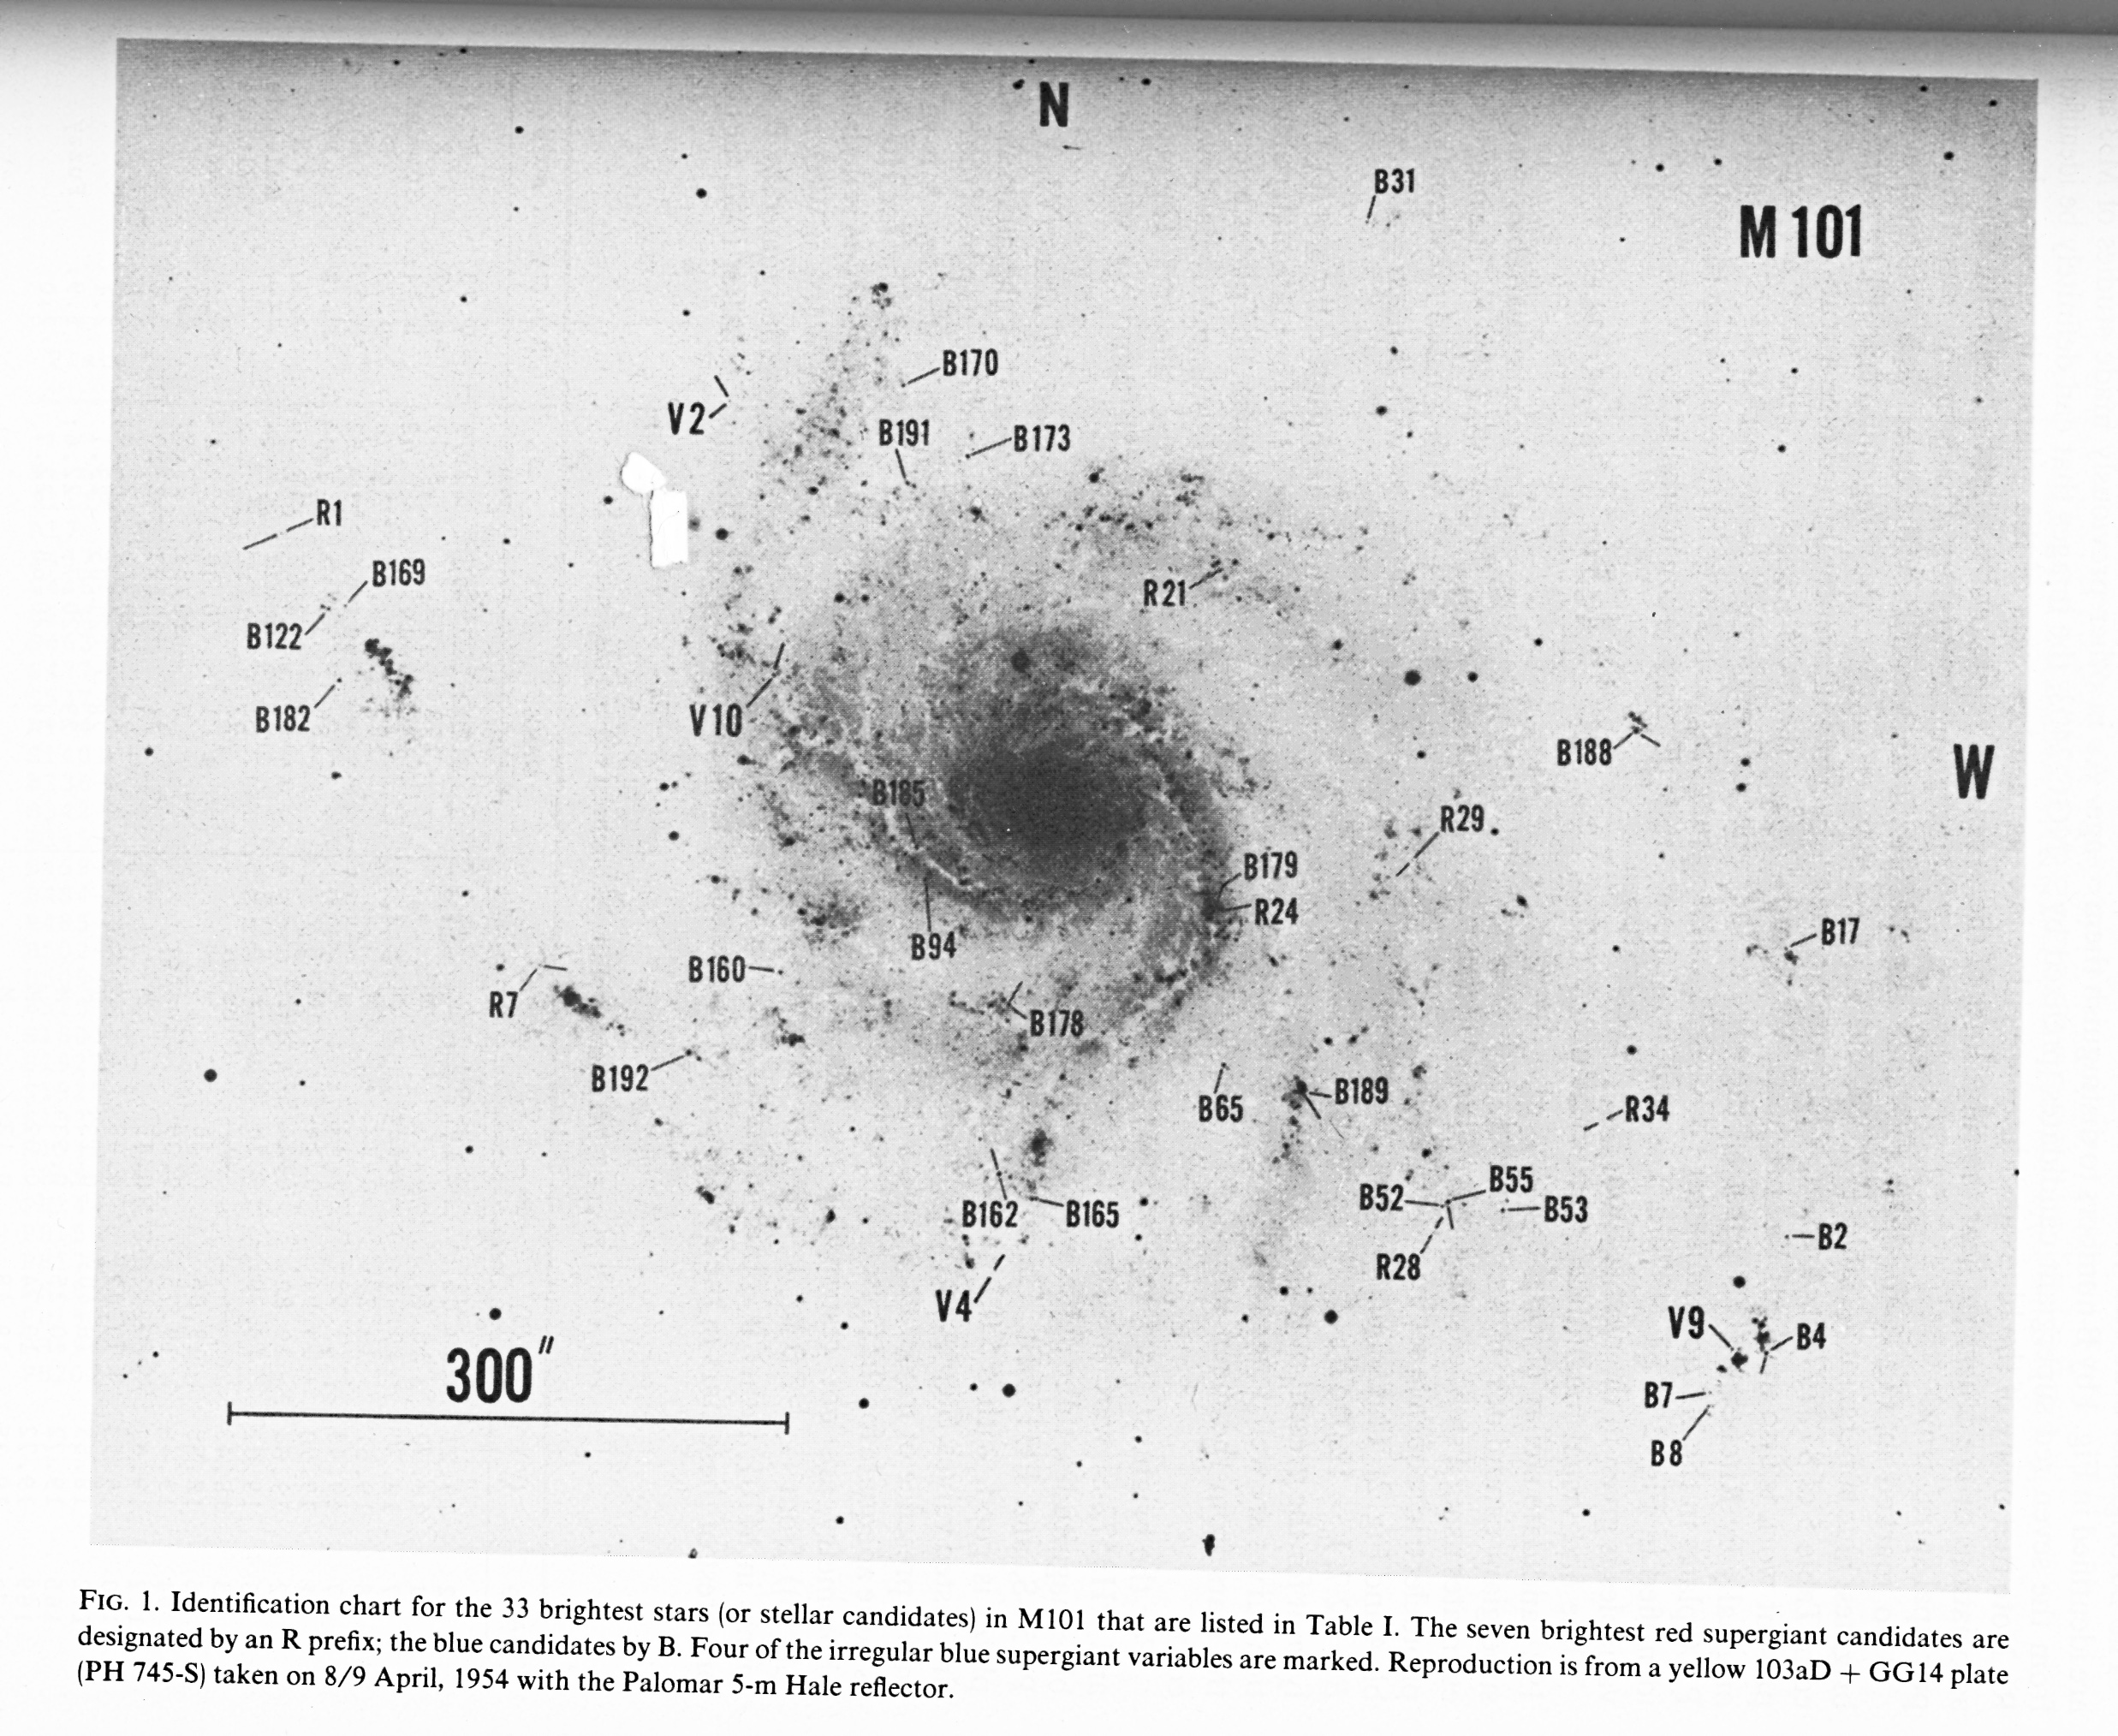
Figure taken from Sandage, AJ 88, 1569 (1983)
Edwin Hubble led the study of galaxies beyond the Milky Way in the decades after World War I. His paper A Relation between Distance and Radial Velocity among Extra-Galactic Nebulae, published in 1929, established the observational basis for the expansion of the universe. If one reads the paper, however, one will find that the value Hubble placed to this relationship between distance and velocity -- which we now call the Hubble constant in his honor -- was roughly 500 km/sec/Mpc. A scan of the current literature, roughly 80 years later, shows a much smaller value: around 70 km/sec/Mpc. Why was Hubble's original value so much larger?
This parameter is derived from measurements of the radial velocities of galaxies (the Doppler shift of their spectra) and their distances. The radial velocities measured in Hubble's time were fine; it is the distances to other galaxies which are to blame. The galaxy M101, for example, is listed in Table 1 of Hubble's paper at a distance of 0.45 Mpc. Recent measurements by a variety of techniques (see Shappee and Stanek, ApJ 733, 124 (2011) for a review) suggest that the distance is about 6.6 Mpc, a factor of almost 15 times larger.
This large discrepancy is due to the lack of information available to Hubble. Photographs taken with the 60-inch and 100-inch telescopes at Mount Wilson did not detect most of the objects we use today to estimate distances: Cepheid variable stars, planetary nebulae, the tip of the red giant branch, to name a few. Astronomers in Hubble's time could distinguish only a small set of discrete sources in other galaxies: HII regions and the very brightest individual stars. Or, to be more accurate, compact sources which were identified as the "very brightest individual stars" ... but were, in almost all cases, compact clusters of many stars.
Let's take a look at some of the objects Hubble identified as these "brightest stars" in the galaxy M101, and examine them in a way that he could not: using high-resolution images taken by the Hubble Space Telescope.
Hubble's own published papers provide few details to his study of stars in M101. His only papers which mention M101 specificially, as far as I can tell, are
These papers provide little more than values for the distance to M101 and the absolute magnitudes of the brightest stars in it, from which one can derive their apparent magnitudes: around 17.
In order to find a list of the objects themselves, one must skip forward many years, to papers published by other astronomers. Allan Sandage, Hubble's successor in many ways, provides a list of candidates in M101 in
The figure below is a scanned version of one of the plates from this paper. Click on the image for a larger version, which includes a scale, directions, and a caption.
Figure taken from
Sandage, AJ 88, 1569 (1983)
There are also observations of some of these candidates in a set of papers written by Roberta Humphreys, Marc Aaronson, and their coworkers.
I'll be using images taken by the Hubble Space Telescope to examine in detail some of the "brightest individual stars" identified by Hubble. There are a wealth of images of M101 = NGC 5457 taken by HST, with many different instruments; you can use the HST search form at MAST to locate and access them. I'll use only a tiny fraction of the available data: images taken with the Advanced Camera for Surveys (ACS) through the F435W filter, which is similar to the Johnson B filter. The spectral response of these images should be somewhat similar to that of the blue-sensitive photographic plates that Hubble used.
The particular images I will use are part of a dataset collected under the auspices of Proposal ID 9490, Stellar populations in M101: X-ray binaries, globular clusters, and more , submitted by Kip Kuntz. I chose the F435W images of three fields in M101, and median-combined two or three individual drizzled images of each field to create a clean picture. The plate scale of these images is roughly 0.05 arcseconds per pixel. Unresolved point sources have a Full-Width at Half Maximum (FWHM) of about 2.4 pixels, or 0.12 arcseconds, and the faintest sources have magnitudes of (at a rough guess) at least V = 25. For comparison, most of Hubble's photographs had a FWHM between 1.0 and 2.0 arcseconds (see The Surface Brightness of Threshold Images , ApJ 76, 106 (1932)), and a limiting magnitude of perhaps V = 19 or 20.
Since I'm only using the B-equivalent HST images, I'll discuss below only the brightest BLUE stars mentioned by Hubble. He also analyzed the brightest RED stars in M101, but I shall leave them for another time.
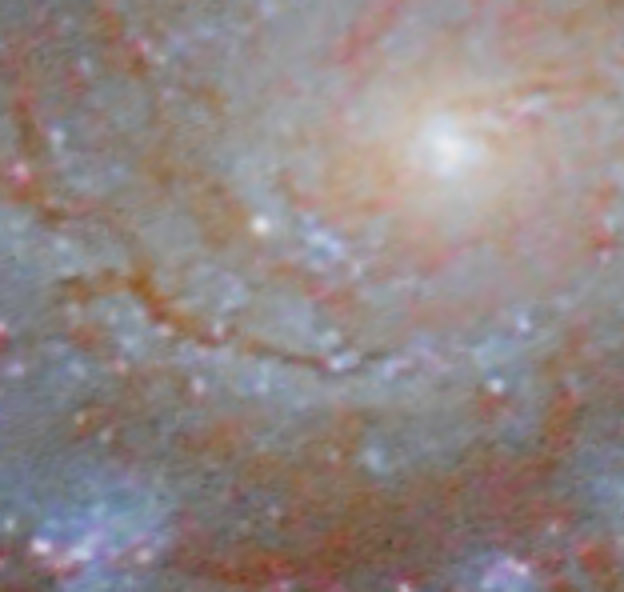
One can find a very nice, and VERY large, color composite image of M101 which combines data from HST with ground-based data from the CFHT:
However, I won't use this image in my discussion below because the individual HST images will have slightly higher resolution, and because I understand better the processing which has been applied to them. But you might grab a copy of the pretty composite image to do your own comparison.
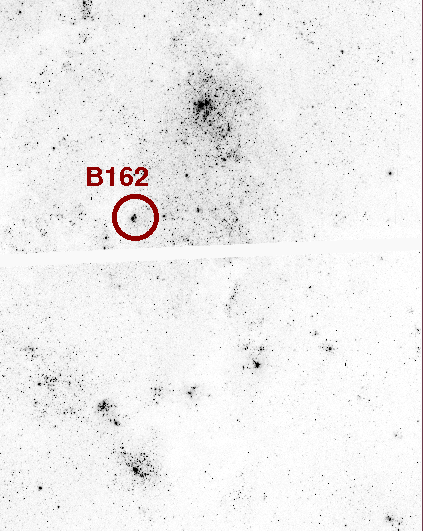
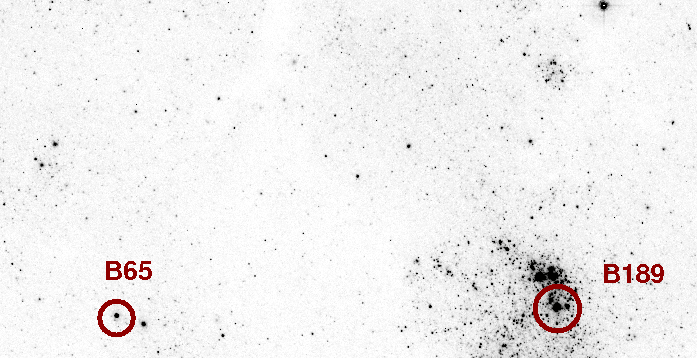
In order to identify the sources used by Hubble, it will be convenient to have a modern image with roughly the same properties as the photographic finding charts. I've chosen an image of M101 taken by Rick Johnson as a guide. This very nice picture has a FWHM of about 3 or 4 arcseconds, and shows the colors of features in M101. I've added some boxes to act as guides to finding some of Hubble's "brightest stars".
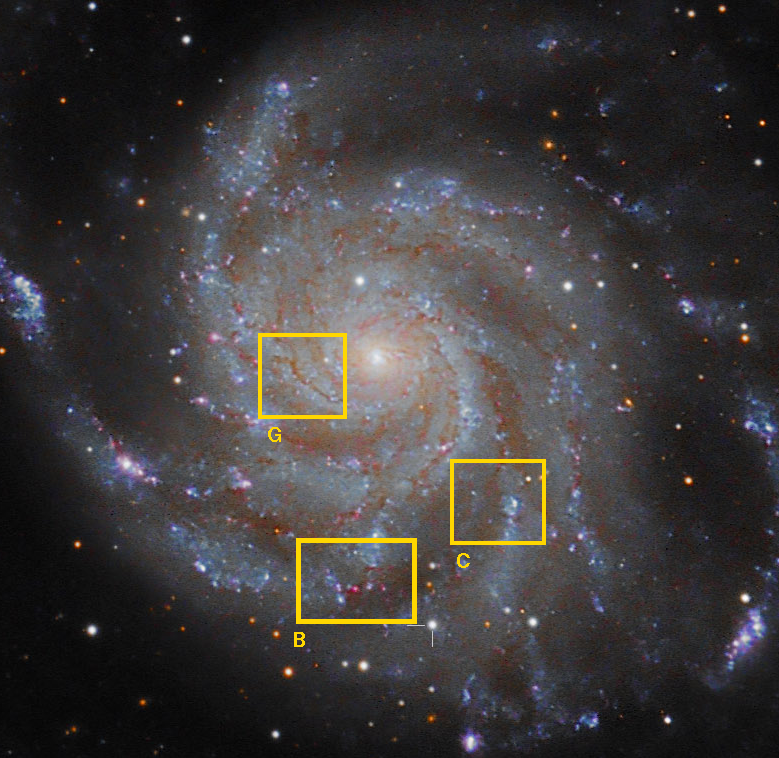
Image courtesy of Rick Johnson
The identification chart from Sandage (1983) can be matched up to box "B" from the Johnson color image.
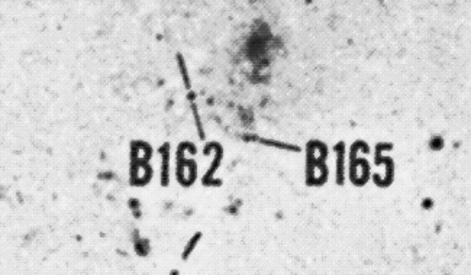
If we rotate the chart about 20 degrees counterclockwise, it's easier to compare to an image taken by HST.
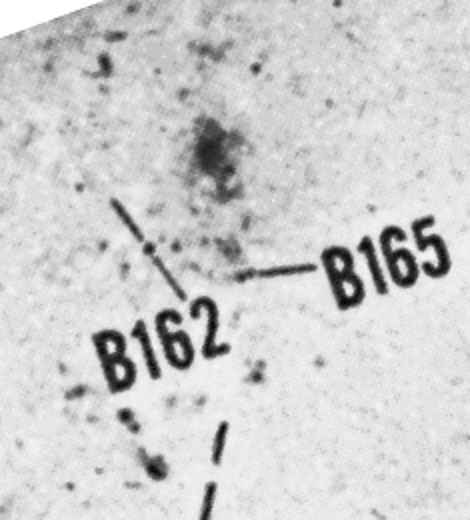
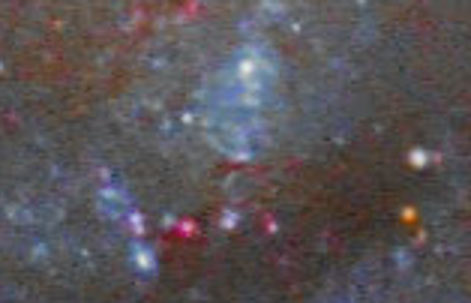
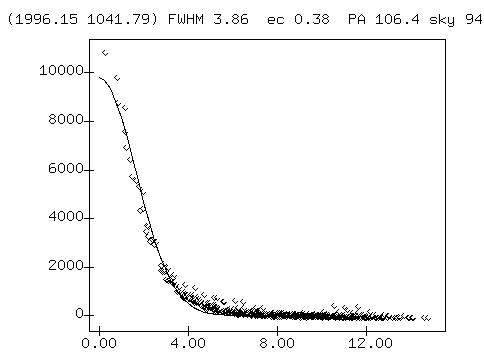
The candidate B165 is, alas, not visible in the HST image because it falls into the small region between the camera's detectors. B162 is easy to recognize in the HST image. It is clearly a cluster of stars, not a single star. Note that its FWHM, about 3.86 pixels, is significantly larger than that of an unresolved point source, which would be about 2.4 pixels.
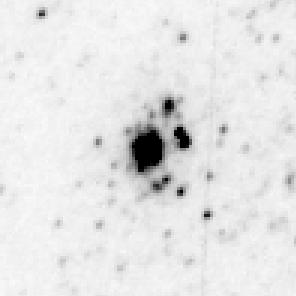
The HST closeup picture above is 100x100 pixels, corresponding to 5x5 arcseconds.
The identification chart from Sandage (1983) is easy to match up with box "C" from the Johnson color image.
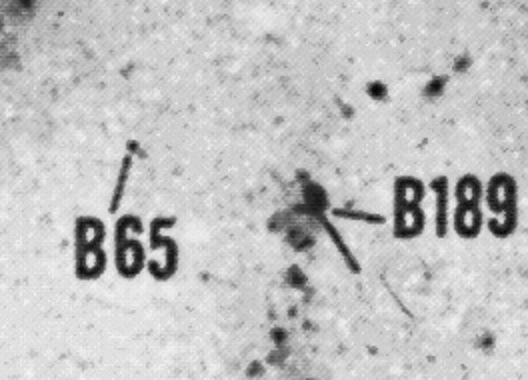
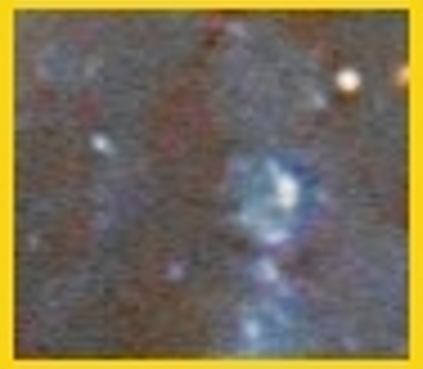
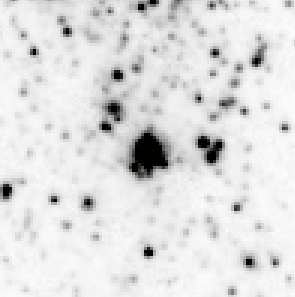
An HST ACS image taken in the F435W filter (roughly equivalent to B) shows that B65 really is a single point source, but B189 is a mix of several stars within a cluster.
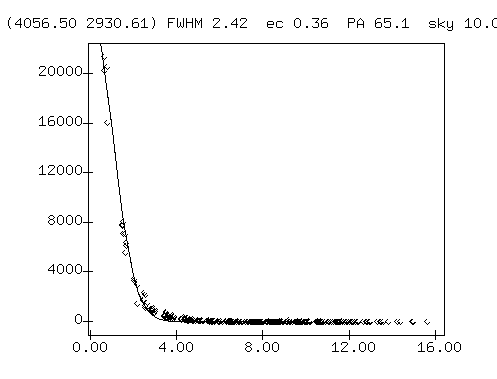
Closeups of the two candidates are shown below. Each panel shows 100x100 pixels, which corresponds to 5x5 arcseconds. The radial profile of B65 shows a nice gaussian with FWHM 2.4 pixels, which is unresolved,
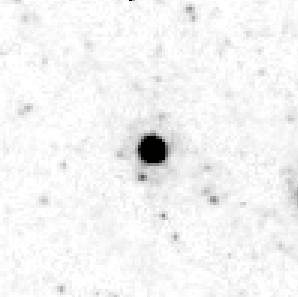
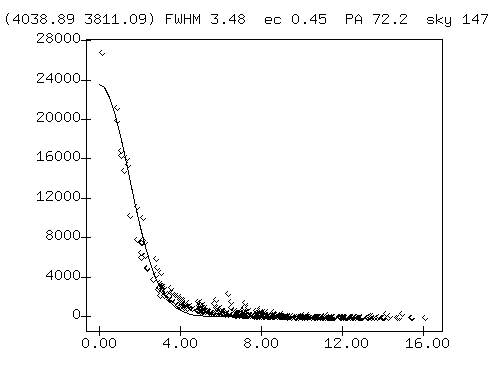
... but the profile of B189 shows it to be wider, and hence unresolved. You can see that it doesn't look as clean as B65 in its closeup.
Compare the color ground-based view to the chart of Hubble's objects.
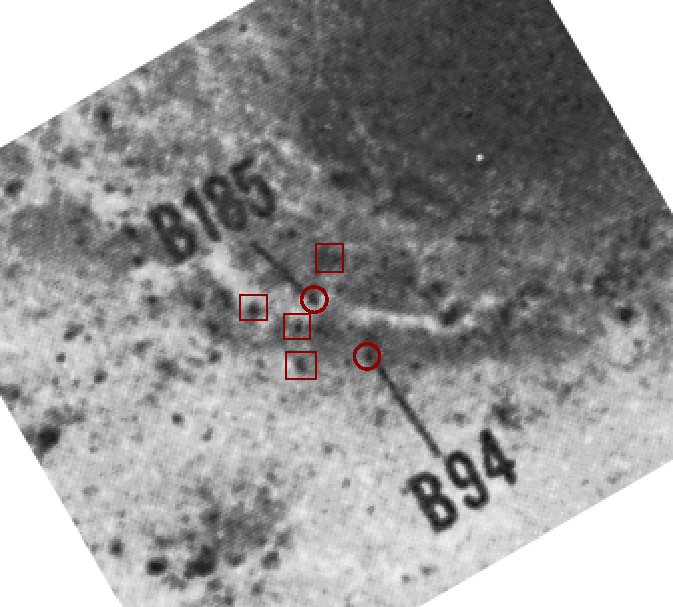
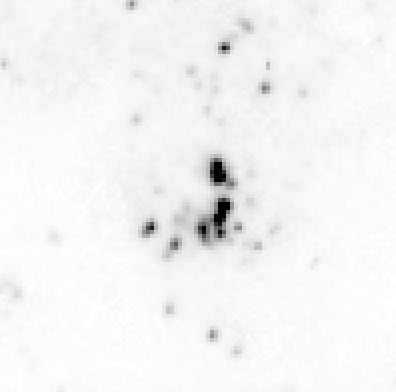
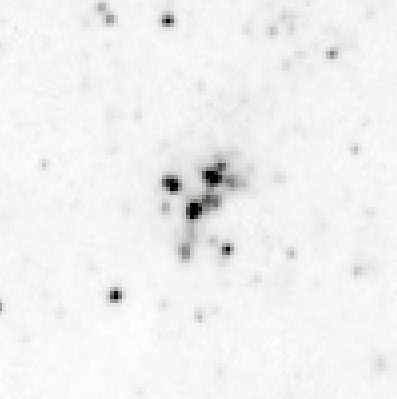
The Hubble Space Telescope shows clearly that both B185 and B94 are clusters of stars, not single objects.
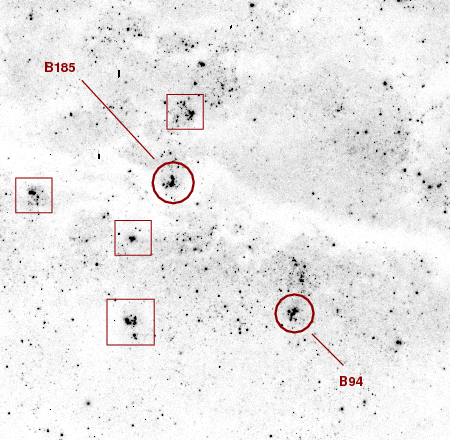
Below are closeups of B185 (left) and B94 (right) from HST images. Each panel shows 100x100 pixels, which corresponds to 5x5 arcseconds.
I examined in detail five of the "brightest blue stars" in M101 used by Hubble to estimate its distance.
Only the source labelled "B65" turned out to be a single object. However, As Humphreys and Aaronson describe in The visually brightest early-type supergiants in the spiral galaxies NGC 2403, M81, and M101, spectra of this object reveal that, while it is a star, its motion shows that it doesn't belong to M101. The radial velocity of M101 is about 240 km/sec away from the Sun, but the radial velocity of B65 is 255 km/sec toward the Sun. It must be a very distant member of our own Milky Way, or some other member of our Local Group.
Humphreys and Aaronson found that of the eight of Hubble's candidates for which they acquired spectra, five turned out to be multiple stars or clusters, two had radial velocities inconsistent with M101, and one was a luminous blue variable star. None were individual blue stars with a constant brightness.
This should not surprise us now, given our current distance to M101. The brightest blue (constant) supergiants in local galaxies have absolute magnitudes of about M(V) = -8 (see, for example, Quantitative Spectroscopy of Blue Supergiant Stars in the Disk of M81: Metallicity, Metallicity Gradient, and Distance ApJ 747, 15 (2012)). We believe the distance to M101 is about 6.6 Mpc, equivalent to a distance modulus of (m-M) = 29.1. So we would expect the most luminous blue supergiants in M101 to have an apparent magnitude of about m(V) = 21, or greater if there were any appreciable reddening. Recall that Hubble's photographic plates had a magnitude limit of roughly m(V) = 20, and, as Hubble himself noted, somewhat brighter for object superimposed upon the background of a galaxy:
The sloping line to the right in Figure 10 represents the limits of the observations, for, from a study of the plates themselves, it appeared improbable that stars fainter than about 19.5 could be detected with certainty on a nebulous background.
From Hubble, ApJ 64, 321 (1926) , p. 359
In short, the instruments available to Edwin Hubble prevented him from making accurate measurements of the brightest stars in galaxies beyond the Local Group. His candidates for "brightest single stars" in other galaxies were actually clusters of stars, and so the distances he derived were much smaller than the actual ones.
     Suppose we know in the Milky Way that the brightest blue
     stars have an absolute magnitude of

            M(V) = -8           (a single luminous star)

     If we see an object in M101 which we THINK is a single
     blue star, with an apparent magnitude of m(V) = 17.0,
     then we derive

            distance modulus  (m - M)  =  17.0 - (-8)  =  25

     from which we can compute the distance

            (m - M) = 5 log(d) - 5    -->   d = 1 Mpc


     But, if that object is actually a cluster of many luminous
     blue stars with an absolute magnitude

            M(V) = -12           (a cluster of luminous stars)

     then the actual distance modulus will be

            distance modulus  (m - M)  =  17.0 - (-12)  =  29

     from which we can compute the distance

            (m - M) = 5 log(d) - 5    -->   d = 6.3 Mpc