 Copyright © Michael Richmond.
This work is licensed under a Creative Commons License.
Copyright © Michael Richmond.
This work is licensed under a Creative Commons License.
As you have already seen, one can use relatively simple arguments and mathematics to find
It seems reasonable to attempt to apply similar logic to determine the locations of the bright spots in the pattern. After all, if we simply arranged for destructive interference between pairs of mini-sources to find the dark spots, surely we can switch to looking for constructive interference, and end up with bright spots -- can't we?
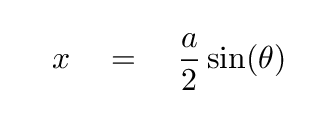
Let's see. If we pick two mini-sources in the slit which are a distance a/2 apart, then the extra distance travelled by one of the light rays will be
We found the locations of the DARK spots by setting this extra distance x equal to one half, or three halves, or (N + 1/2), times the wavelength of the light, leading to destructive interference.
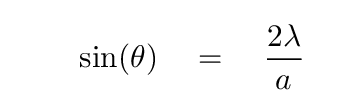
Well, if we want to find BRIGHT spots, then we need constructive interference, right? In that case, we ought to make this extra distance equal one extra wavelength (or two extra, or N extra), right?

That would lead us to conclude that we ought to see the first bright spot at an angle
But ... that's not correct. In fact, this angle is the location of the SECOND DARK spot, not the first bright spot.
What's going on?
The problem is that the situation is more complicated than our initial approach suggested. If we don't look at special pairs of mini-sources inside the slit, but instead properly account for the interactions of each mini-source with every other mini-source, we end up with an integral which yields the intensity of light at any angle:

where the angle θ is hidden inside a new quantity

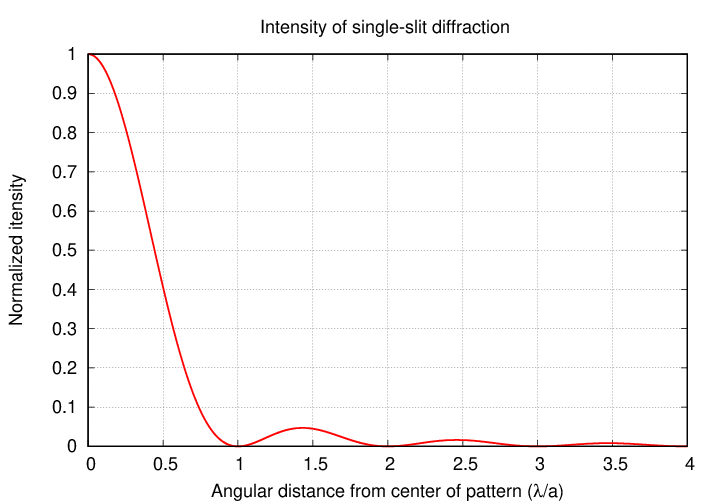
Let's look at how this intensity behaves as we move from the very center of the diffraction pattern, at θ = 0, to positions farther and farther to the side.
At the very center, when θ = 0, it must also be true that sin(θ) = 0, and therefore β = 0, and of course β/2 = 0. At first glance, this would appear to cause the intensity to be undefined, mathematically; after all, one can't divide by zero, right?
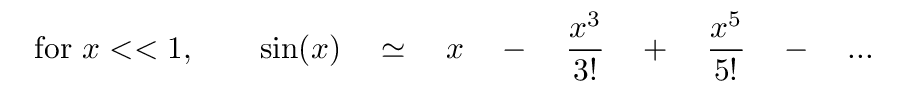
Fortunately, the numerator of our expression for intensity has a factor of sin(β/2). This special combination of the sine of a quantity, divided by that same quantity, is called the sinc function. Suppose that the argument does approach zero; instead of giving up, we can instead expand the sine function using a Taylor expansion:
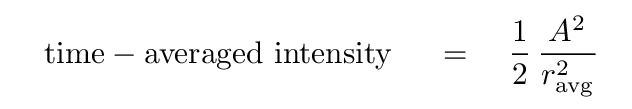
That means if we apply our equation for time-averaged intensity to the center of the screen, the sinc(β/2) function will yield
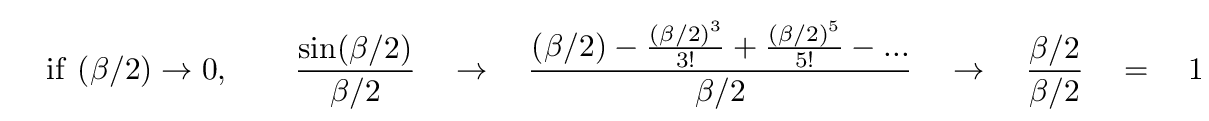
In other words, we'll see a bright spot at the center with intensity
I know that our goal is to figure out where the bright spots appear, but it will help if we can first look (once more) at the locations of the dark spots. Let's examine the full equation for time-averaged intensity -- where can it equal zero?
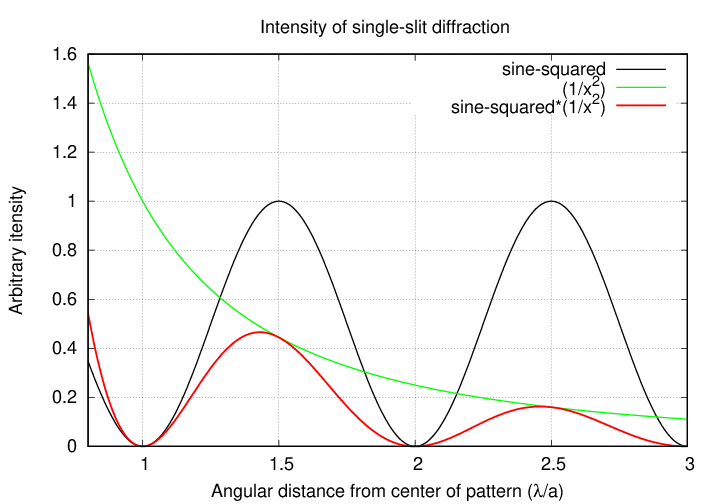
Well, if we eliminate the trivial case of A = 0, the only way that this intensity can equal zero is if the top portion of the fraction is equal to zero. In other words, we'll see a dark spot if
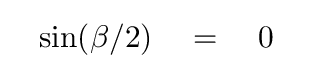
That can happen only if
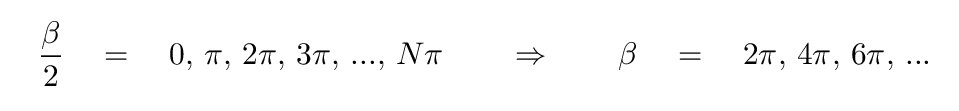
which, in turn, allows us to figure out the values of sin(θ) at which dark spots will appear:
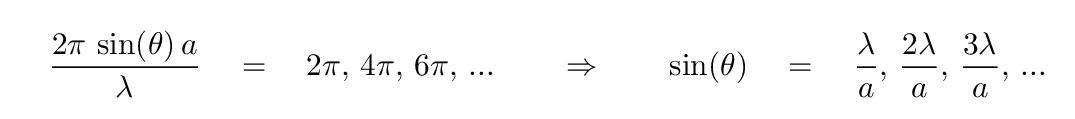
If we compute the time-averaged intensity of a diffraction pattern and express the angular distance (in radians) in terms of the ratio of wavelength to slit width, (λ/a), we see that the dark spots really do fall at these locations.
Finally, we are ready to ask the question, "Where can we find the bright spots in a single-slit diffraction pattern?" Since we know where the dark spots appear,
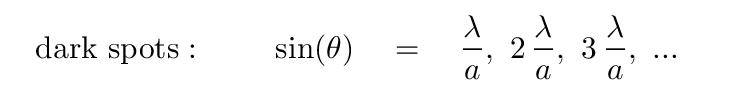
we might make a reasonable guess that the bright spots appear exactly halfway between the dark spots.

But, if we look carefully at the values provided by the general formula, we see that the bright peaks do NOT appear exactly half-way between the dark zeroes.
Instead, the bright spots are located a bit closer to the center of the pattern than the half-way points. What's going on?
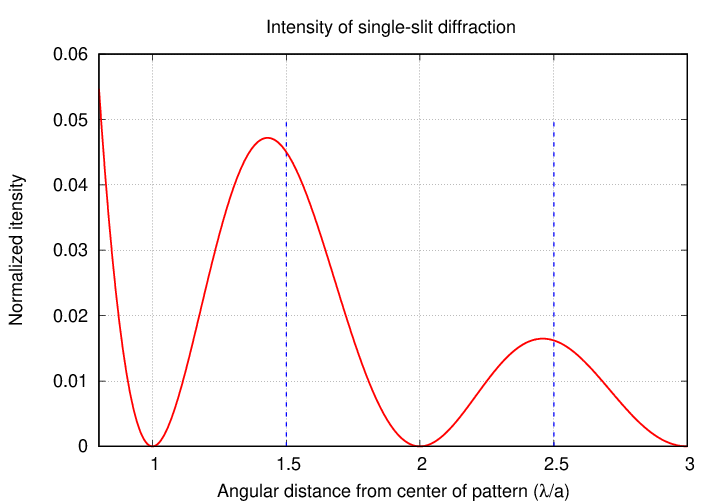
The answer is that our general expression for intensity includes two factors. First, there's a sine-squared term, on top; if that were all, then the maximum intensities WOULD fall mid-way in between the dark spots. However, the expression also includes an x2 term, on the bottom. Let's plot those two factors independently, as well as their product.
As the graph above shows, multiplying these two factors together "pulls" the peaks to slightly smaller angular values, closer to the center. The amount by which the peaks are "pulled" depends upon the slope of the (1/x2) term: the steeper the slope, the larger the displacement of the peak. As one moves away from the center of the pattern, this slope becomes more gentle, and, as a result, the locations of the peaks slowly creep toward the points mid-way between the dark spots.
                   angular distance away from center
                         in units of (λ/a)

  Bright spot       naive guess        actual location
------------------------------------------------------------------
      1                1.5                 1.430298

      2                2.5                 2.459026

      3                3.5                 3.470895

      4                4.5                 4.477411

    ....

     10               10.5                10.490356

------------------------------------------------------------------
This complicated result, in which there is no easy way to compute the locations of bright peaks of a diffraction pattern, is probably why textbooks focus so strongly on the locations of the dark spots ...
Copyright © Michael Richmond.
This work is licensed under a Creative Commons License.