 Copyright © Michael Richmond.
This work is licensed under a Creative Commons License.
Copyright © Michael Richmond.
This work is licensed under a Creative Commons License.
Stars form from dense clumps of molecular gas deep inside a cloud. The clumps shrink down until their centers become hot enough (around 10 million degrees) for hydrogen to fuse together. At that point, the energy generated by fusion pushes their outer layers outwards and halts the contraction. The delicate balance between gravity and gas pressure continues as long as there is hydrogen to fuse in the core. During this long, hydrogen-burning phase of their lives, stars fall on the main sequence of an HR diagram.
It all sounds good so far .... but several questions immediately arise:
We can make a pretty decent estimate to this question by looking at the Sun. Suppose we make a couple of simplifying assumptions:
You can figure out how long the hydrogen will last like this:
Seems like a long time, doesn't it? How does it compare to the age of the Solar System? Are we in danger of waking up tomorrow to find out that the Sun has stopped shining?
Our estimate involves several simplifications. To do the job right, one needs to build a model of a star mathematically. Most models break the star up into a series of thin spherical shells.
Within each shell, the computer keeps track of a number of variables, among which are
The goal is to come up with just the right combination of quantities in each shell; in order for the star to be in equilibrium, each shell must satisfy
Back in the old days, astronomers had to work through all the equations in all the different shells by hand; it took a LONG time, and was extremely boring. Fortunately, we can now just write a computer program to do all the dirty work, and look at the results. Some astronomers have even made it possible for you to run their programs via the Web!
We can use the Stellar Interior Construction Site to generate a model of a star just like the Sun at the time it starts to fuse hydrogen. The model lets us look at the temperature of each shell:

Q:  Is the temperature at the center of the Sun high enough
    to run the CNO cycle?


    (Need a hint?  Click me)
Or the density of each shell:
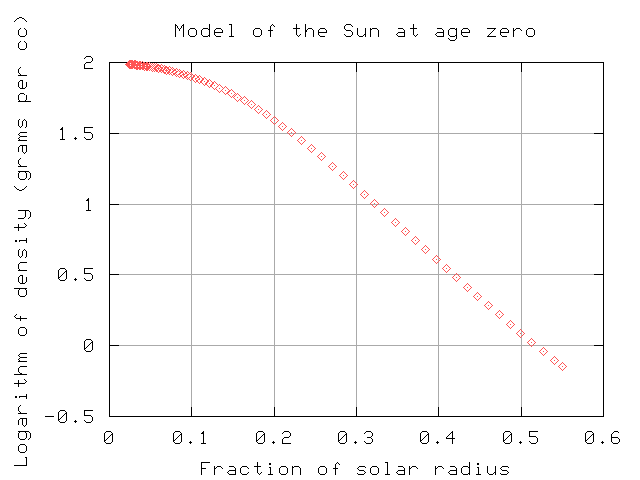
Hey -- check out the density of the shell about halfway out to the edge of the Sun.
Q:  If you could scoop out a blob of gas from that deep
    inside the Sun, and throw that blob into the ocean ...
    would it float or sink?
Okay, so one can make a model which shows the structure of a star when it starts to fuse hydrogen in its core. That's good. But you can also use stellar models to watch the star's properties evolve with time. As time goes by, the innermost regions of a star's core change from mostly hydrogen to mostly helium, which changes the rate at which energy is produced. A whole series of changes ripple outwards through the stellar model as the interior becomes more and more helium rich.
We can't see these changes within the interior of other stars directly, but we can observe the photosphere's temperature and the overall luminosity.
http://www.astro.ulb.ac.be/~siess/pmwiki/pmwiki.php/WWWTools/Isochrones
If you go to Siess's Computation of Isochrones web site and
Additional information
  Mass      Tc        roc        etac    Menv    Renv/R    Tenv        flag
  0.100  4.396E+06  5.321E+02    3.78   0.0000  0.00000   4.396E+06      0
  0.130  5.490E+06  3.372E+02    1.96   0.0000  0.00000   5.490E+06      0
  0.160  6.120E+06  2.484E+02    1.15   0.0000  0.00000   6.119E+06      0
  0.200  6.678E+06  1.826E+02    0.49   0.0000  0.00000   6.677E+06      0
  0.250  7.370E+06  1.422E+02   -0.02   0.0000  0.00000   7.369E+06      0
  0.300  7.807E+06  1.133E+02   -0.41   0.0000  0.00000   7.808E+06      0
  0.400  8.479E+06  7.813E+01   -0.98   0.0237  0.08784   7.851E+06      0
  0.500  8.901E+06  7.153E+01   -1.16   0.2883  0.54073   4.593E+06      0
  0.600  9.537E+06  7.302E+01   -1.25   0.4558  0.61232   3.803E+06      0
  0.700  1.030E+07  7.523E+01   -1.35   0.6057  0.65363   3.222E+06      0
  0.800  1.126E+07  7.835E+01   -1.46   0.7371  0.67965   2.835E+06      0
  0.900  1.232E+07  8.219E+01   -1.56   0.8547  0.69772   2.627E+06      0
  1.000  1.345E+07  8.659E+01   -1.66   0.9722  0.72340   2.302E+06      0
  1.100  1.455E+07  8.963E+01   -1.75   1.0864  0.75981   1.855E+06      0
  1.200  1.603E+07  9.832E+01   -1.85   1.1965  0.81750   1.246E+06      0
  1.300  1.745E+07  1.026E+02   -1.96   1.2995  0.87643   7.524E+05      0
  1.400  1.877E+07  1.027E+02   -2.09   1.4000  0.92522   4.121E+05      0
  1.500  1.974E+07  9.869E+01   -2.23   1.5000  0.96242   1.984E+05      0
  1.600  2.058E+07  9.373E+01   -2.39   1.6000  0.98761   7.253E+04      0
  1.700  2.141E+07  8.955E+01   -2.55   1.7000  0.99140   5.515E+04      0
  1.800  2.232E+07  8.822E+01   -2.70   1.8000  0.99068   5.390E+04      0
  1.900  2.369E+07  9.350E+01   -2.84   1.9000  0.99004   5.362E+04      0
  2.000  2.476E+07  5.130E+02   -1.27   2.0000  0.98780   5.242E+04      1
  2.200  2.523E+07  4.656E+02   -1.41   2.2000  0.98660   5.216E+04      1
  2.500  2.625E+07  3.782E+02   -1.69   2.5000  0.98610   5.109E+04      1
  2.700  2.739E+07  3.086E+02   -1.97   2.7000  0.98580   5.085E+04      1
  3.000  2.692E+07  4.346E+02   -1.58   3.0000  0.98420   5.056E+04      1
  3.500  2.867E+07  4.214E+02   -1.72   3.5000  0.98300   5.029E+04      1
  4.000  2.972E+07  2.322E+02   -2.40   4.0000  0.98460   4.947E+04      1
  5.000  3.483E+07  3.636E+01   -4.50   5.0000  0.99460   1.705E+04      1
  6.000  3.464E+07  2.000E+02   -2.79   6.0000  0.94480   1.825E+05      1
  7.000  3.822E+07  1.860E+02   -3.01   7.0000  0.94200   1.971E+05      1
The final column in this table contains a flag:
Q: What is the maximum mass of a star which can continue
   to fuse hydrogen for at least one billion years?
Using stellar models, one can predict the lifetime on the main sequence for stars of various masses; in other words, the length of time during which they can continue to fuse hydrogen into helium. The results may surprise you -- the most massive stars live the shortest lives:
   initial mass (solar)       lifetime (Myr)
  -------------------------------------------
        0.5                    56000
        1.0                    12000
        2.0                      900
        5.0                       90
One can fit a very rough formula to this relationship:
                                        -2.5
     lifetime           (     mass     )
   ---------------  =   ( ------------ )
   solar lifetime       (  solar mass  )
You can use this formula to estimate the length of time that a star will remain on the main sequence.
Q: Roughly how long will a star of 10 solar masses
   remain on the main sequence?
Why do the most massive star die so soon? Because they use up their fuel much more rapidly than their low-mass cousins. This movie compares the evolution of a high-mass star (15 solar masses) to a low-mass (3 solar masses) star.
   Q:  How much more fuel does the high-mass star
       have at the start of its life?

   Q:  What is the luminosity of the high-mass star?
       What is the luminosity of the low-mass star?

   Q:  How much more energy does the high-mass star
       generate each second?
Now, if you go back to look at the HR diagram of stars in our local stellar neighborhood,
you'll see that there really aren't many stars at the high-mass end. Aha! And that's just what the stellar models predict: the high-mass stars burn through their hydrogen very quickly, so they don't stick around for long.
Now, if you look at the low-mass end of the main sequence, you also see relatively few points. Astronomers believe that low-mass stars are actually formed more frequently than stars like the Sun, and (as you've just seen) they should last a long, long time. So why are there so few observed low-mass stars?
Copyright © Michael Richmond.
This work is licensed under a Creative Commons License.