 Copyright © Michael Richmond.
This work is licensed under a Creative Commons License.
Copyright © Michael Richmond.
This work is licensed under a Creative Commons License.
You are probably familiar with glass prisms: they produce a spectrum by bending light of different wavelengths by different amounts. Astronomers occasionally do use glass prisms in their spectrographs. But they more frequently use diffraction gratings to disperse the light. Gratings are simply pieces of glass or plastic with a fine set of parallel grooves. As light either passes through or bounces off the glass, it separates into a spectrum. The spectrographs you will be using today in class have a thin diffraction grating made of plastic.
If one aims a telescope at a star and passes the collected light through a spectrograph, one ends up with a spectrum: a record of the amount of light at each wavelength.
Here's a very detailed spectrum of the Sun, in which the longest wavelengths are at top left, and shortest at bottom right:
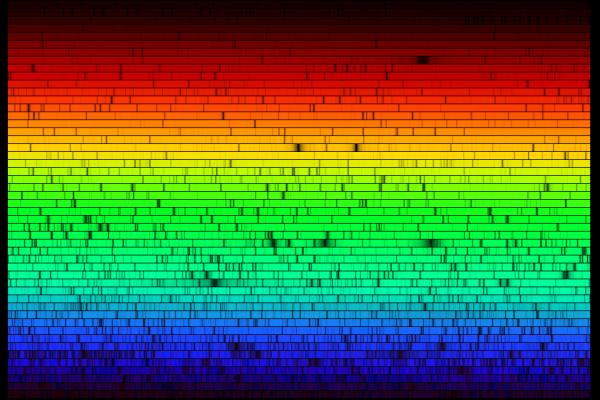
Now, if you're actually at the telescope and looking the spectrum of a star through an eyepiece, you'll typically see a bright background with some dark lines, like this:
Astronomers usually display the same information in a graphical form, plotting brightness on the y-axis and wavelength on the x-axis.
Today in class, you will use simple spectrographs to measure the light from four different sources. Your textbook explains how one can classify spectra from different types of sources:
Can you identfy the mystery gas in class today, based on its spectrum?
On Friday, I will describe how one can use spectra to determine the temperature and chemical composition of a light source.
Copyright © Michael Richmond.
This work is licensed under a Creative Commons License.