 Copyright © Michael Richmond.
This work is licensed under a Creative Commons License.
Copyright © Michael Richmond.
This work is licensed under a Creative Commons License.
If we pass light through a prism or diffraction grating, we can see the intensity as a function of wavelength.
The type of spectrum we see depends on the nature of the source.

![]()
![]()
![]()
Scientists in the nineteeth century quickly figured out that each element generates its own unique set of wavelengths of emission or absorption. For example, compare spectra of hydrogen:

helium:

and carbon:

But why? Was there any underlying reason for each element to generate a unique spectrum? Johannes Balmer studied the optical spectrum of hydrogen and found a pattern in the wavelengths of its emission lines.
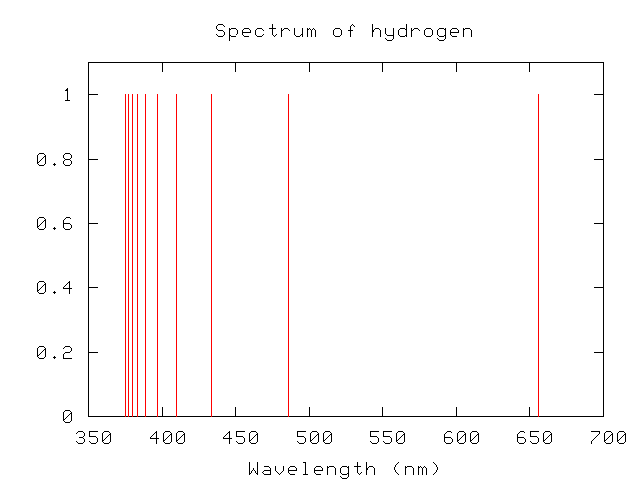
Expressed in nanometers, the wavelengths are
374.9 377.0 379.7 383.4 388.8 396.9 410.1 433.9 486.0 656.1
Balmer found that a simple formula reproduced these wavelengths:
                                   n^2
   lambda (n)  =  364.5 nm  *  -------------    ,    n = 3, 4, 5, ....
                                  n^2 - 4
Curious. As a reward for his insight, this set of visible lines in the hydrogen spectrum are called the "Balmer series".
Within a short period of time, other scientists found similar patterns in other portions of the electromagnetic spectrum.
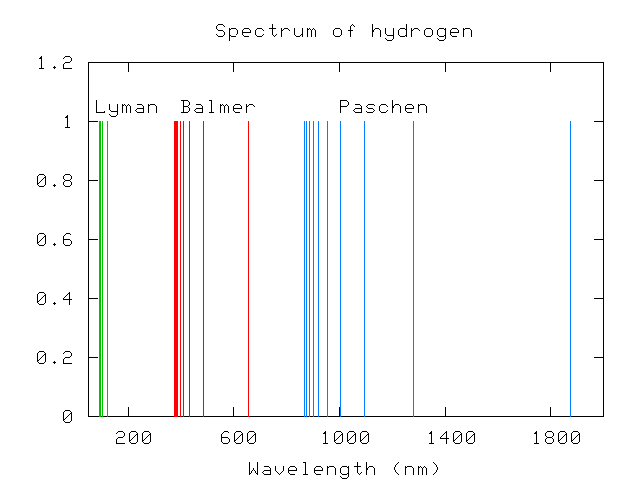
Paschen, in the infrared, measured lines with wavelengths
866.2 874.8 886.0 901.2 922.6 954.3 1004.6 1093.5 1281.4 1874.5which matched the series
                                   n^2
   lambda (n)  =  820.5 nm  *  -------------    ,    n = 4, 5, 6, ....
                                  n^2 - 9
and Lyman, in the ultraviolet, a series of lines with wavelengths
91.9 92.1 92.3 92.6 93.0 93.7 94.9 97.2 102.5 121.5corresponding to the series
                                   n^2
   lambda (n)  =   91.1 nm  *  -------------    ,    n = 2, 3, 4, ....
                                  n^2 - 1
In fact, scientists soon realized that hydrogen's spectrum could be broken down into a large number of series, each of which had wavelengths obeying a formula like:
                                   n^2
 lambda (n,k)  =   (limit)  *  -------------    ,    n = k+1, k+2, k+3, ...
                                 n^2 - k^2
The Lyman series corresponds to k=1 with a limit of 91.1 nm,
the Balmer series to k=2 with a limit of 364.5 nm,
and so forth.
But what did it all mean? Why were there regular patterns in these emission line wavelengths? Other elements didn't have such nice, regular patterns -- look at mercury, for example --
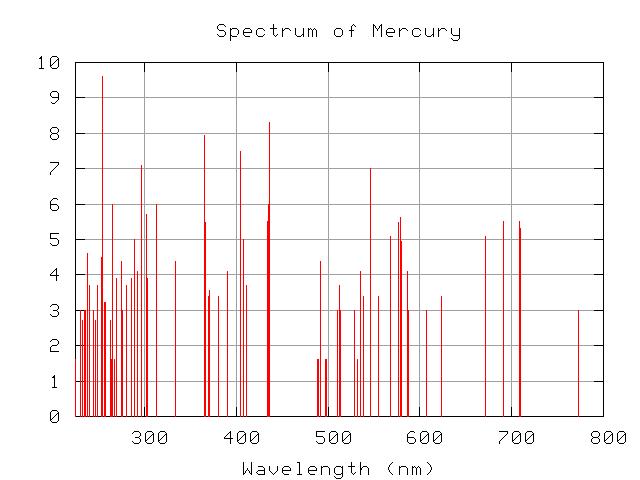
so what is special about hydrogen?
Another curious feature of the hydrogen spectrum appears if one writes down the frequencies of the emission lines, rather than the wavelengths. In the Lyman and Balmer series, we have (in units of 10^14 Hz)
  Lyman lines:  31.899  31.498  30.760  29.165  24.609
  Balmer lines:  7.533   7.292   6.891   6.152   4.557
Can you find pairs of frequencies which, when added together, yield another observed frequency?
This is called the Ritz recombination principle, after the scientist (Ritz) who first noticed it.
Again, why are there such simple patterns in the spectrum of hydrogen? What does it all mean?
Of course, even if scientists didn't understand exactly why each element had its own pattern of emission and absorption features, they were quick to use the information. One can
and much, much more ....
Further information:
Copyright © Michael Richmond.
This work is licensed under a Creative Commons License.