 Copyright © Michael Richmond.
This work is licensed under a Creative Commons License.
Copyright © Michael Richmond.
This work is licensed under a Creative Commons License.
You've been learning about the theory behind the pendulum .... so let's put it into practice.
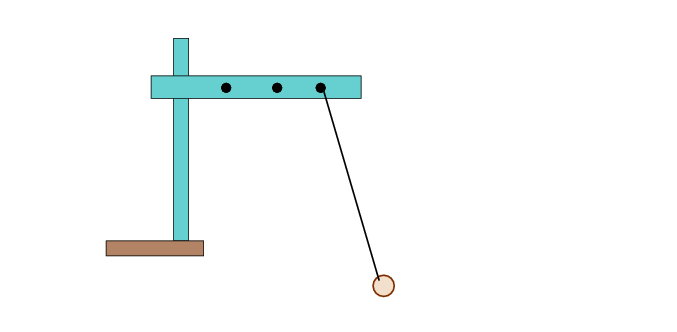
Set up equipment at your table so that you can hang a compact mass from a piece of string. Use one of the "pendulum clamps" as the horizontal support piece, since you can quickly attach and loosen the string from one of their screws.
The class will work as a group on this project and pool all the results. Each group should make measurements with just two of the following lengths; split up the lengths so that there is some overlap between groups.
Length of string (each group choose only 2)
Each group should do the following for its two lengths:
You should now have a big table containing measurements made by the entire class, consisting of pairs of lengths L and angular frequencies ω.
So far, so good. Let's now connect this experiment to the theory. In theory, the angular frequency ω of a pendulum is related to the length L of the string, and the gravitational acceleration g, like so:
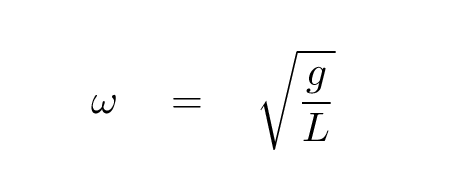
Since you have many values of L and ω, you should be able to figure out a good value for g. But how?
One technique that physicists often use when they have a big set of measurements and a theoretical equation which connects those measurements is to make a graph. How will that help? Well, just watch:
First, we re-arrange the equation a bit
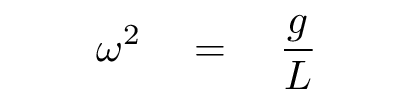
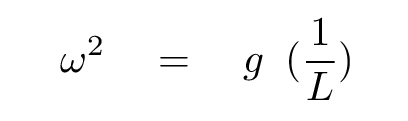
so that it looks like this:
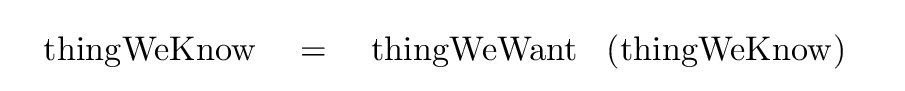
If we re-arrange it in this way, then we can use a straight-line method to find the quantity of interest -- in this case, the value of g. It will simply be the slope of a line drawn on a graph:
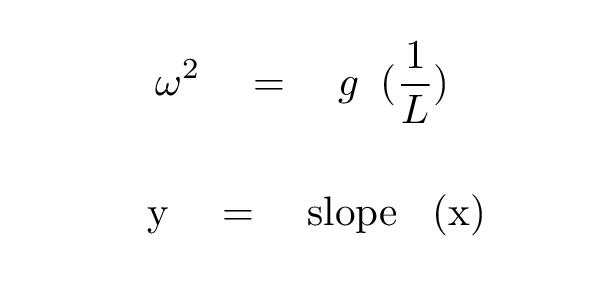
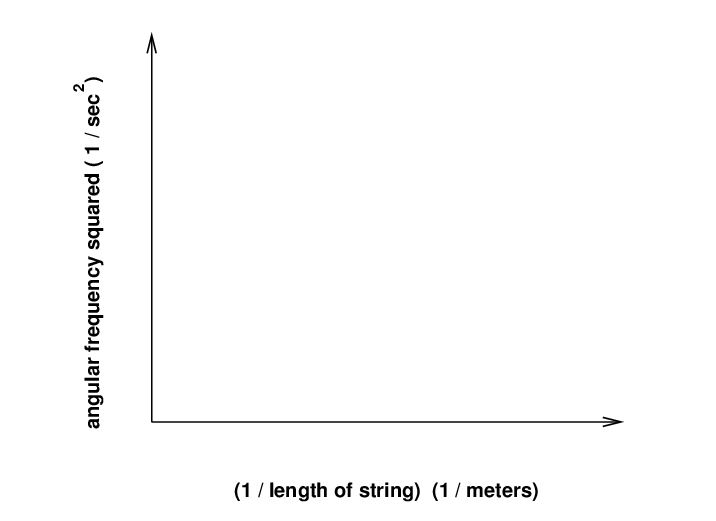
Your job: make a graph which corresponds to this equation. Mark points for each measurement made in class. Fit a straight line to the points on the graph, and measure the slope of that line. Use the slope of the line to calculate g.
How well does this measured value of g compare to the accepted value?
Look at the results from last year
You can look at the results from today's class here:
Copyright © Michael Richmond.
This work is licensed under a Creative Commons License.