 Copyright © Michael Richmond.
This work is licensed under a Creative Commons License.
Copyright © Michael Richmond.
This work is licensed under a Creative Commons License.
If we send light from a star through a spectrograph, we can look for shifts in the observed wavelengths of spectral features to tell us
As you may recall, there is a relationship between the wavelength at which light is emitted by a source and the wavelength at which it is observed:
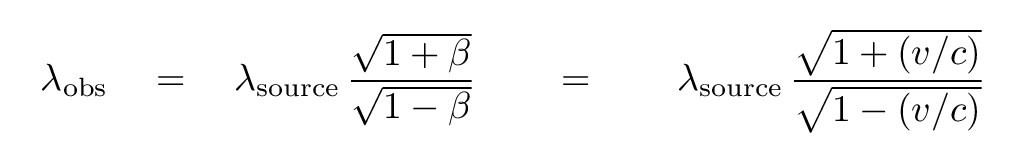
If the velocities are small relative to c, then the formula turns into (via the binomial expansion) this simpler form:

Now, astronomers have spent years measuring the light emitted not only of stars, but also by galaxies: vast collections of billions and billions of stars, like our own Milky Way. In the nineteen-twenties, some astronomers began to notice a trend in the spectra of faint galaxies: most galaxies were moving away from us -- and the more distant the galaxy, the faster the recession.
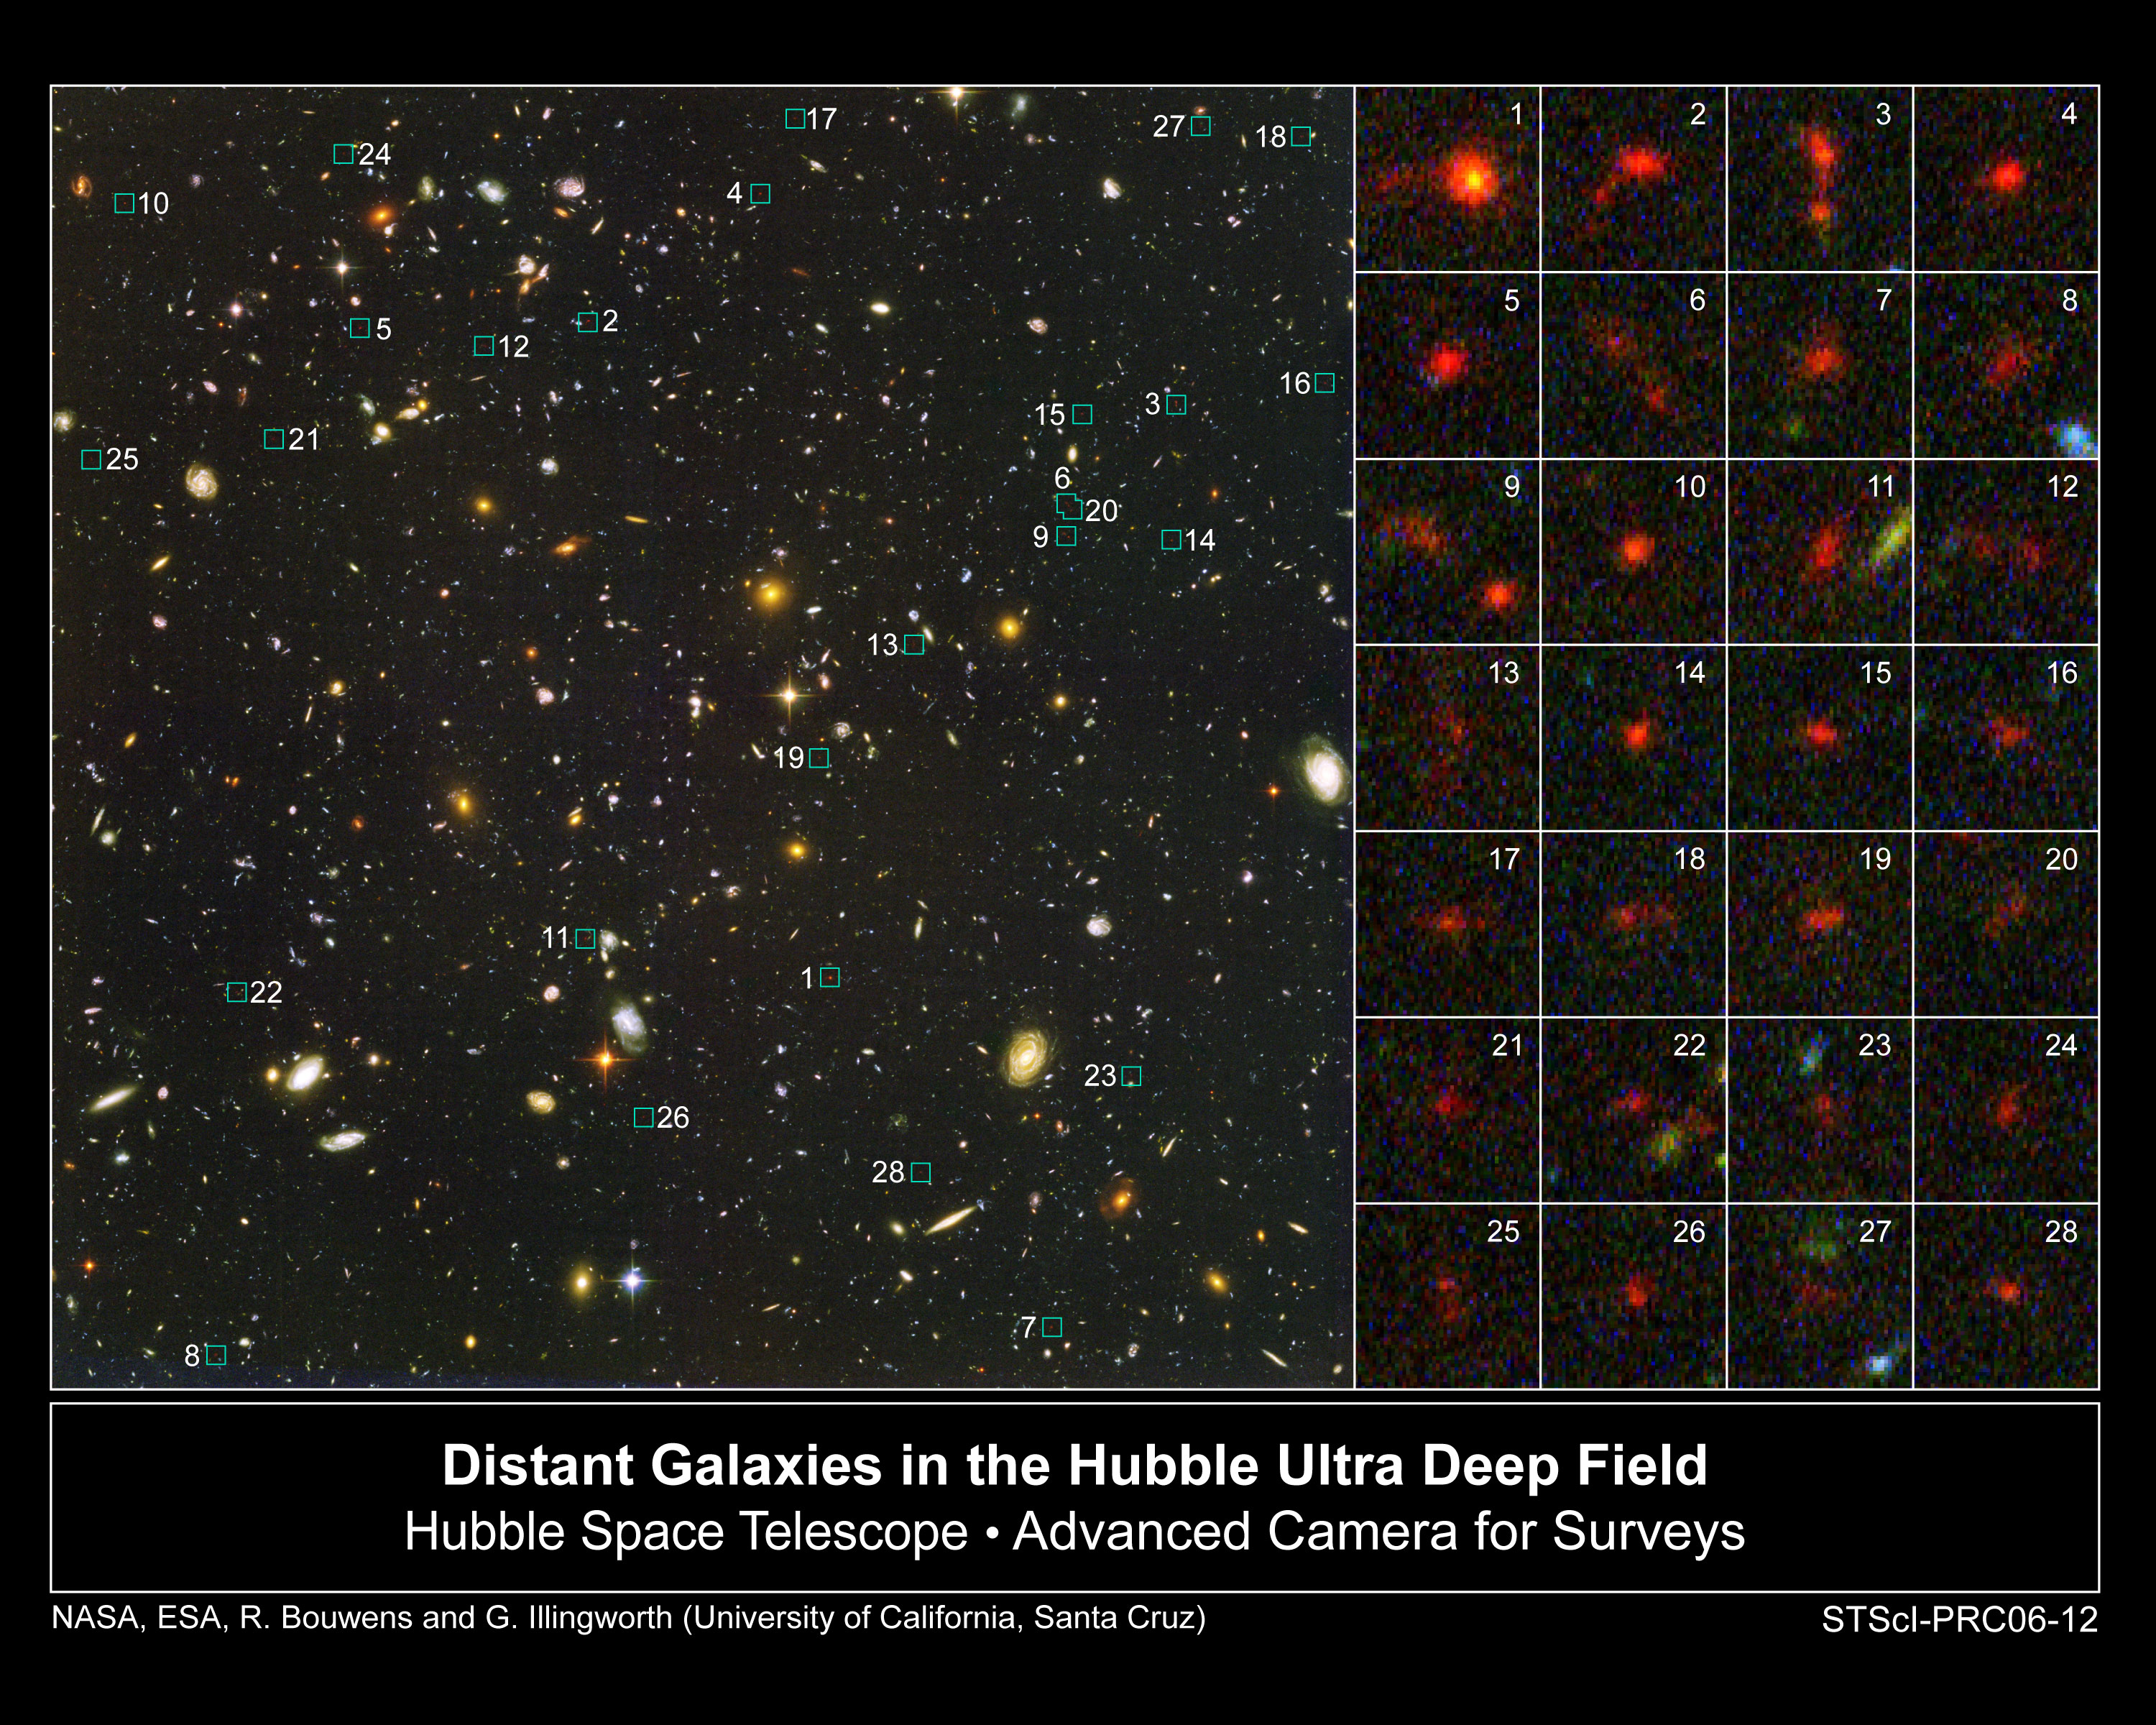
Because the location of spectral features usually shifts to longer wavelengths -- towards the red end of the spectrum -- astronomers refer to this as the redshift of a galaxy. Take a look for yourself at the appearance of some very distant, very fast-moving galaxies in the Hubble Ultra-Deep Field . (Click on the image for a larger version)
Astronomers often use the following equation to compute a quantity they call "redshift" in their technical papers:
Note that this "redshift" will be zero for an object which is not moving at all.
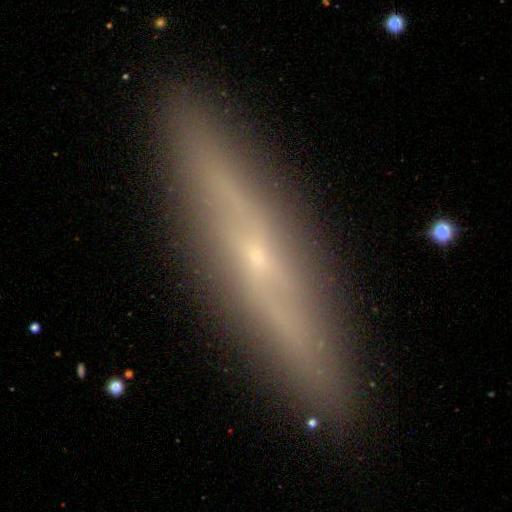
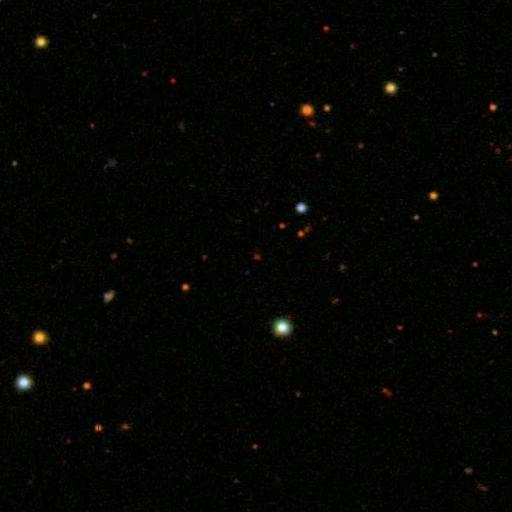
Just how fast are these motions? Let's find out. I have selected just a few of the millions of spectra collected by the Sloan Digital Sky Survey, a very large collaborative effort by astronomers from around the world. The SDSS took images of a large portion of the sky through five filters, then went back and collected spectra from many of the stars and galaxies in that region. I'll show you a picture and a spectrum from 8 different galaxies. If you look at the end of this web page, you'll find some additional information about the galaxies.
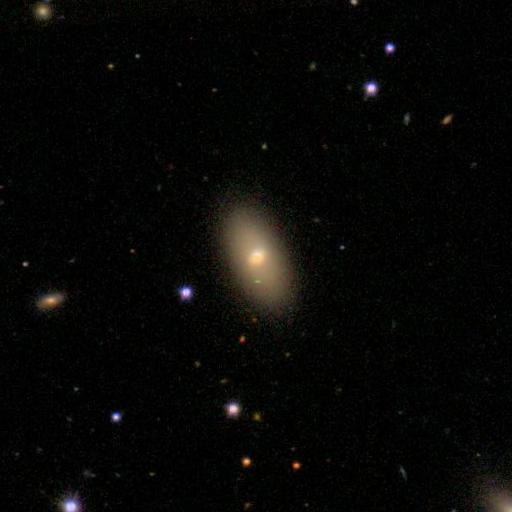
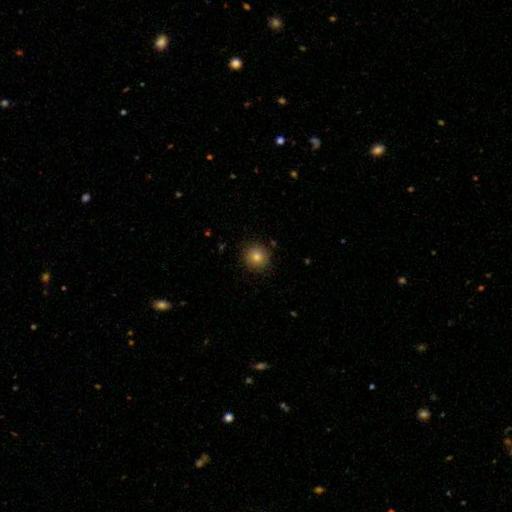
A galaxy in the Virgo cluster.
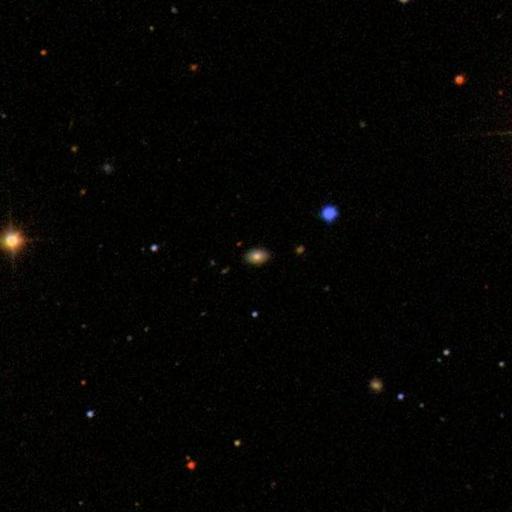
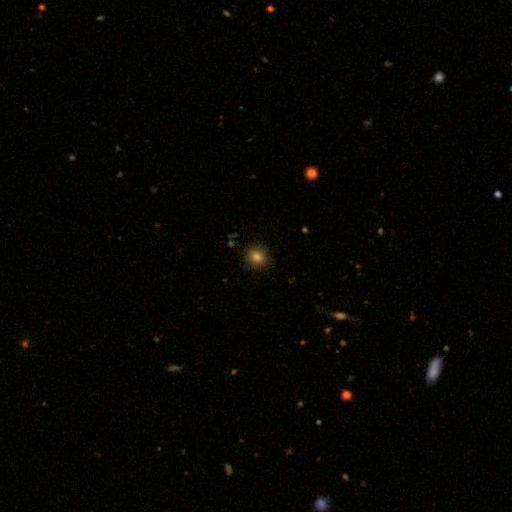
A galaxy in the Coma cluster.
A galaxy in the Corona Borealis cluster.
A galaxy in the Ursa Majoris II cluster.
A galaxy in the Ursa Majoris I cluster.
A galaxy in the Bootes cluster.
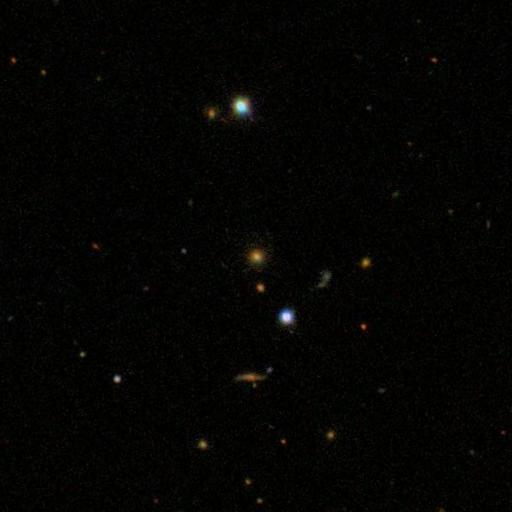
A somewhat isolated faint little galaxy (number 1).
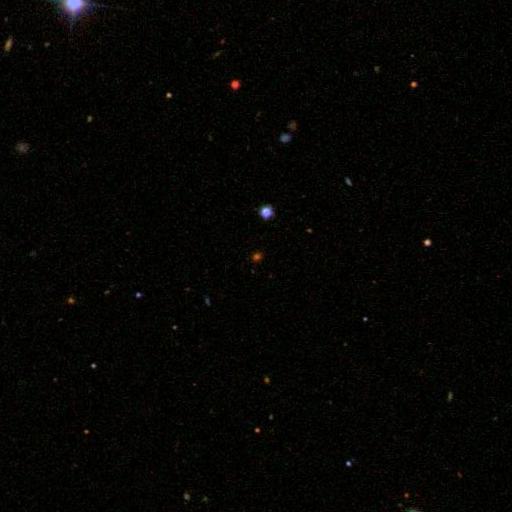
A somewhat isolated faint little galaxy (number 2).
Because the spectrum of this faint little galaxy is so noisy, it's hard to find the calcium H and K absorption lines. I've added a shifted version of a stellar spectrum near the top of the graph to help guide your eye to the proper absorption features in the galaxy's spectrum.
Now, you'll need a reference spectrum. I've chosen a star somewhat like the Sun, of spectral type G0V, since many of the stars in these galaxies are of this type. Here's what the spectrum of this sort of star would look like, if it were sitting still relative to the Earth.
Note the pair of strong lines on the left-hand side of this graph. They are caused when ions of calcium in the atmosphere of the star absorb some of the light welling up from the interior. These lines are called
Your job is to look at the spectrum of one of these galaxies, match up the pattern of absorption lines with the pattern in the star's spectrum, and identify the calcium lines. Then
     a) measure the observed wavelength(s)

     b) compute the redshift

                    lambda(obs)
            z  =  ---------------   -   1
                   lambda(source)


     c) calculate the velocity with which the
          galaxy is moving away from us,
          using the low-velocity approximation
          Doppler formula

     d) calculate the velocity with which the
          galaxy is moving away from us,
          using the full relativistic Doppler formula

     e) is it necessary to use the relativistic
          version for your galaxy?
Astronomers noticed that there was a pattern: the more distant galaxies appeared to be moving away from us faster. In fact, there was a relatively simple relationship between the distance to a galaxy and its speed of recession. Here, for example, are some measurements of galaxies in the local neighborhood, where it is relatively easy to determine distances.
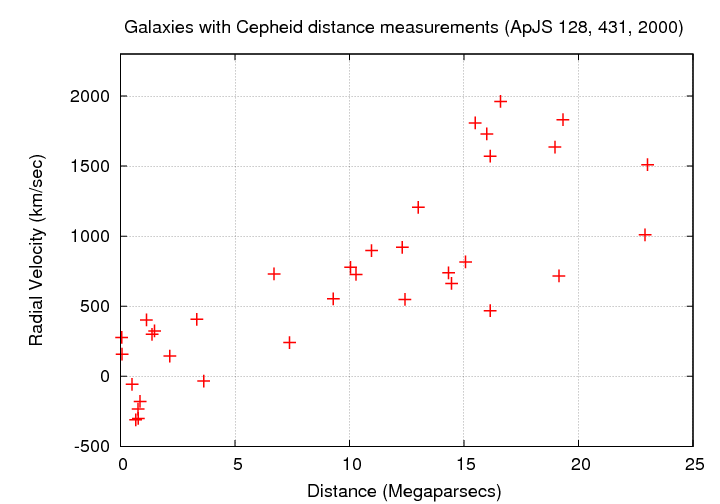
There appears to be a nearly linear relationship between distance and velocity. If one galaxy is twice as far away as another, then it moves away from us twice as fast. One can express this in mathematical form like so:
What could give rise to this sort of relationship between distance and recession velocity? One possibility is expansion. Consider a loaf of raisin bread:
We believe that we live in a universe which is currently undergoing universal expansion.
The universe is currently expanding ... but will it continue to do so forever? The fate of the universe depends on several factors, none of which we understand very well.
This factor may, if it has the right sign, cause space to expand more rapidly. It might act as a sort of "negative pressure" which exists independent of any matter.
Currently observations suggest that this factor has a value which causes space to expand significantly, especially at times in the future.
Astronomers are currently hard at work trying to answer all these questions. It's not an easy task, since the objects which provide the most information are located very far from Earth, and so consequently appear very faint and very tiny.
We don't yet know the values of all the important factors. If we did, we could compute the past and future size of the expanding universe.
 Thanks to the Smithsonian Institution.
The recent launch of the James Webb Space Telescope has allowed astronomers to peer back farther into the depths of space than ever before. Let's look at just one of the first of this new instrument's results to be announced.
The paper High-Redshift Galaxy Candidates at z=9-13 as Revealed by JWST Observations of WHL0137-08 describes the analysis of some very deep images of a rich cluster of galaxies. The authors took a series of images through a set of filters covering a wide range of wavelengths. They noticed something peculiar about the faint little objects at the locations marked in the image below.
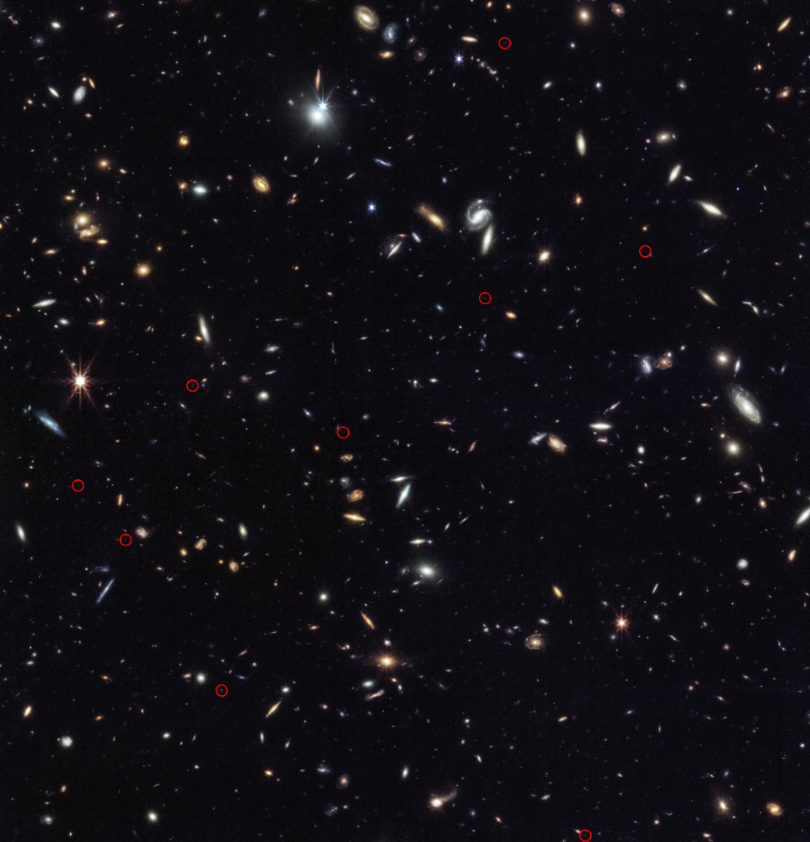
Image taken from Figure 2 of
Bradley et al., arXiv:2210.01777, 2022.
Here's a closeup view of several of these objects. Note how small and faint they are.
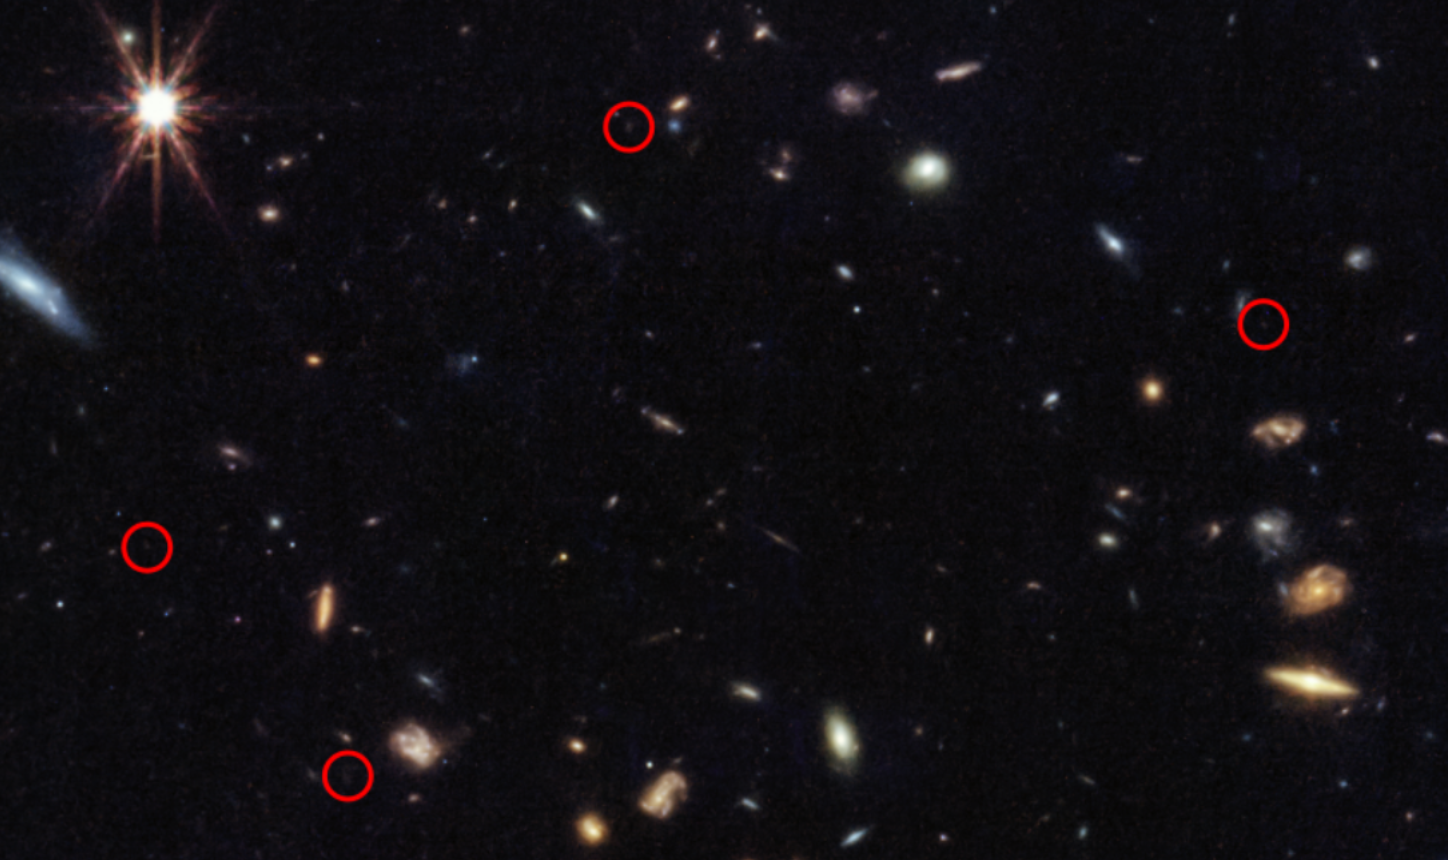
Closeups taken from Figure 2 of
Bradley et al., arXiv:2210.01777, 2022.
What is so peculiar about these objects? If one takes a picture through blue-ish, shorter-wavelength filters, one sees nothing. They only appear through red-ish, longer-wavelength filters. Well, that's sort of obvious if you look at the closeup, isn't it? That's why they appear to be RED.
We can explain this quantitatively if we examine the spectra of light emitted by a relatively young group of stars. I used 700 Myr models created by the Starburst99 group.
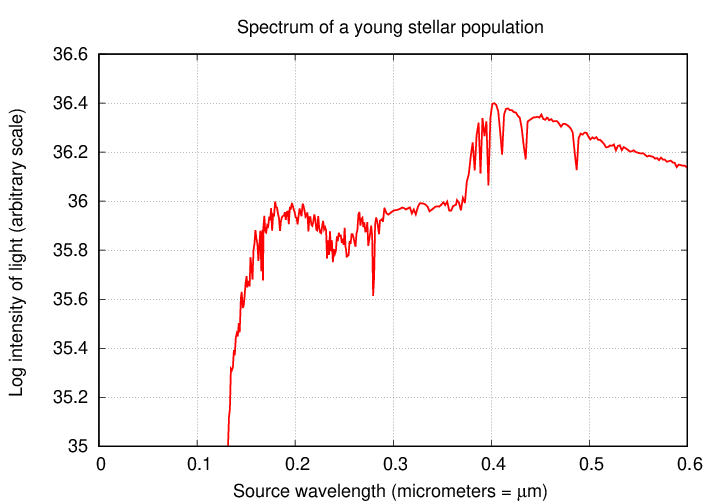
  Q:  How much light would you see at 0.1 micrometers?


  Q:  At what wavelength would the object start to appear bright?


  Q:  At what wavelength is there a "bump" to higher brightness?
When the authors examined the brightness of one of these objects as seen through different JWST filters, at different wavelengths, they saw a similar pattern:
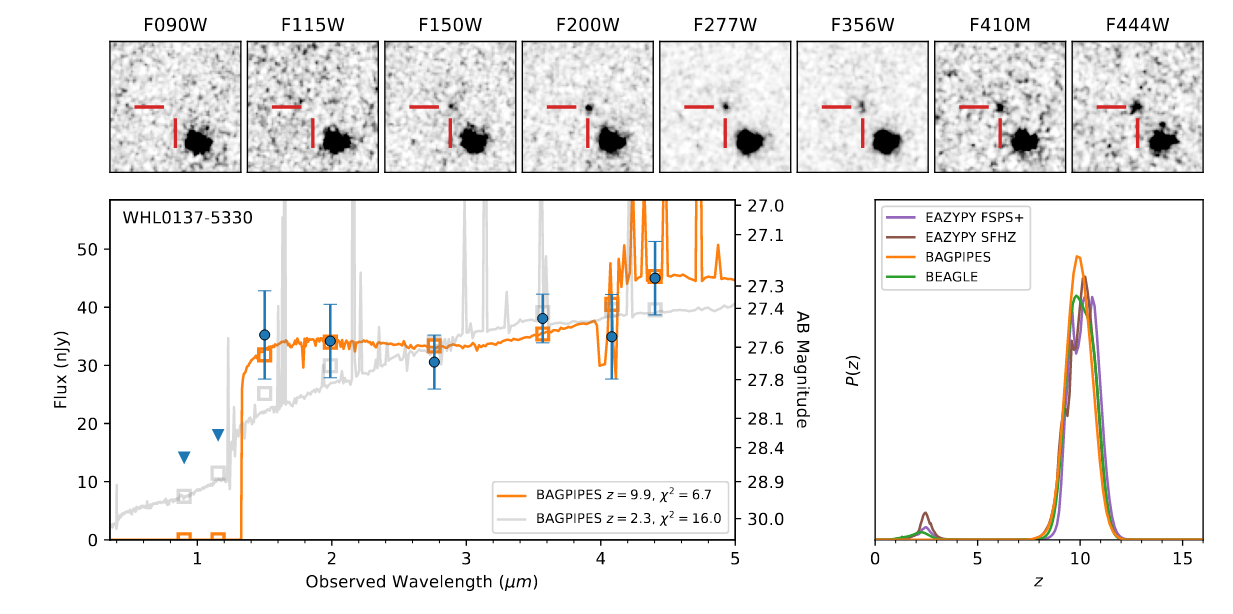
Taken from Figure 5 of
Bradley et al., arXiv:2210.01777, 2022.
However, there's one big difference: the wavelengths observed with JWST are all much longer than the wavelengths at which this light was emitted.
Q: At what OBSERVED wavelength is there a "bump" to higher brightness? Q: What is the redshift of this galaxy?
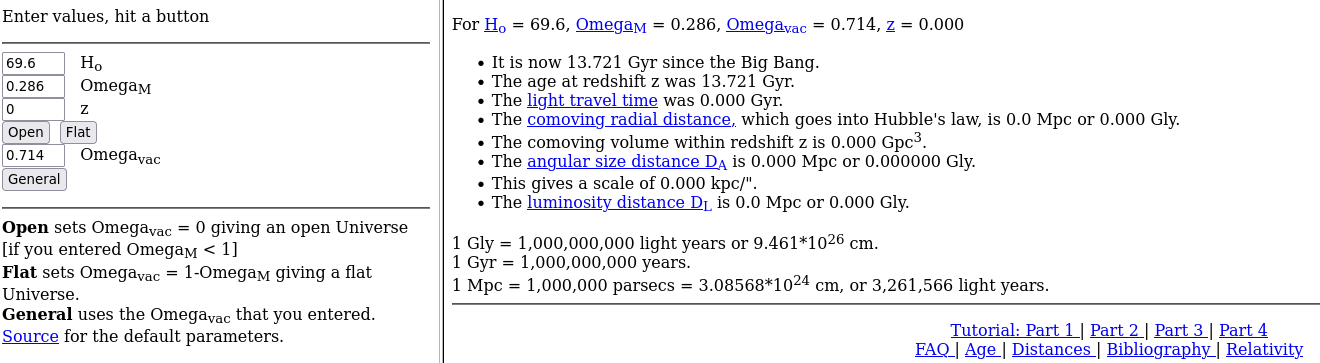
We can use the observed redshift of a galaxy to estimate its distance and its "age" (time after the Big Bang) when it emitted the light that we see now. It's sort of complicated, so I recommend using Ned Wright's Cosmology Calculator to do the work for us.
The galaxies shown in this lecture can all be found in the SDSS on-line catalogs . The data files for spectra have wavelength (Angstroms) in column 1, and flux (10^(-17) ergs/sec/cm^2/Angstrom) in column 2. The "smoothed" versions have been smoothed with a 5-bin or 10-bin running boxcar filter.
| RA | Dec | cluster | z | link to original spectrum | link to smoothed spectrum | Postscript graph of spectrum |
| 186.8055 | 12.7350 | Virgo | 0.006 | SDSS spectrum | smoothed spectrum | PS graph |
| 195.2171 | 28.3661 | Coma | 0.025 | SDSS spectrum | smoothed spectrum | PS graph |
| 231.5741 | 28.9272 | Corona Borealis | 0.074 | SDSS spectrum | smoothed spectrum | PS graph |
| 164.6540 | 56.8640 | Ursa Majoris II | 0.138 | SDSS spectrum | smoothed spectrum | PS graph |
| 177.8001 | 55.2883 | Ursa Majoris I | 0.153 | SDSS spectrum | smoothed spectrum | PS graph |
| 217.1976 | 31.8846 | Bootes | 0.197 | SDSS spectrum | smoothed spectrum | PS graph |
| 2.8806 | 0.2560 | none | 0.505 | SDSS spectrum | smoothed spectrum | PS graph |
| 142.5426 | 0.3472 | none | 1.077 | SDSS spectrum | smoothed spectrum | PS graph |
Copyright © Michael Richmond.
This work is licensed under a Creative Commons License.