 Copyright © Michael Richmond.
This work is licensed under a Creative Commons License.
Copyright © Michael Richmond.
This work is licensed under a Creative Commons License.
In the previous class, we reviewed the Galilean transformations for converting from the coordinates and time measured by one observer to the coordinates and time measured by another. Today, we'll look at a different set of transformations, named for Dutch scientist Hendrik Lorentz. The Lorentz transformations work properly at relativistic speeds AND at the ordinary speeds of everyday life.
Once again, imagine two inertial frames of reference: Fred, standing on the ground, and Jane, flying past him at high speed.

We'll denote Fred's measurements (and those of his assistants) with the regular symbols:
while Jane's measurements (and those of her assistants) will be written with "prime" markers:
Jane's spaceship flies past Fred at a speed of v in the positive x-direction, to the right.
I will not derive the Lorentz transformations here. If you wish, you can read the derivation in Taylor and Wheeler, or in Professor Lindberg's notes (see pages 40-42 in particular). The bottom line is that if Jane moves in the x-direction relative to Fred with velocity v, then we can convert Fred's measurements to Jane's measurements like so:
If you happen to be writing velocities in terms of the speed of light, so that someone moving at half the speed of light is given a velocity v = 0.5, and a beam of light is given a velocity v = 1, then the final equation simplifies to
Note the BIG difference between this set of equations and the Galilean transformations: here, not only does the position of an event depend on the observer, but the time of an event depends on the observer, too. The measurements of both space and time in the moving reference frame depend on both the space and time coordinates of the event in the stationary frame (and vice versa). It looks like we can no longer separate space from time; instead, events are immersed in a 4-dimensional matrix of space-time.
This mixture of space and time reminds me of another situation in which two distinct entities became inextricably combined, with a happy result:Hey, you got chocolate in my peanut butter!
You got peanut butter in my chocolate!
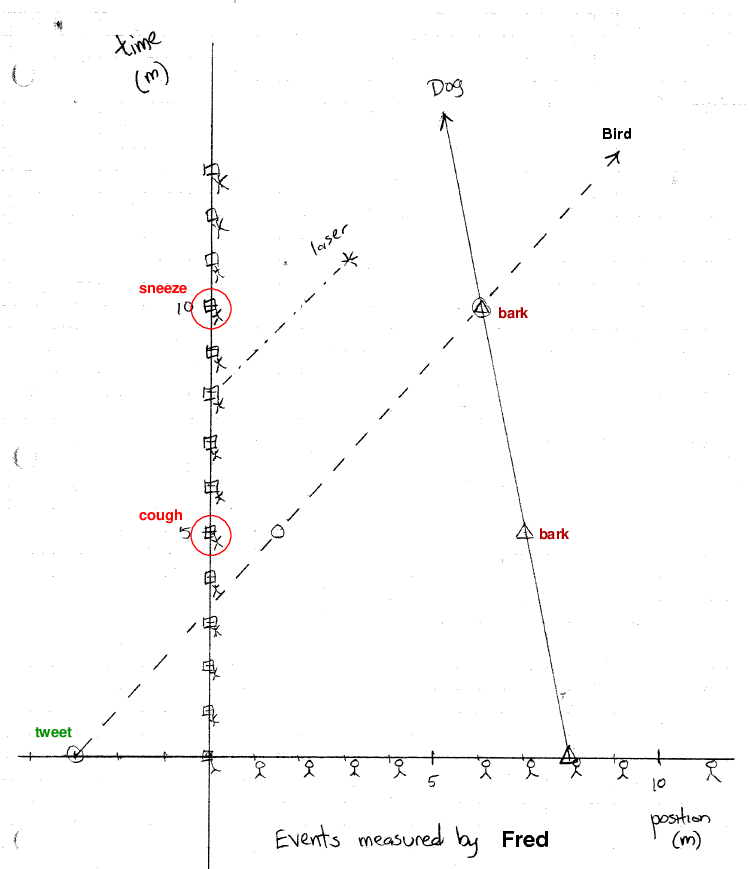
Fred stands on the ground in Rochester, in the middle of a big field. His team of students is spread out all over the field, with clocks synchronized and metersticks at the ready. Fred and his students watch as a series of events unfold.
  Q:  Make a space-time diagram which shows
      all these events, as measured by
      Fred and his team.


      (Your diagram should cover at least
       the region x = -4 to x = +15 meters
       and t = -1 to t = 16 meters)

      (You may consider just a few moments --
       t = 5 and t = 10 meters, for example)
You can look at my graph if you wish.
Now, Jane and her team are also making careful measurements of these same events as they fly past at v = 0.3c to the LEFT. Use the Lorentz transformations to figure out the locations and times of these events in Jane's frame of reference.
   Q:  What is the value of gamma that one should use
       to transform Fred's measurements into Jane's reference frame?
Compute the times and locations of the events
as measured by Jane and her assistants
on this worksheet.
  Q:  Make a (new) space-time diagram which shows
      all these events, as measured by
      Jane and her team.
You can look at my version of Jane's graph if you wish.
Look at your two diagrams to answer the following questions.
  1.  The long line of men raising their
      hands lies along the x-axis in
      Fred's space-time diagram.
      Do those events also lie along the
      x-axis in Jane's diagram?

         [How does this compare to
          your answer for the
          Galilean transformation?]


  2.  The man with a bad cold lies
      along the y-axis in Fred's diagram.
      Does he also lie along the
      y-axis in Jane's diagram?

         [How does this compare to
          your answer for the
          Galilean transformation?]


  3.  Consider the cough and the sneeze.
      What is the time interval between
      these two events according to Fred?
      According to Jane?

         [How does this compare to
          your answer for the
          Galilean transformation?]


  4.  Consider these two events:
          the bird chirps
          the bird meets the dog

      What is the time interval between
      the events according to each observer?

      What is the space interval between
      the events according to each observer?

         [How does this compare to
          your answer for the
          Galilean transformation?]


  4a. What is the space-time interval
      between these two events according
      to each observer?


  5.  How fast is the bird flying,
      according to Jane?

         [How does this compare to
          your answer for the
          Galilean transformation?]
Copyright © Michael Richmond.
This work is licensed under a Creative Commons License.