 Copyright © Michael Richmond.
This work is licensed under a Creative Commons License.
Copyright © Michael Richmond.
This work is licensed under a Creative Commons License.
The terrestrial planets look pretty similar on the outside: rocks, rocks and more rocks. Well, and liquid water, in the case of the Earth. But if we peer inside them, we see that each has a series of layers on top of which the rocky crust resides.
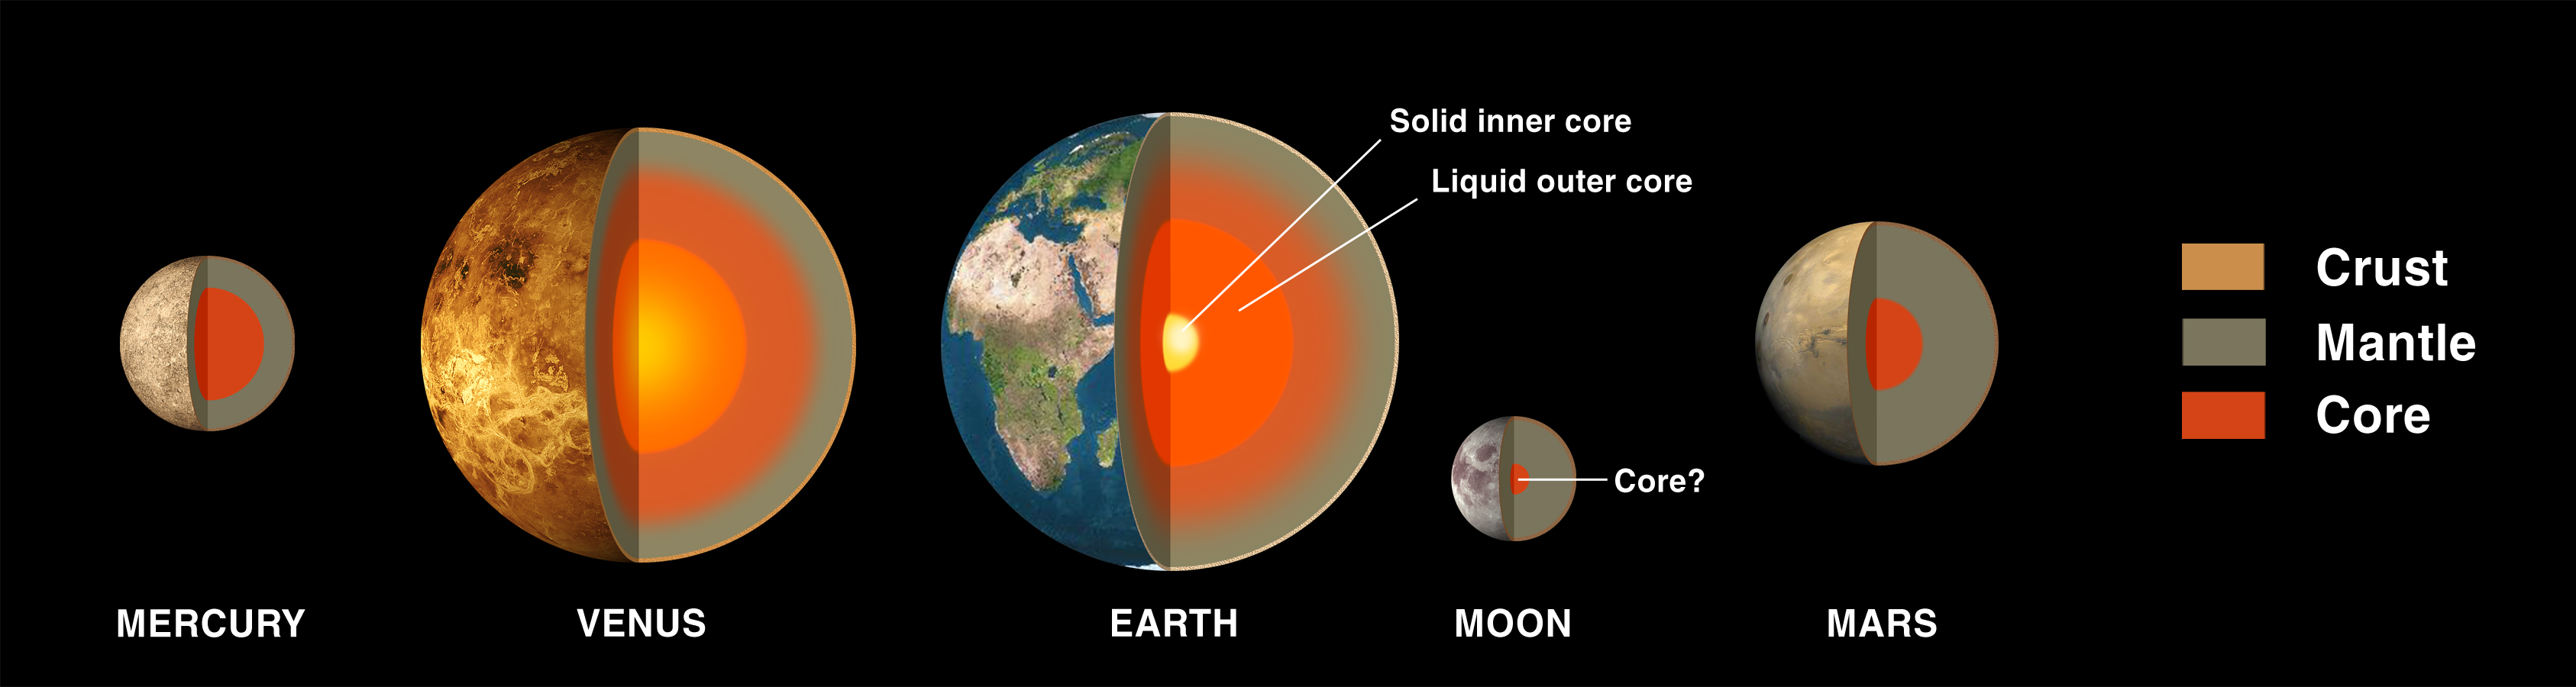
Image courtesy of
NASA (and Wikipedia)
The great majority of the Earth (and most other terrestrial planets) lies under the surface, in the mantle and core. The familiar portion on which we live -- the crust -- is just a thin outer layer. How thin is it? Well, in the figure above, the thickness of the crust has been exaggerated, so that it could be large enough to see.
  Q:  Compare the Earth to an apple.  Which is proportionally thicker?

           a)  the crust of the Earth (relative to the Earth's radius)

           b)  the skin of an apple (relative to the apple's radius)
Well, the short answer is -- they are about the same!
The thickness of the Earth's crust varies: it is thin under the oceans (about 5 km), but thick under mountain ranges (up to 100 km). So, the ratio of crust to radius falls somewhere between these two extremes:
   thickness of Earth's crust          5 km
  ----------------------------   =    ---------  =   0.0008     under oceans
     radius of the Earth              6378 km


   thickness of Earth's crust          100 km
  ----------------------------   =    ---------  =   0.016      under mountains
     radius of the Earth               6378 km
Apples vary, too, of course; there are a myriad varieties with different sizes and characteristics. Using the skin thicknesses measured in Homutova and Blazek (Hort. Sci. (Prague) 33, 108 (2006)), and the radius of the apple I had for lunch today, we find
   thickness of apple's skin           0.06 mm
  ----------------------------   =    ---------  =   0.0015
     radius of apple                   40 mm
Image courtesy of
NASA (and Wikipedia)
We classify the layers as
The crust of a planet is easy to study: just walk (or fly) above it, take pictures, and grab samples to study in the lab. No problem. But how can scientists learn about the deep interior portions of a planet?
  Q:  Can scientists drill a hole into the mantle and core to
             descend and acquire samples?
No, alas. The deepest mines sunk into the Earth are only 5 to 10 km deep, and none have succeeded in penetrating all the way through the crust to the mantle. One of the big problems is the heat: temperatures at the base of the crust are expected to be many hundreds of degrees Celsius, causing drilling equipment to deform and melt.
So, how DO we know about planetary interiors? How can we possibly declare that terrestrial planets have several layers, and even determine that some may be liquid and others solid?
There are (at least) three different techniques which can reveal the properties of planetary interiors. Let's discuss each one in turn.
                               mass (kg)
        average density ρ =  ------------
                              volume (m3)
How can we determine the mass of a planet? All it takes is a satellite -- natural or artificial -- and the knowledge provided by Johannes Kepler and Isaac Newton.
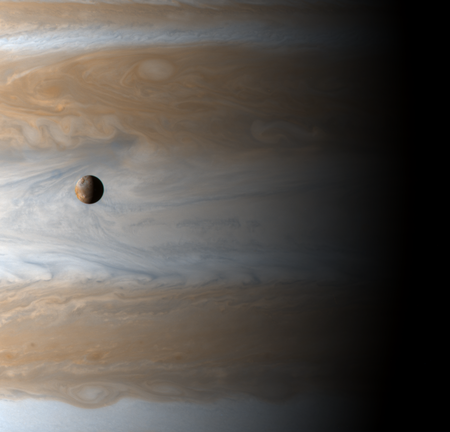
Image of Jupiter and Io from Cassini,
courtesy of
NASA/JPL/University of Arizona
Image of Pioneer Venus courtesy of
Ames Research Center and Hughes Aircraft Company.
Kepler's Third Law, as you may recall, connected the period of a planet's orbit to its distance from the Sun. Isaac Newton saw that this relationship was due to the nature of the gravitational force; and, in fact, Newton was able to add some terms to Kepler's Third Law, making it apply not only to planets orbiting our Sun, but to any two objects orbiting each other.

Using this extension of Kepler's Third Law, we can easily compute the mass of any object which has a real or artificial satellite. Here are some examples:
            Body        Mass (kg)      Radius (m)       Avg. Density (kg/m3
            ----------------------------------------------------------------
            Mercury     3.3 x 10²³     2.44 x 10⁶

            Earth       6.0 x 1024     6.38 x 10⁶

            Mars        6.4 x 10²³     3.40 x 10⁶

            Moon        7.4 x 10²²     1.74 x 10⁶

            Comet 67P   1.0 x 10¹³     1.64 x 10³

            Jupiter     1.9 x 1027     7.15 x 10⁷

            ----------------------------------------------------------------
For comparison, here are the densities of some common substances:
            Material         Density (kg/m3
            ----------------------------------------------------------------
             Iron               7870

             Olivine (rock)     3350

             Basalt (rock)      3000

             Water              1000

            ----------------------------------------------------------------
Now look at the interiors of the terrestrial planets again. See how it works?
Image courtesy of
NASA (and Wikipedia)
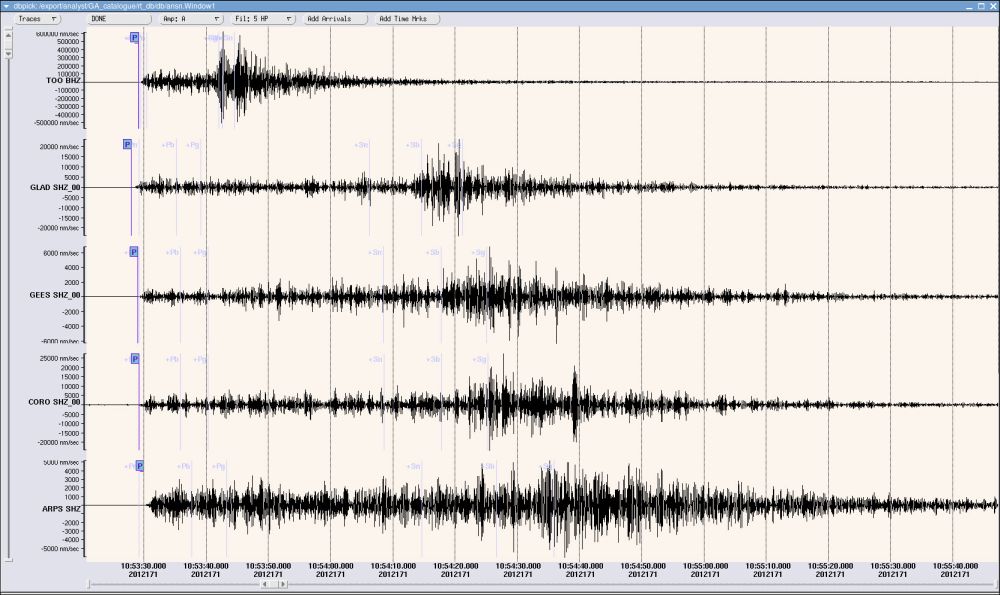
Image courtesy of
Geoscience Australia
It turns out that a big disturbance will create waves of two different types: longitudinal waves -- which can travel through solids and liquids -- and transverse waves -- which can only travel through solid materials. These waves travel at different speeds: the longitudinal waves are a bit faster, so they will arrive first at a distant station.
By measuring the arrival (or absence) of waves of each type from very distant events, geologists can figure out which regions of the Earth's interior must be solid, and which liquid.
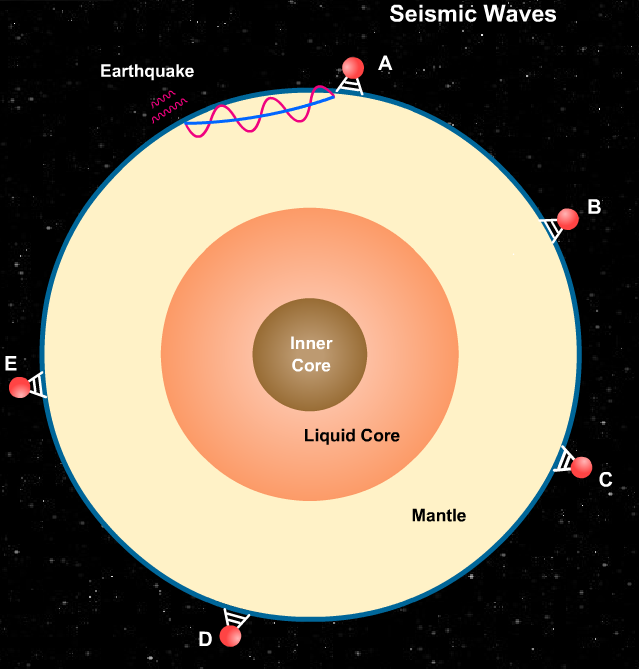
Not only that -- it turns out that the speed of a wave changes with the density of the material through which it propagates. By combining the results of many earthquakes all over the Earth, observed at many stations all over the Earth, geologists can refine models of the Earth's interior structure. They can figure out how the density changes with depth.
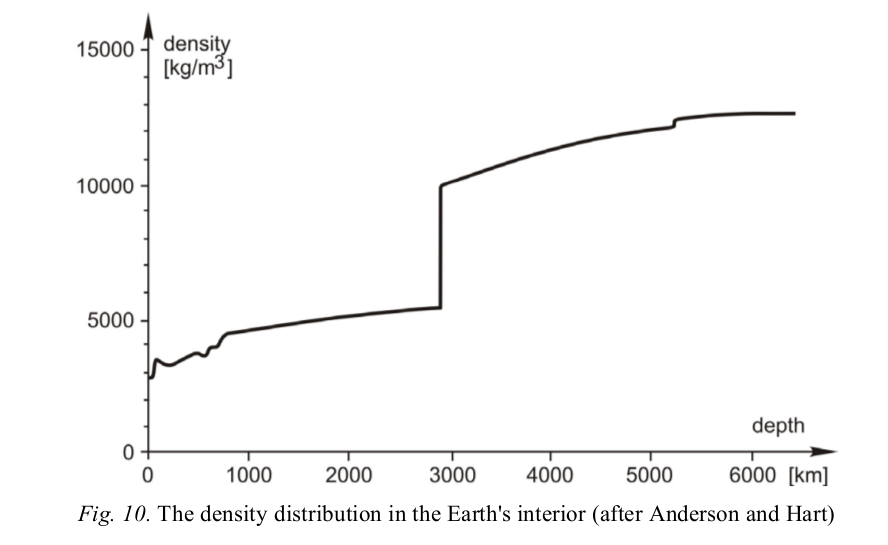
Figure 10 taken from
Volgyesi, in "Periodica Polytechnica Chemical Engineering",
26 (1982)
      Q:  On which bodies of the solar system have humans placed
               seismometers?
The Earth (of course), the Moon, Venus, and Mars. In November, 2018, Mars will gain a new seismometer, to be delivered by the Mars Insight spacecraft.
Isaac Newton was a very clever fellow. Among his many accomplishments was the following proof:
Any spherically symmetric distribution of matter acts as if all its mass were concentrated in a point at its center.
What that means is that IF a planet were perfectly spherically symmetric, then a moon, or a spacecraft, would orbit that planet just as it would orbit a "point mass:" in a perfect elliptical orbit, following Kepler's Laws.
IF that were the case, we could use the motion of the orbiting object to figure out the mass of the planet ... but that's it. Just the mass.
On the other hand, if a planet has some bits and pieces which are NOT spherically symmetric, then the orbit of a moon (or a spacecraft) will not be a PERFECT ellipse. Instead, the orbit will have small perturbations: tiny non-elliptical curvy sections, or periods when the orbiting object moves a little bit faster or a little bit slower than the perfect elliptical orbit.
And this gives astronomers a third method to learn about the internal structure of a planet: very, very, VERY carefully measure the motion of a spacecraft as it moves past (or around) the planet.
For example, the Gravity Recovery And Interior Laboratory (GRAIL) mission sent two small probes into orbit around the Moon. They have identical orbits, but one leads and the other follows a short time after. As they move, the spacecraft continually exchange radio messages with each other, and with a control center on Earth.
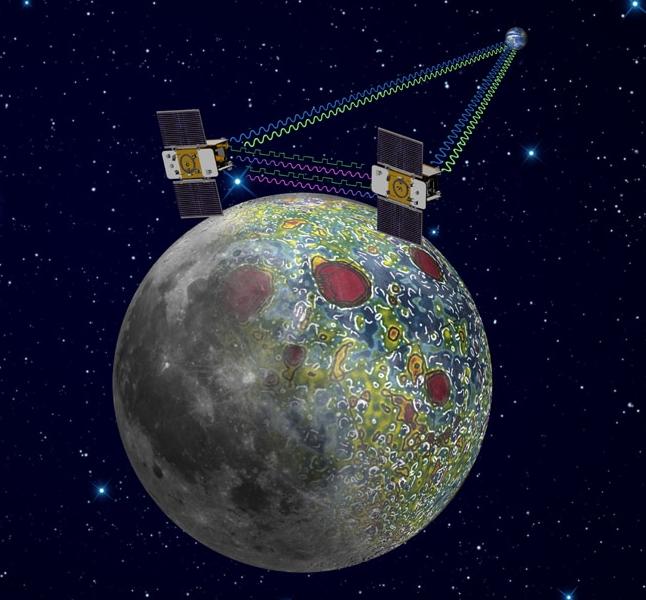
Figure courtesy of
NASA/JPL-Caltech
The controllers on Earth can measure the distance between the two craft very precisely. How precisely? To within a few micrometers. When the leading spacecraft passes over a region with slightly higher density, it will be pulled ahead of its partner briefly; when it passes a region of lower-than-average density, the trailing craft will creep a little closer. A careful analysis of these changes in relative position can reveal the presence of mascons (mass concentrations) inside the solid body of the Moon.
The map below shows that one side of the Moon (the blue one, which faces away from the Earth) has a thicker crust, while the other side (the red one, facing the Earth) has thinner crust.
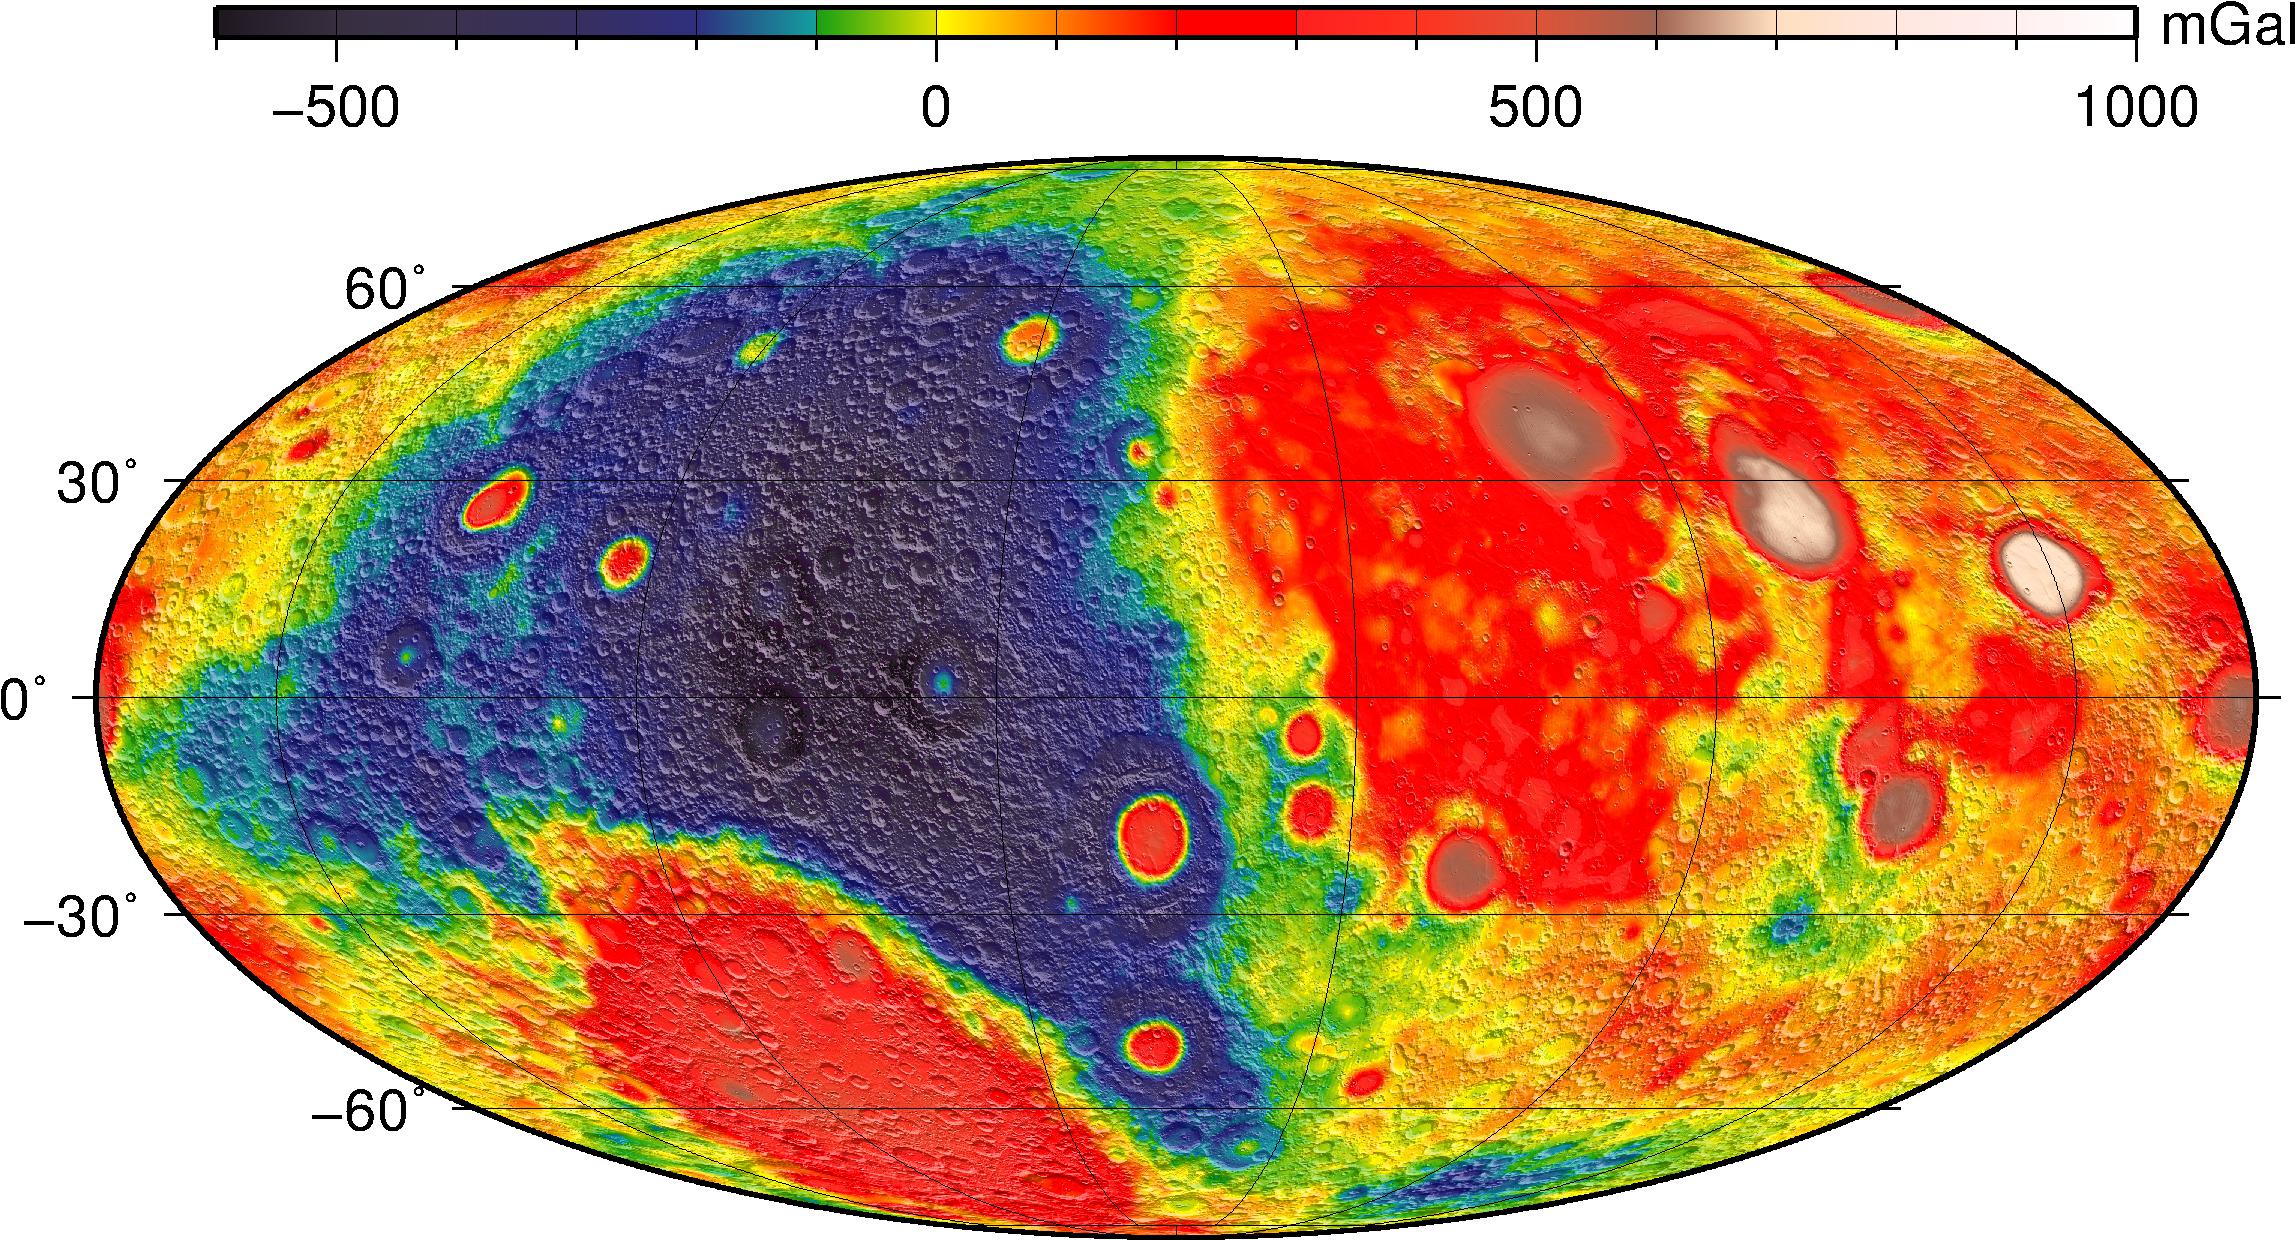
Figure courtesy of
NASA/JPL-Caltech
If one removes the nearside/farside difference from the map, the remaining, small-scale variations in gravity are due to masscons marking the sites of ancient giant impacts.

Figure courtesy of
NASA/JPL-Caltech
Fine -- we've established that the major planets have "layered" interiors, ranging from very dense materials at the center to "lightweight" materials (rocks are lightweight? In this context, they are!) on the outside.
But why?
We believe that this structure is a feature of any object which satisfies two criteria:
In other words, any object which is BIG and is (or was) HOT.
The process is illustrated in the figure below.
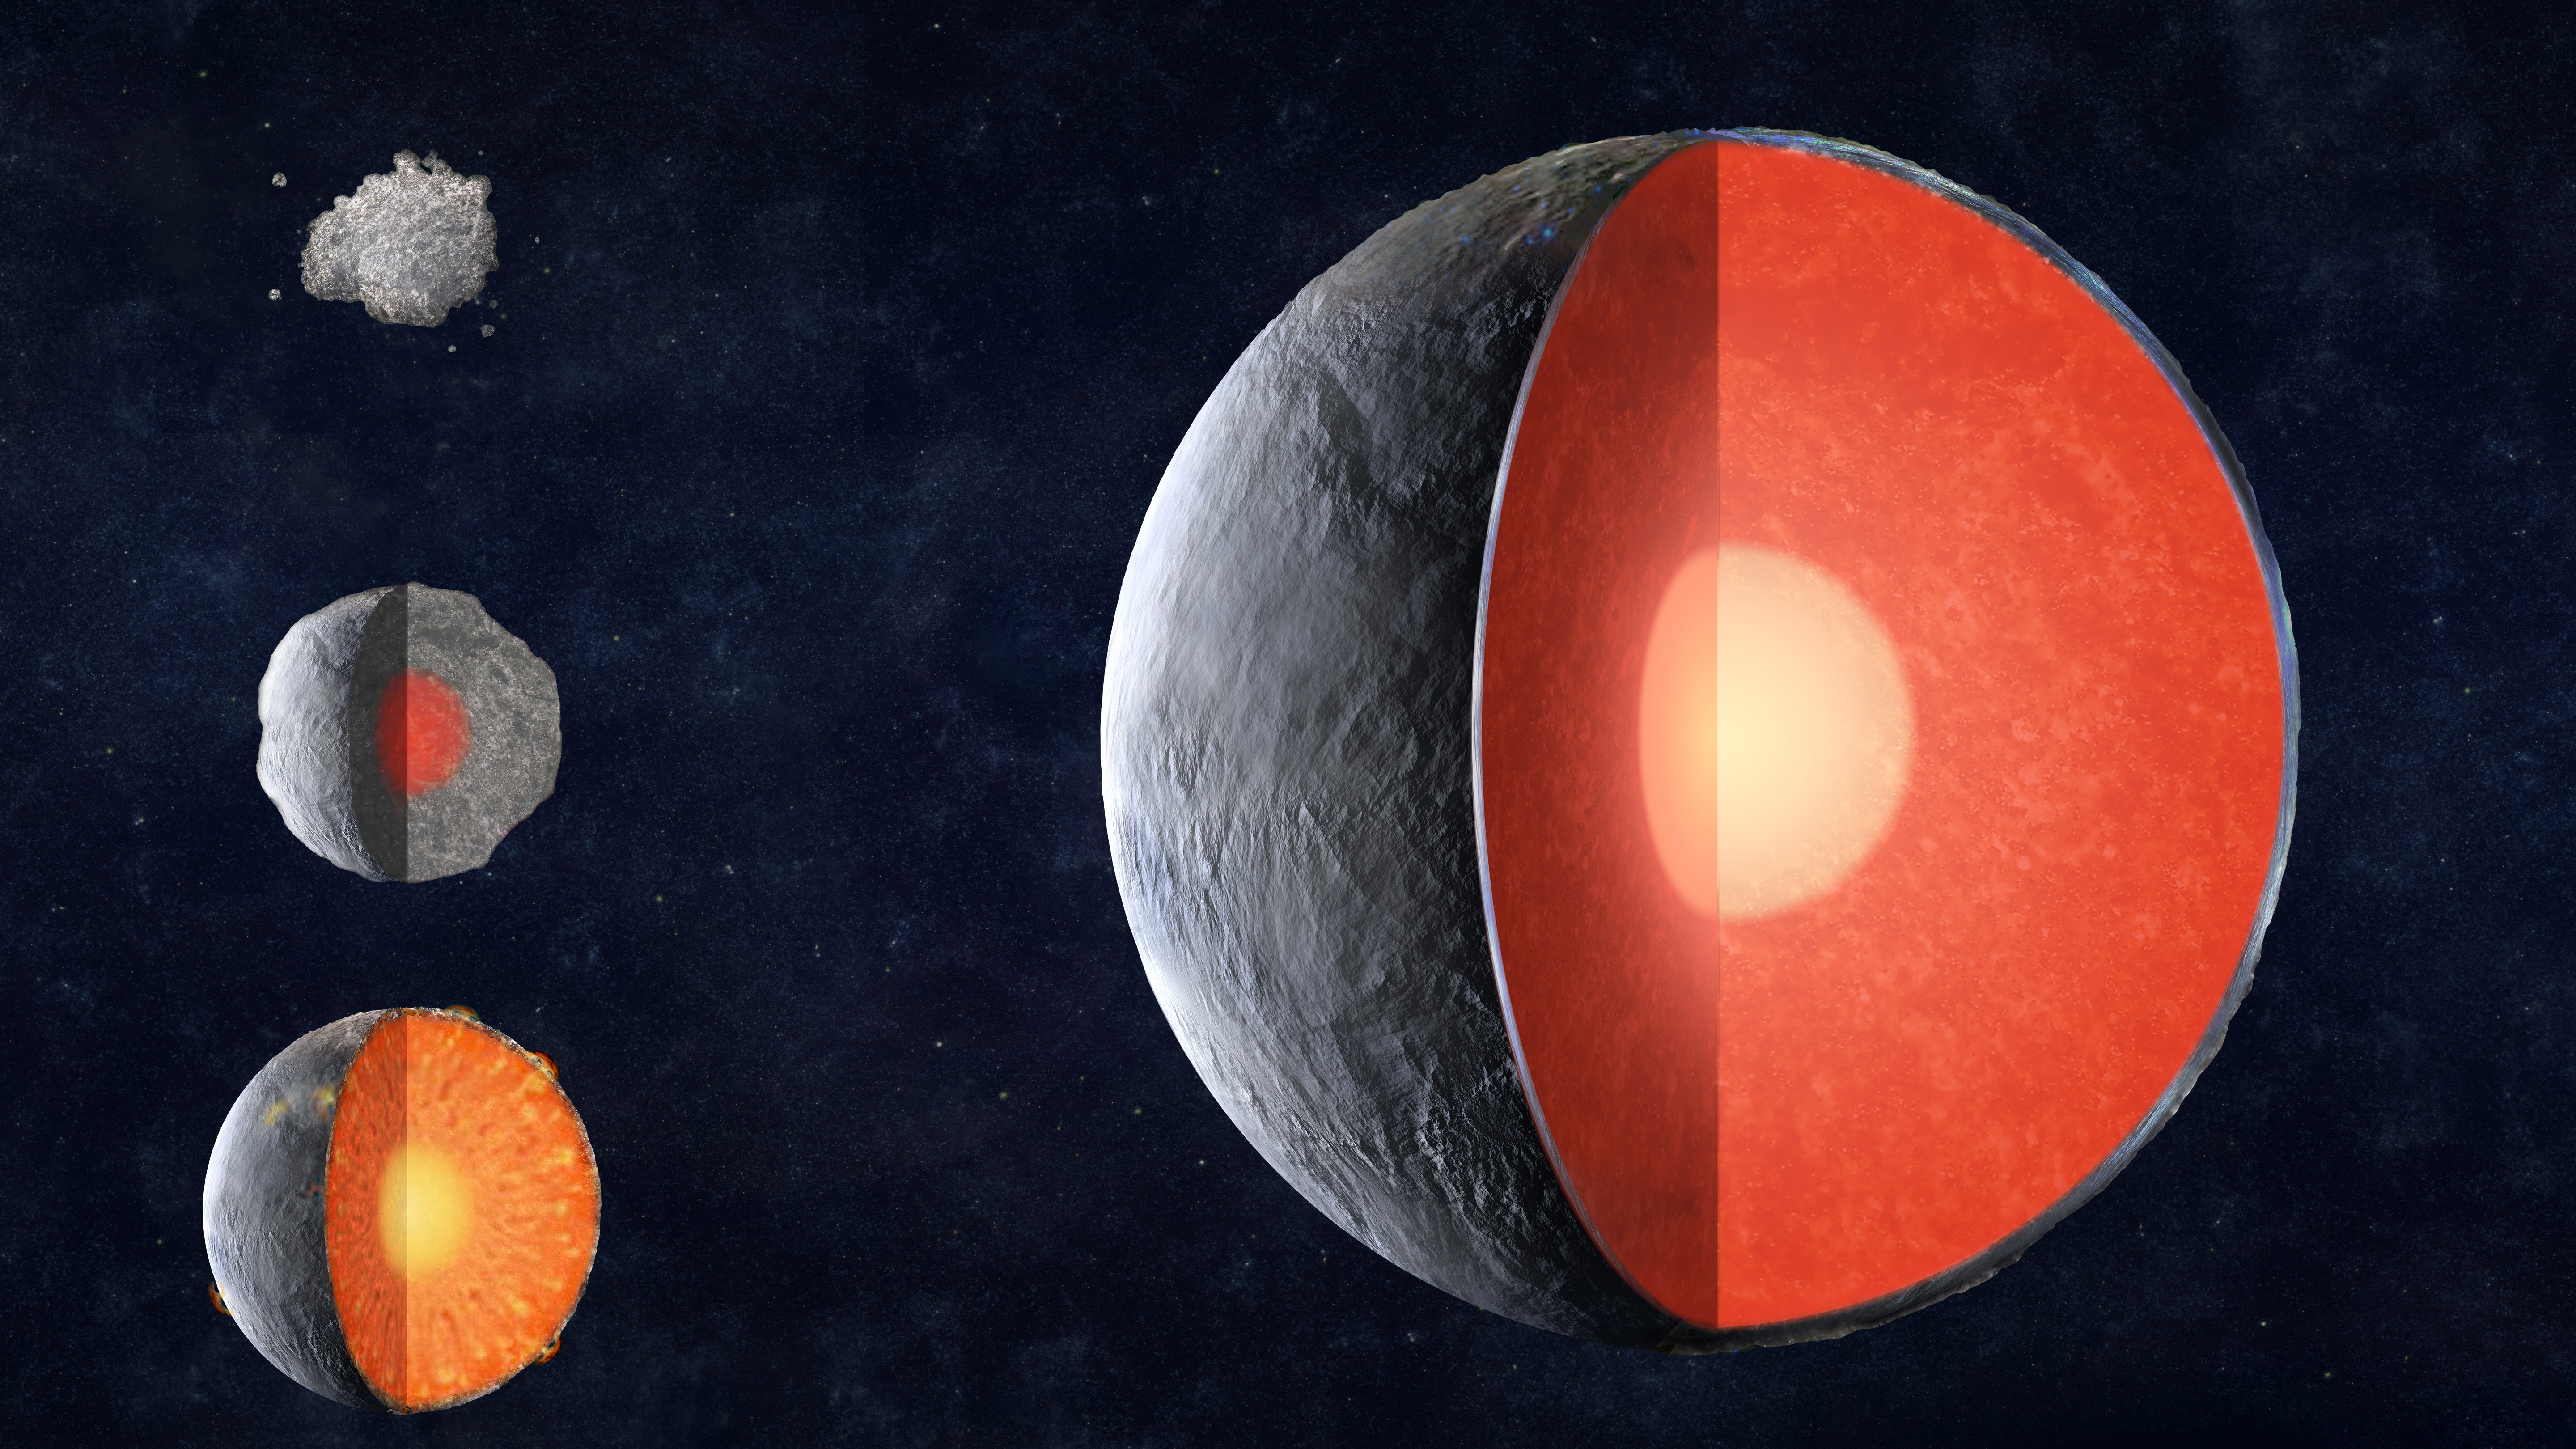
Figure courtesy of
NASA/JPL-Caltech
Recall that when the solar system was still forming, a disk of gas and dust formed tiny grains of solid material. Those grains stuck together, forming larger grains, then pebbles, then rocks. Eventually, the rocks coallesced into planetesimals, which would have had irregular shapes -- like the picture at upper left.
However, some of these planetesimals, as they continued to grow, become hot. Hot enough to melt the material in all or most of their interiors (as shown at middle left).
   Q:  What could heat up a planetesimal in the young Solar System?
           Can you think of at least two different physical mechanisms?
The dominant forms of heating were
The combination of these effects caused the interiors of large proto-planets to become fully molten (as shown at lower-left of the diagram). Under these conditions, the heaviest materials in the planet sank down toward the center, while lighter materials floated up to the surface.
The result is a stratified planetary interior.
Figure courtesy of
NASA/JPL-Caltech
Note that one of the conditions for all this to happen is that the gravitational forces of one bit of the planet on the other bits must be large enough to compress the planet into a round shape. When we look at the major terrestrial planets, such as Earth or Mars, we see -- round shapes.
But what about smaller objects? Emily Lakdawalla of the Planetary Society has collected images of many of the smaller worlds in our Solar System and put them together in a single figure, all with the proper relative sizes. Below is a figure showing objects between 10,000 km in diameter at the large end (Mars) and about 400 km (Mimas).
Q: Do you see any non-round objects in this diagram?
I do. Two of the smallest objects, Vesta and Proteus, look distinctly like potatoes. Now, those two are the only two of their size which are made mostly of rock; the other small objects in this figure are mostly made of ice, which has a lower structural strength. We'll discuss those differences in later weeks when we focus on asteroids and comets and icy bodies.
If we look at all the small bodies (smaller than Vesta) in the Solar System which have been visited by spacecraft -- so that we have decent pictures of them -- we see ... what?
Q: Do you see any round objects in this diagram?
It appears that the dividing line between "round" and "not-round" is something like a diameter of 300-400 km, or a radius of 150-200 km.
We might, therefore, expect that only objects larger than 200 or 300 km in radius might have a stratified interior. Smaller objects might have grown very hot and liquid at early times, but lacked the strong gravitational field to separate materials of different density.
And, indeed, NASA's recent Dawn mission spent enough time orbiting the asteroid Vesta to determine that it has a small iron core at its center. The radius of Vesta, 262 km, puts it very close to the dividing line.
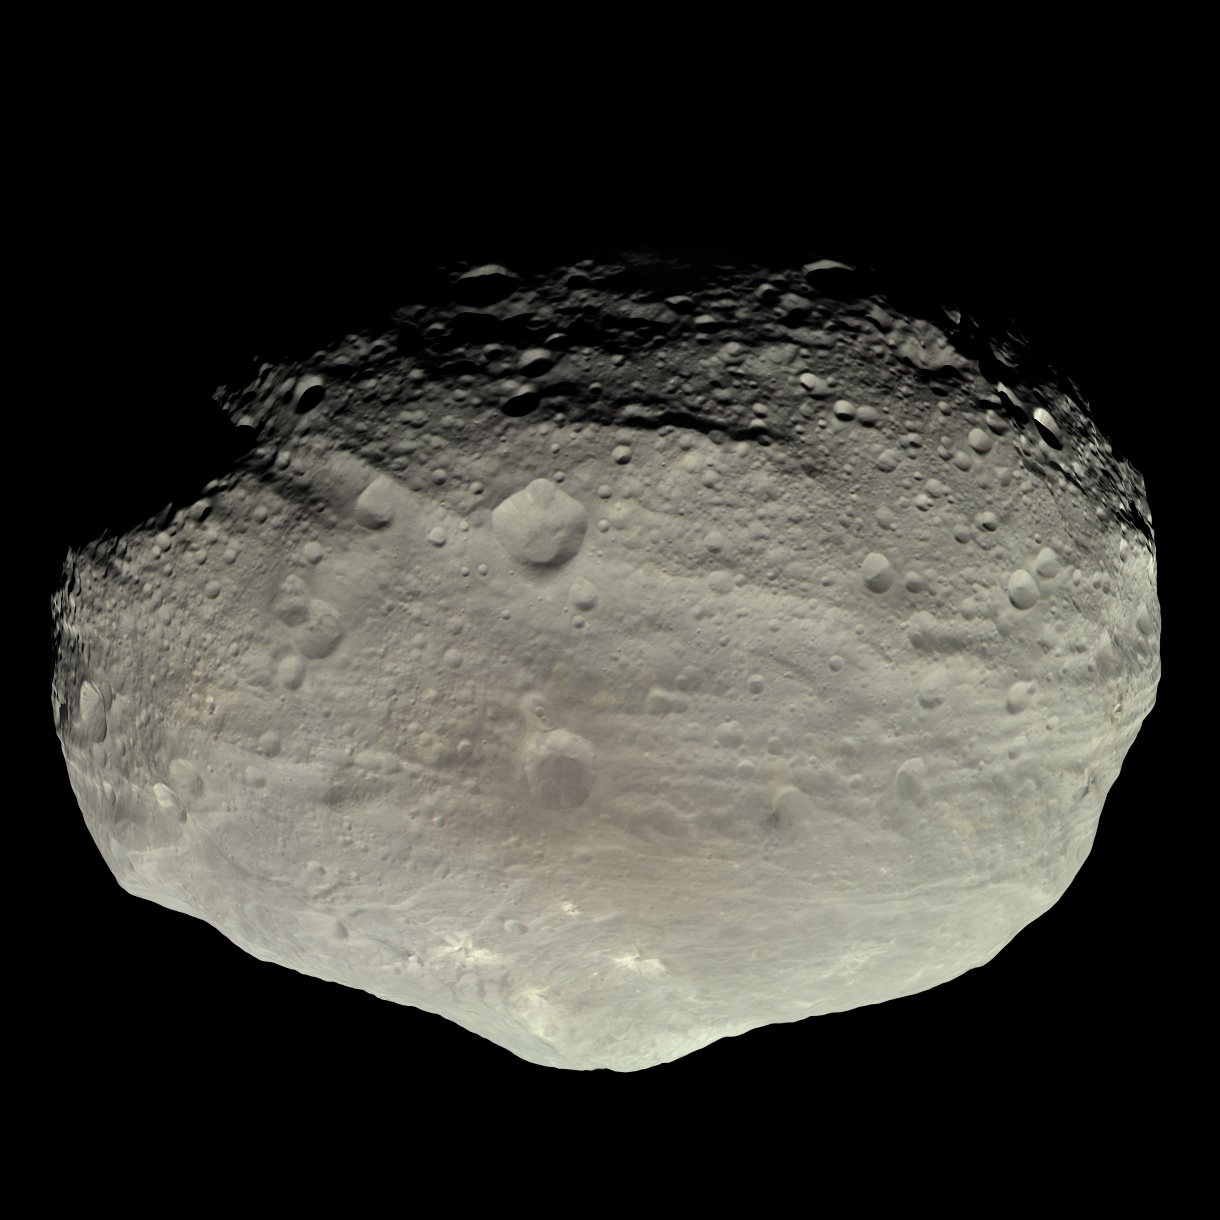
Image courtesy of
NAAA / JPL / MPS / DLR / IDA / Björn Jónsson
The Dawn mission also visited the slightly larger asteroid named Ceres. Although Ceres is nearly twice the size of Vesta -- about 473 km in radius -- and considerably rounder, its interior does NOT feature an iron core. There is some differentiation, with higher-density materials at the center, but overall, Ceres is made largely of stuff with lower density: it has a larger fraction of icy materials.
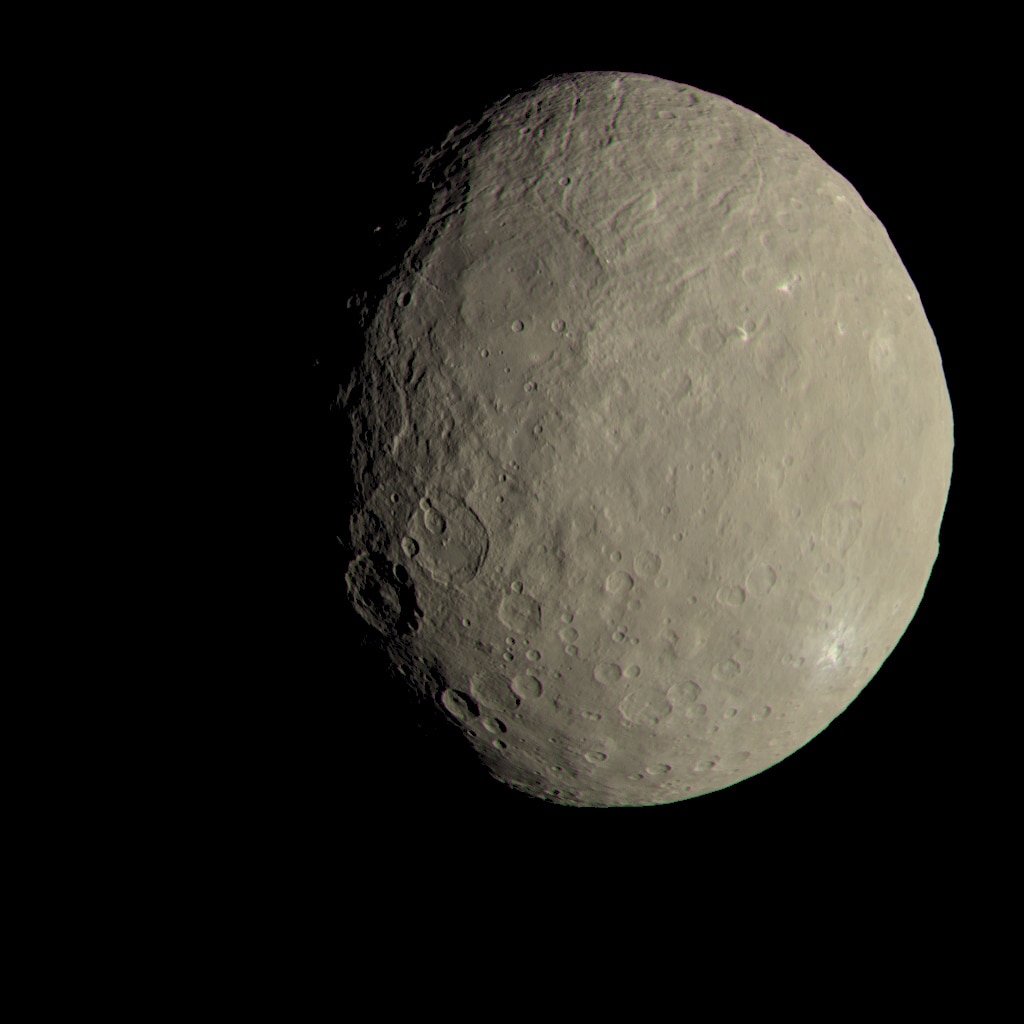
Image courtesy of
NASA/JPL-Caltech/UCLA/MPS/DLR/IDA
Let's turn our attention to the OUTSIDE of a planet -- to its surface. It is much easier to study the surfaces than the interiors; all we have to do is take pictures! And thanks to several decades of planetary probes outfitted with optical and infrared cameras, and radar systems, we have very good maps of all the terrestrial planets.
We can divide these surfaces into two groups:
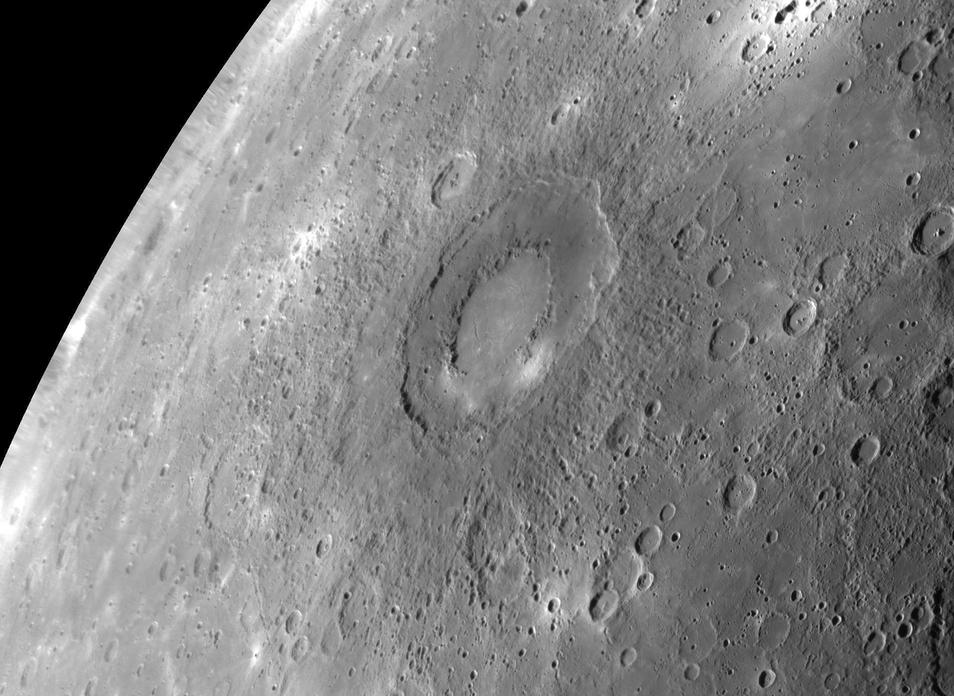
Image courtesy of
NASA/Johns Hopkins University Applied Physics Laboratory/Carnegie Institution of Washington
Image courtesy of
NASA and phys.org
We believe that early in the formation of the planets, soon after their surfaces finally cooled and hardened, there were still lots and lots of left-over planetesimals and big rocks. Those leftovers slammed into the newly formed planets very frequently, leaving lots and lots of giant craters. Planetary geologists call this period Late Heavy Bombardment.
As a result, some 4 billion years ago, all the planets would have been covered with craters of all sizes.
The cratering rate then fell as fewer and fewer rogue objects remained. There are still impacts, even today, but they are relatively rare -- especially the very large ones which leave craters more than a kilometer in diameter.
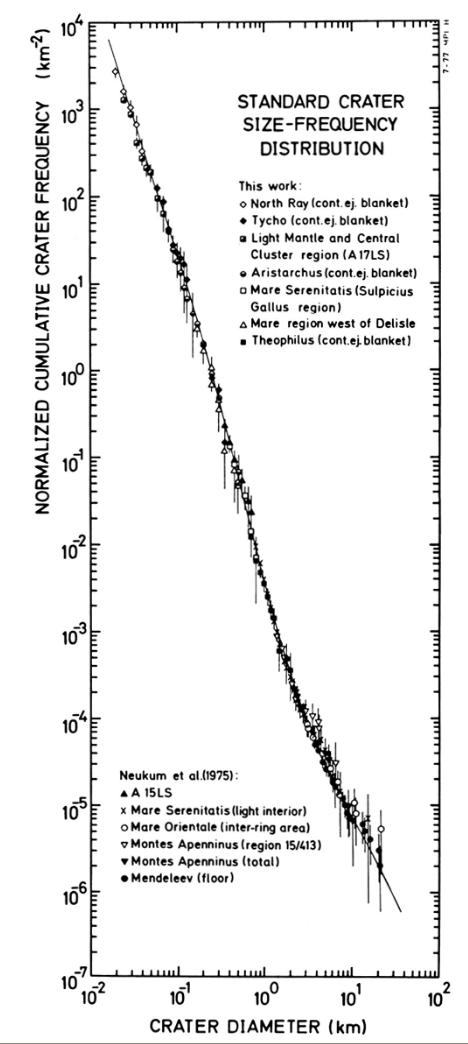
Image taken from
Measuring the age of planetary surfaces using crater statistics
by Greg Michael (2012)
So, we believe that all planetary surfaces were covered with craters about 4 billion years ago. Some surfaces still are, but others are not. Why?
Q: Why are some surfaces no longer covered with craters?
Because of three main factors:
On planets like Earth, the combined effects of wind and rain will slowly wear away the portions of craters that stick up above the surface, and gradually fill in the portions which sink below the surface.

Image of Manicougan crater courtesy of
NASA/GSFC/LaRC/JPL, MISR Team.
The gradual motion of tectonic plates can carry craters to a subduction zone, where the surface crust will be destroyed and recycled.

Image courtesy of
Kious and Tilling, USGS
When volcanoes erupt, they spew lava all over the surrounding landscape, covering the old surface with a fresh, new layer.

Image of Olympus Mons courtesy of
NASA
Over the past few decades, planetary geologists have devised a history of cratering in the Solar System. They can predict how many craters of a certain size ought to have been created on a planet's surface at any given time since the Late Heavy Bombardment.
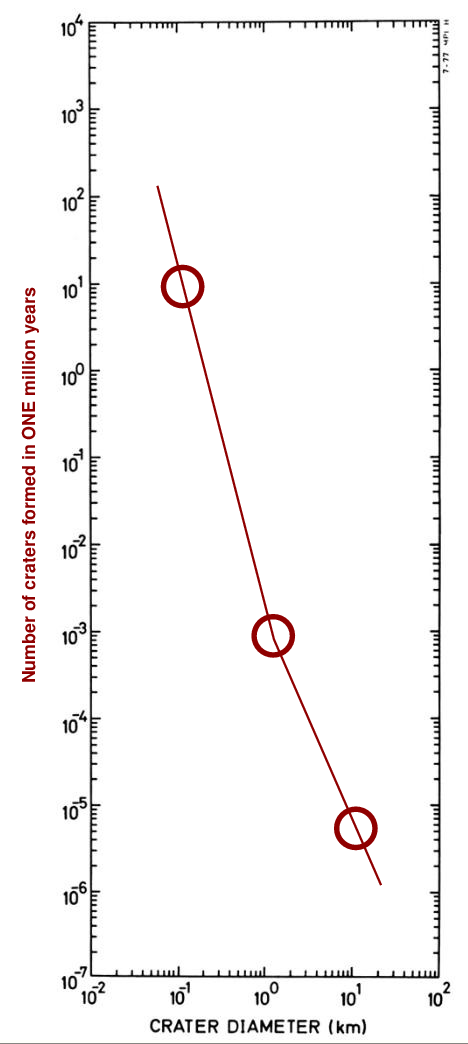
After ONE MILLION years, for example, we might have a model that predicts the following number of craters of any particular size (the figure is based on one presented in Measuring the age of planetary surfaces using crater statistics by Greg Michael (2012)).
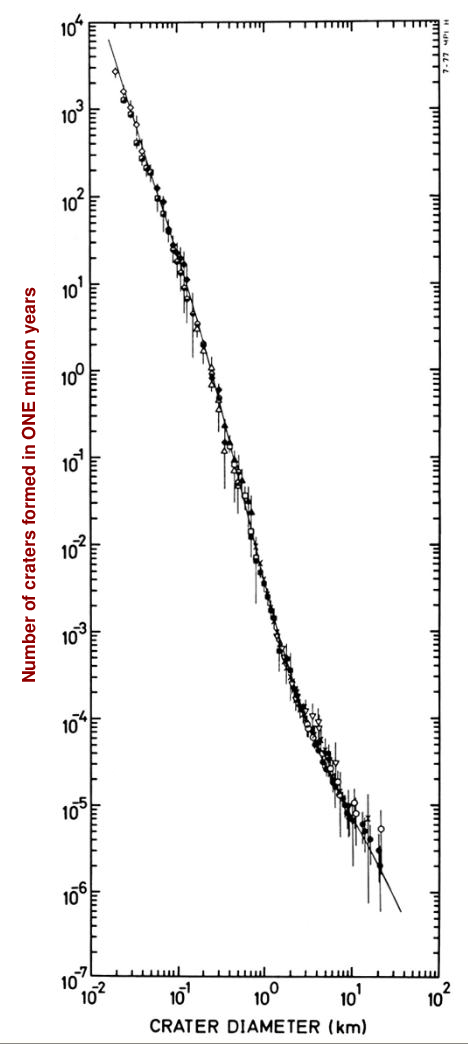
Let's simplify it a bit, by counting only the craters of size 0.1 km, 1 km, and 10 km.
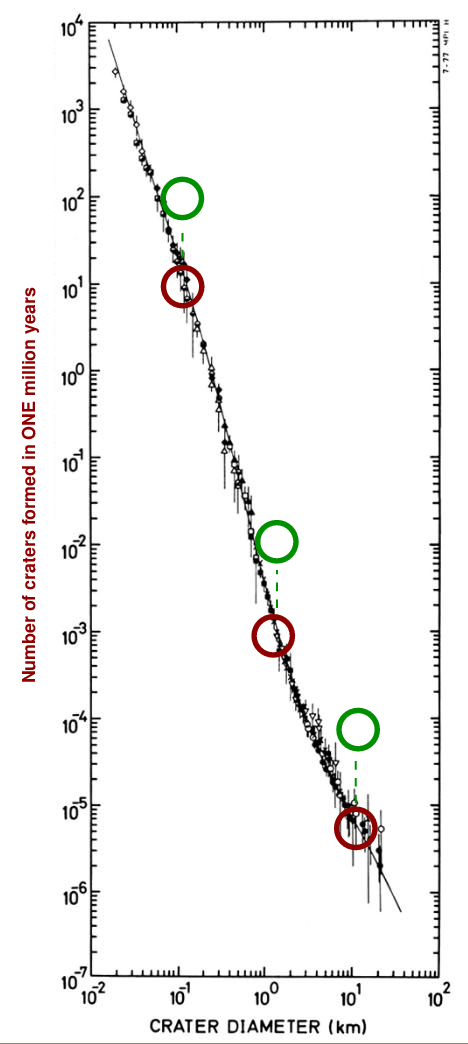
  Q:  How many craters of size 0.1 km should form in 1 million years?

  Q:  How many craters of size 1 km should form in 1 million years?

  Q:  How many craters of size 10 km should form in 1 million years?
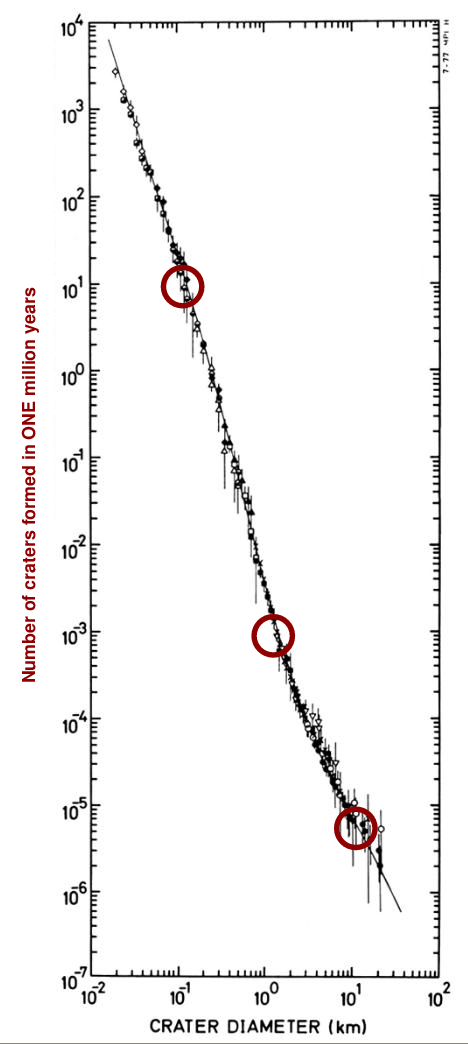
We can connect these three measurements with simple line segments and still match the complicated data pretty closely.
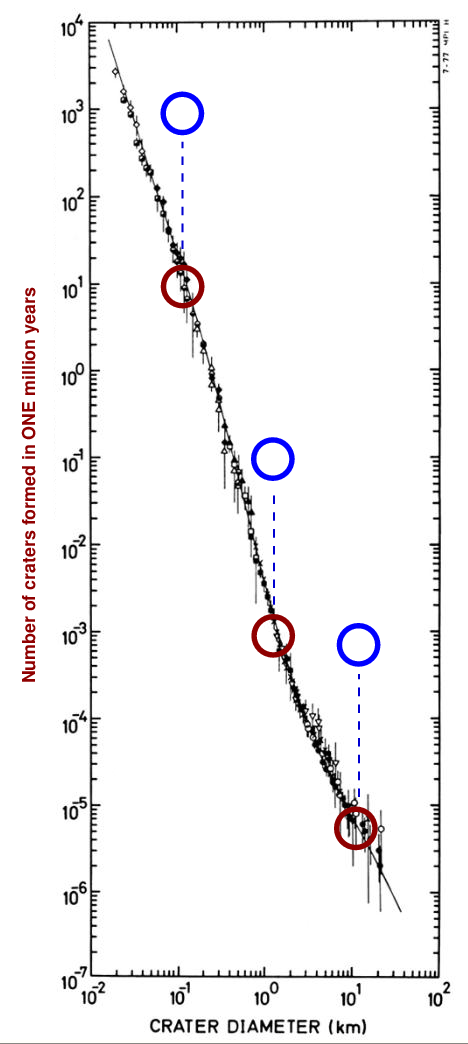
Now, if we allow more time to pass, more craters ought to be formed. Suppose that the cratering RATE remains constant. If we wait for TEN MILLION years (instead of just one million), then how many craters should be formed?
  Q:  How many craters of size 0.1 km should form in 10 million years?

  Q:  How many craters of size 1 km should form in 10 million years?

  Q:  How many craters of size 10 km should form in 10 million years?
We can again simplify to show what we ought to see after ten million years.

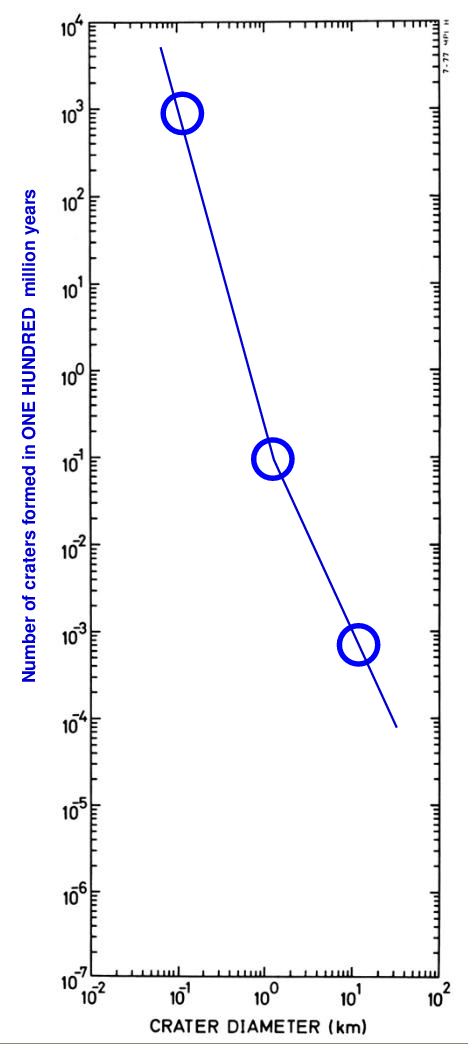
Keep going! If we wait for ONE HUNDRED MILLION years (instead of just one million), then how many craters should be formed?
  Q:  How many craters of size 0.1 km should form in 100 million years?

  Q:  How many craters of size 1 km should form in 100 million years?

  Q:  How many craters of size 10 km should form in 100 million years?
I hope you'll believe me when I say that if we were to wait for ONE BILLION (= one thousand million) years, we would see this many craters:
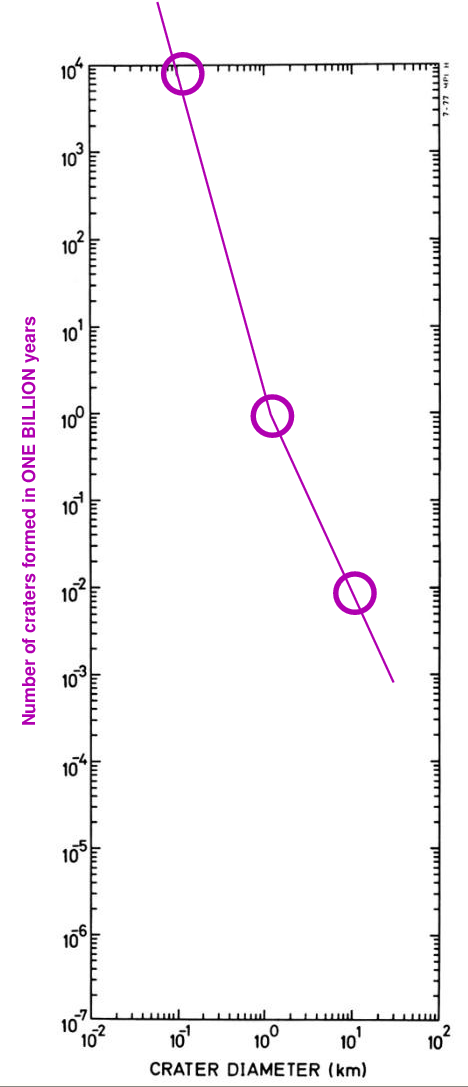
The result is clear: if we wait for longer periods of time, the relative number of craters of different sizes remains the same ... but the absolute numbers keep increasing. In other words, the lines connecting the measurements appear to slide up and to the right on our graph:
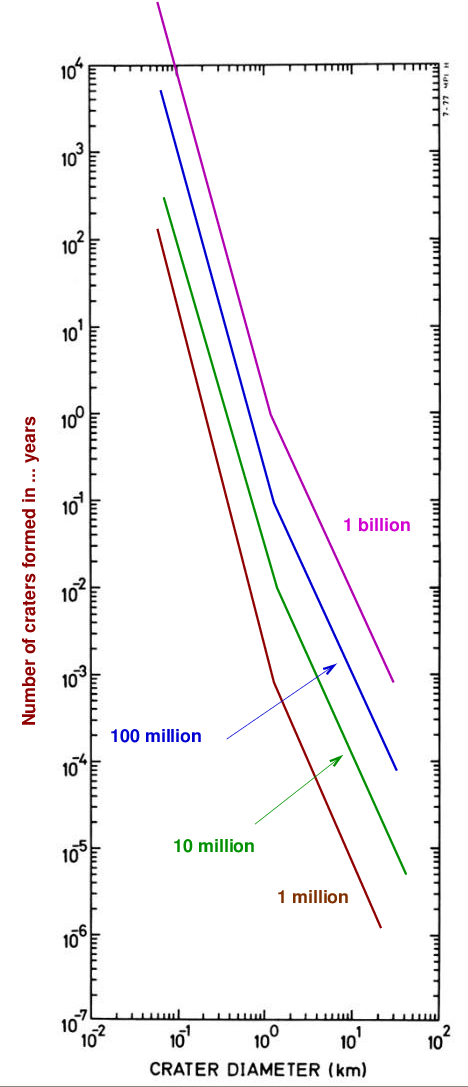
So, if we can measure the number of craters of a certain size really are on a planet's surface, we can estimate the age of that surface.
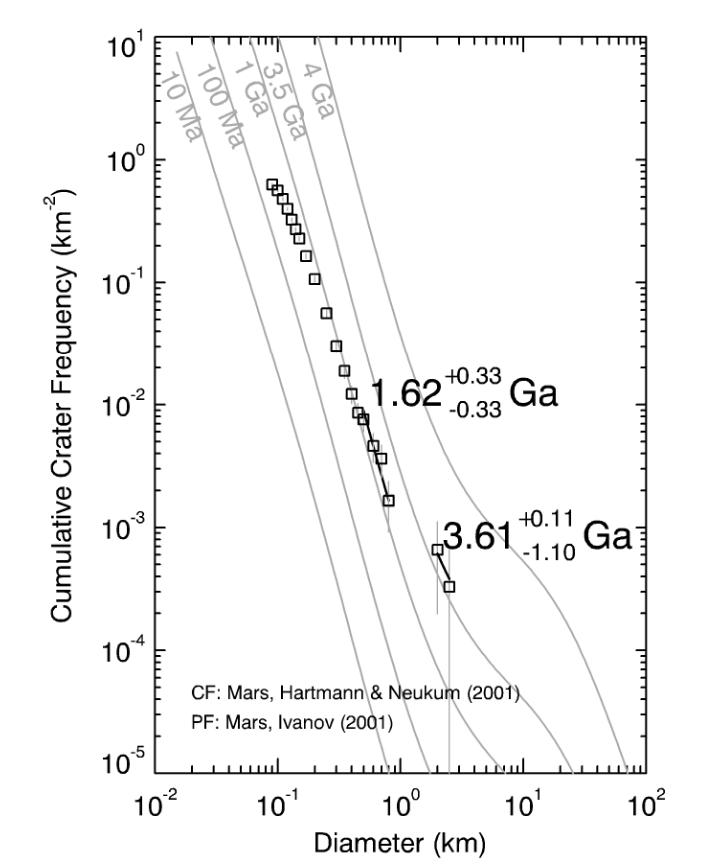
Image taken from
Measuring the age of planetary surfaces using crater statistics
by Greg Michael (2012)
All it takes, then, in order to determine the age of some planetary surface is a careful count of the number of craters of different sizes. There are plenty of images of all the major planets -- that's easy. The hard part is finding people willing to spend hour after hour, counting the craters.
The Moon Zoo project gave that task to hundreds of eager volunteers. Ordinary people could participate in the scientific effort, helping to count craters in a set of lunar images. And, as a study showed, well-trained volunteers were just about as good as experts.
Copyright © Michael Richmond.
This work is licensed under a Creative Commons License.

