 Copyright © Michael Richmond.
This work is licensed under a Creative Commons License.
Copyright © Michael Richmond.
This work is licensed under a Creative Commons License.
Today, we'll focus on one small aspect of GW astronomy: the merger of two neutron stars, or NS-NS merger, for short. Why? Well, unlike the merger of two black holes, an NS-NS merger will create electromagnetic radiation in addition to gravitational waves. That means that we can observe such an event with different types of telescopes (radio, X-ray, optical, IR, as well as gravitational wave detectors).
In addition, one of the most exciting events of the last few years was the discovery, and followup, of a NS-NS merger in August, 2017. Although some people have unfortunately made exaggerated claims about the collision,

Front page of
an article on FiveThirtyEight
it is true that astronomers around the world worked together to study this ephemeral source. So, let's take a closer look at it, and see what we might learn about the effort required to study similar events in the future.
GW 170817 was found during observing run "O2" of LIGO and Virgo, after (roughly) one year of scanning the sky.
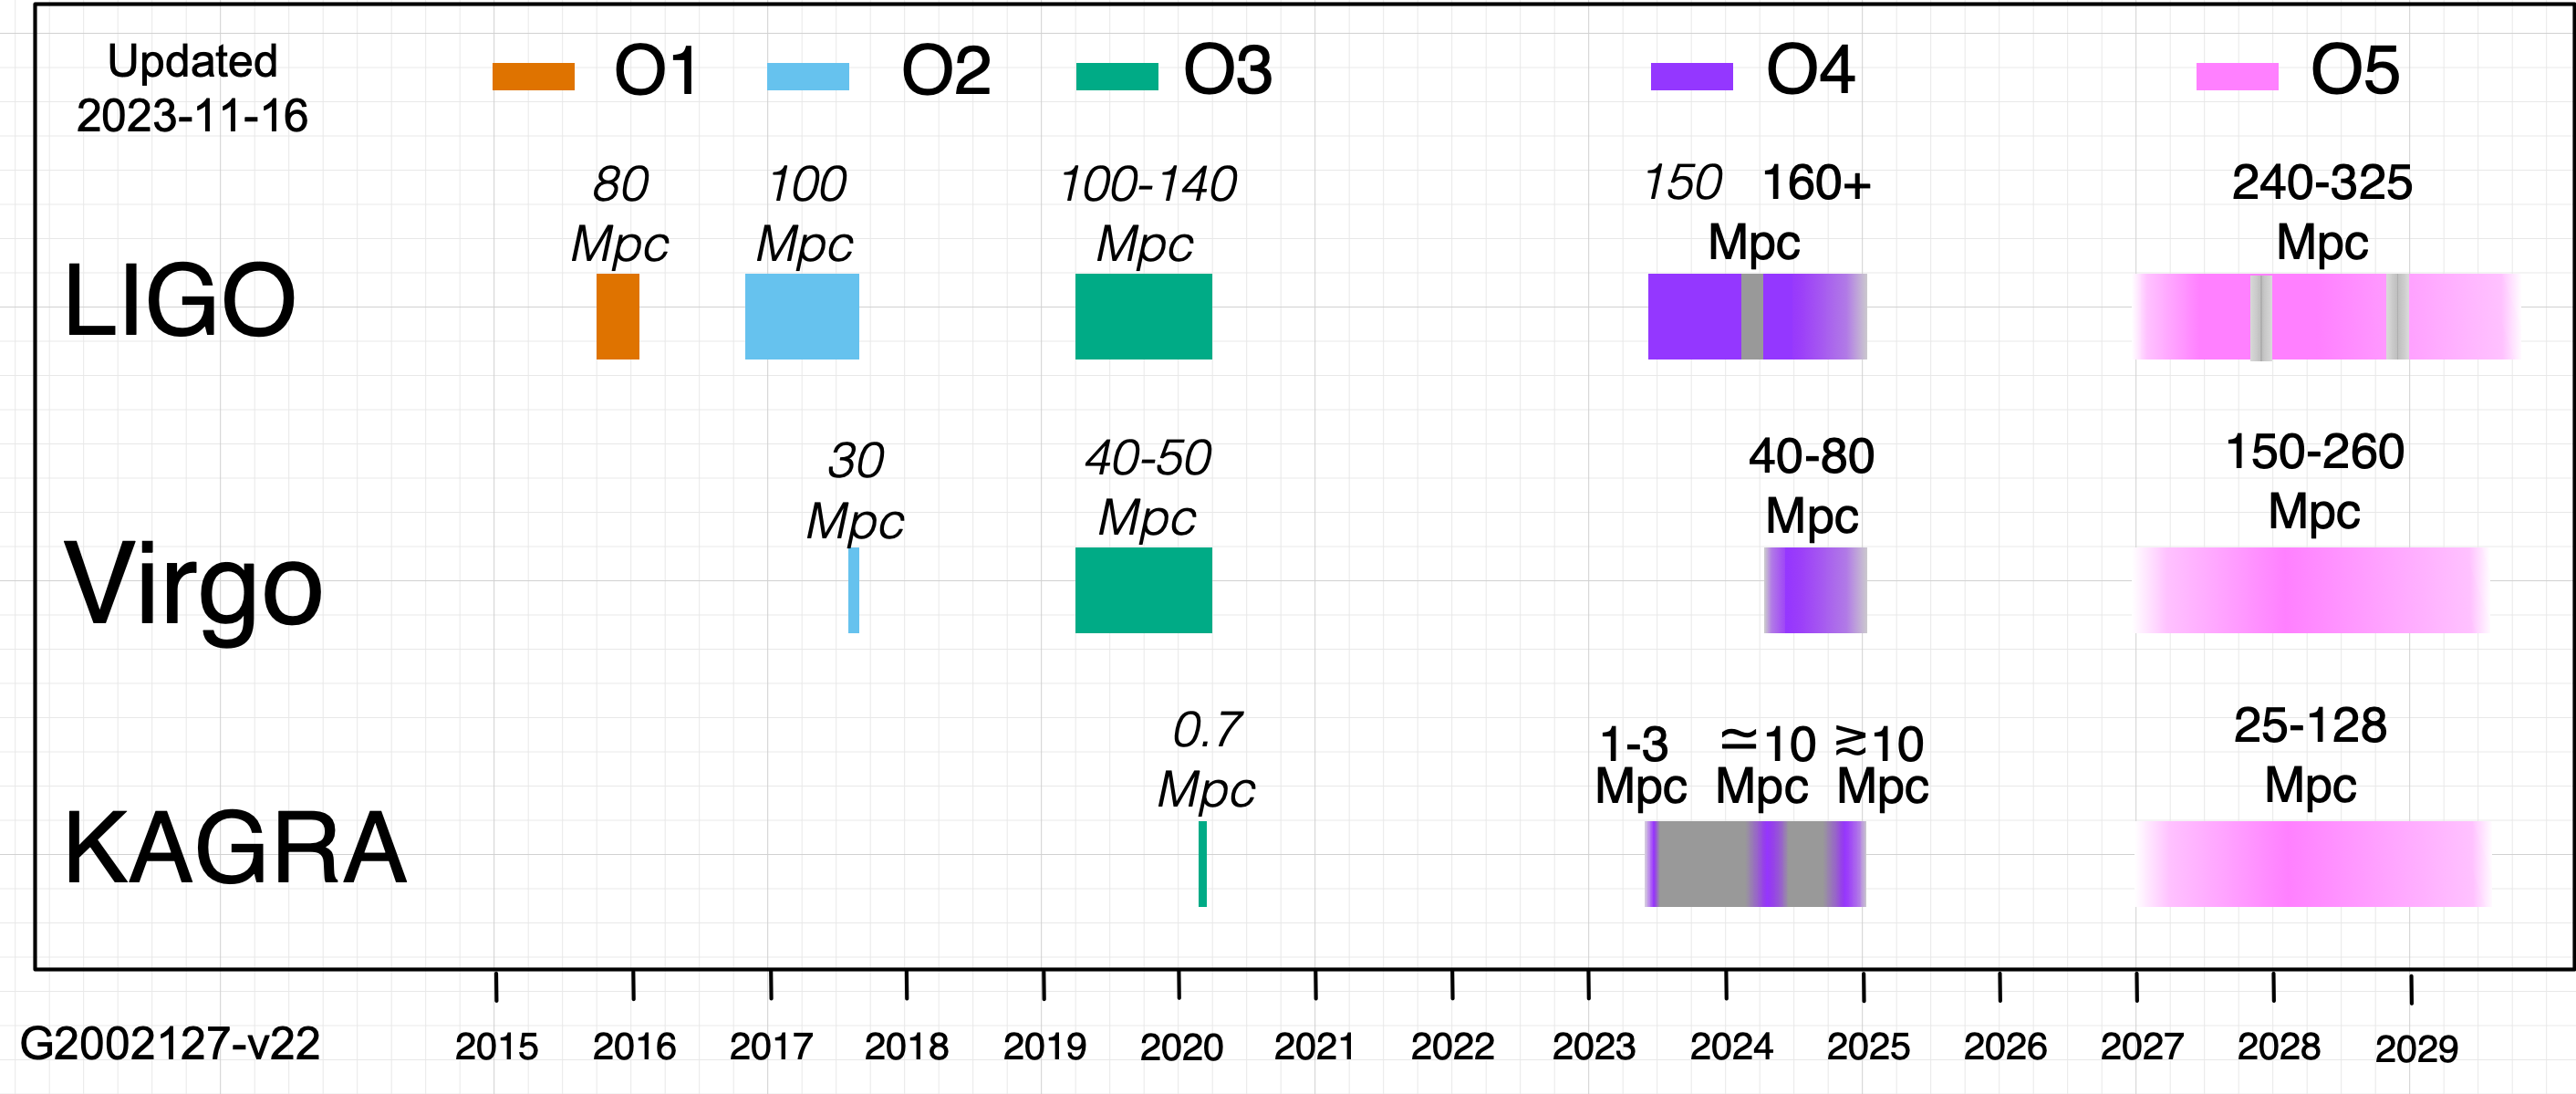
Image courtesy of
LIGO Collaboration
Does that mean that we can expect to find roughly one such NS-NS merger each year? What exactly is the rate at which this sort of event occurs in the local universe?
Well, that turns out to be a very complicated question. It depends on a LOT of quantities which are rather difficult to measure precisely:
In addition to figuring out how frequently mergers occur, we need to compute how far out we could see mergers. That means we need to understand the sensitivity of our detectors very well.
It turns out, not surprisingly, that putting all these pieces together is a lot of work. If you don't believe me, check out slides 10-22 of a presentation by Paolo D'Avanzo.
The Good News is that we have some additional information. GW 170817 was not the first NS-NS merger to be observed; it was the first NS-NS merger from which gravitational waves were detected. But NS-NS mergers produce lots of electromagnetic radiation, too. In particular, they are thought to be responsible for short Gamma Ray Bursts (sGRB). Thanks to a number of GRB satellites, astronomers have found quite a few likely NS-NS mergers over the past two decades. The table below shows the most likely NS-NS events in the upper portion of the table, with events more likely to have different progenitors in the lower portion.
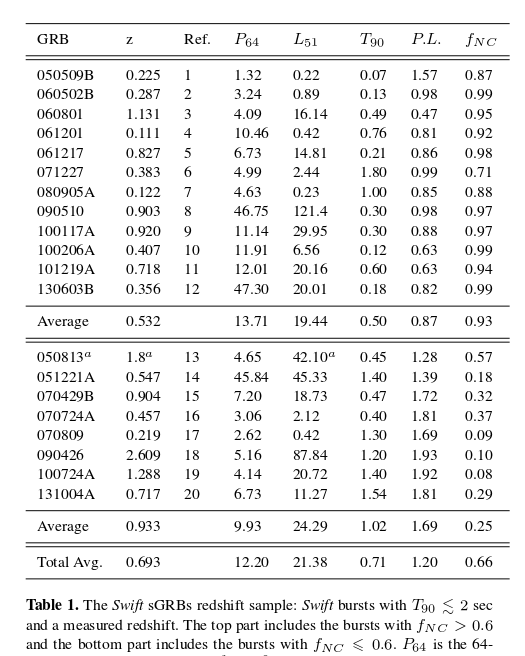
Table 1 taken from
Wanderman and Piran, MNRAS 448, 3026 (2015)
Note the redshifts of these sources: the mean of the most likely NS-NS mergers is around z = 0.5. That's ... pretty far away, and leads to two additional complications ("Bad News").
First, these objects are typically so far away that they will appear very faint when observed from Earth. Second, it means that we have to add evolution of stellar populations with redshift to our list of "factors involved in the rate calculation."
Ugh.
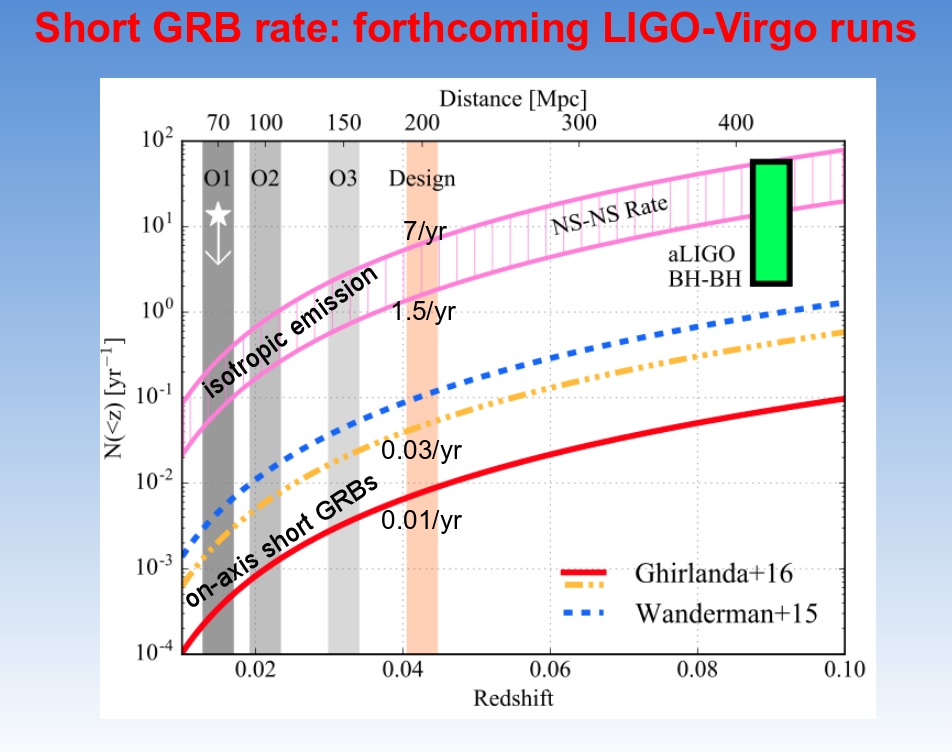
Nonetheless, scientists who have a lot of patience have managed to take all these factors into account, and have derived estimates for the rate at which NS-NS mergers ought to occur. In the diagram below, the pink region represents the rate of mergers, but the lines represent the number of events we actually would see with gamma-ray telescopes.
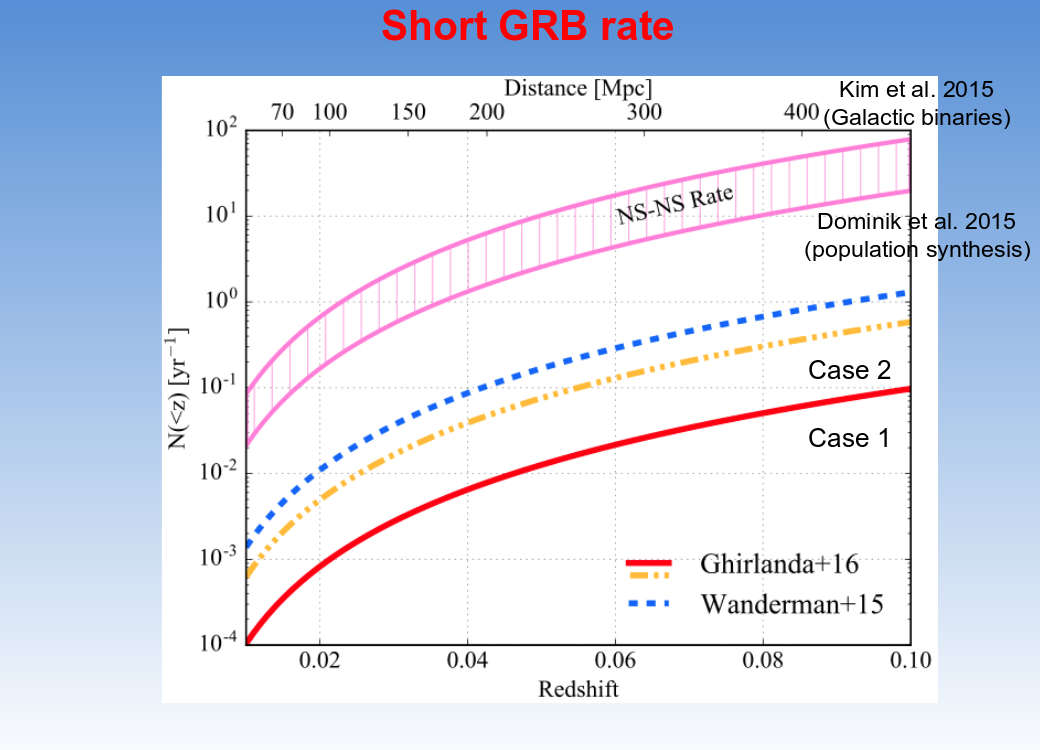
Slide 14 from
a presentation by Paolo D'Avanzo, given at
Eighth Huntsville Gamma-Ray Burst Symposium, 2016
  Q:  Why should we observe only one tenth or fewer
         of the events?  Is there some feature of these
         mergers which affects their gamma-ray visibility?
The answer is, yes, there is an important factor: beaming. When neutron stars merge, models suggest that much of the initial energy is emitted in narrow beams. If that beam happens to point toward Earth, we see a bright GRB. If that beam happens to point in some other direction, we see a faint GRB.
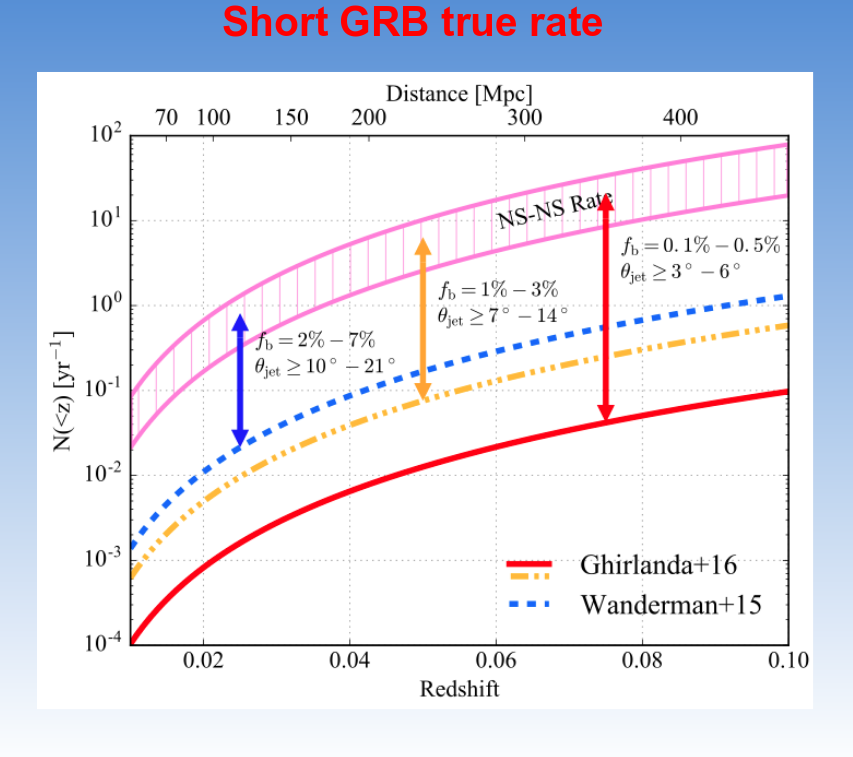
Slide 16 from
a presentation by Paolo D'Avanzo, given at
Eighth Huntsville Gamma-Ray Burst Symposium, 2016
  Q:  Should we expect to see many sGRB events each year
             at small redshifts, z < 0.05?
No, probably not. Yet it is only those NS-NS mergers at small distances that LIGO can detect.
Slide 19 from
a presentation by Paolo D'Avanzo, given at
Eighth Huntsville Gamma-Ray Burst Symposium, 2016
How far from us was GW 170817? It occurred in the galaxy NGC 4993.
Q: What is the redshift of NGC 4993? Hint, hint.
Golly! A redshift z = 0.009727 is so small that this merger happened within our local corner of the universe. It seems that we were pretty lucky.
  Q:  What is the distance (in Mpc) corresponding to redshift z=0.009727?
            (Hint, hint)


  Q:  What is the distance modulus (in mag) corresponding to this distance?
Let's pause for a moment to think about the names sometimes used to describe the optical result of a NS-NS merger: kilonova, macronova, or r-process supernova. What is the source of these names, and what do they really mean?
The word "nova" has been used by astronomers to refer to a particular sort of explosion. If a white dwarf is in a very close binary orbit with a main-sequence companion, it may collect gas from the companion in an accretion disk; that material will eventually fall onto the surface of the white dwarf.
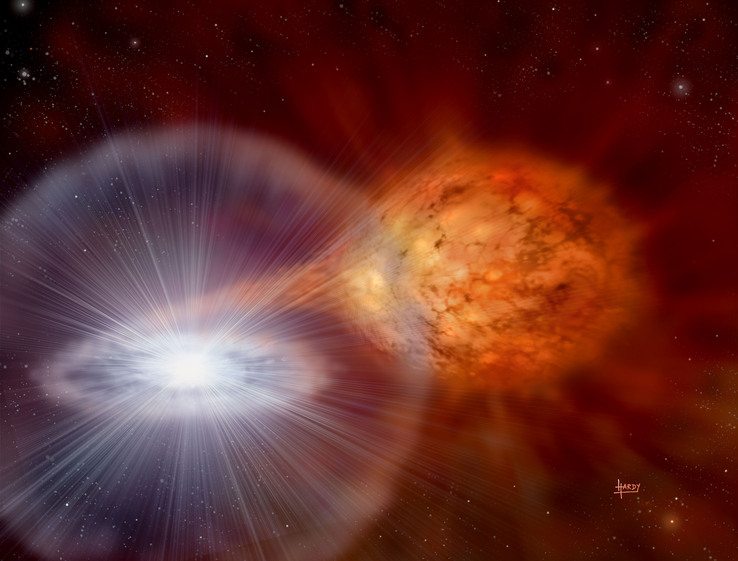
Image hosted at
APOD
and copyright
David Hardy
and
PPARC
As hydrogen-rich gas covers the surface of the white dwarf, the intense gravity of the dwarf compresses it, and incoming gas keeps it very hot. Under certain conditions, a thin layer of the material may undergo runaway nuclear fusion. But it's only that thin layer which is affected and blown off into space -- the rest of the white dwarf remains behind.
The explosion of this layer of material sends hot gas flying into space at high speed, forming a glowing fireball that reaches absolute magnitudes of around MV = -5 to -9. Over the course of several weeks, the fireball expands and cools and gradually fades away. We call this brief but very luminous event a nova.
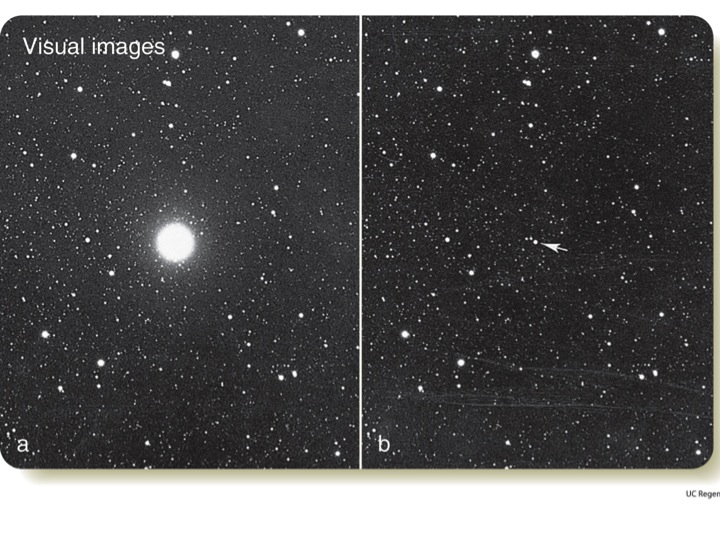
Images of Nova Cygni 1975 (after/before) courtesy of
Mark Kridger
There are two types of much larger explosions involving stars. In one, a massive star runs out of fuel at its center, the core collapses, and a portion of the envelope is heated and blown off into space; in the other, a white dwarf accretes too much material from a binary companion, exceeds the Chandrasekhar limit, and thus its entire body (not just a surface layer) undergoes runaway thermonuclear reactions, causing the entire object to blow up. We call these supernovae, because they are far more luminous than an ordinary nova; their absolute magnitudes have a large range, but are typically MV = -17 to -20.
A merger of neutron stars produces an optical lightshow which lies somewhere in between. One can divide the NS-NS event into two pieces, if one wishes, based on the source of the energy being emitted:
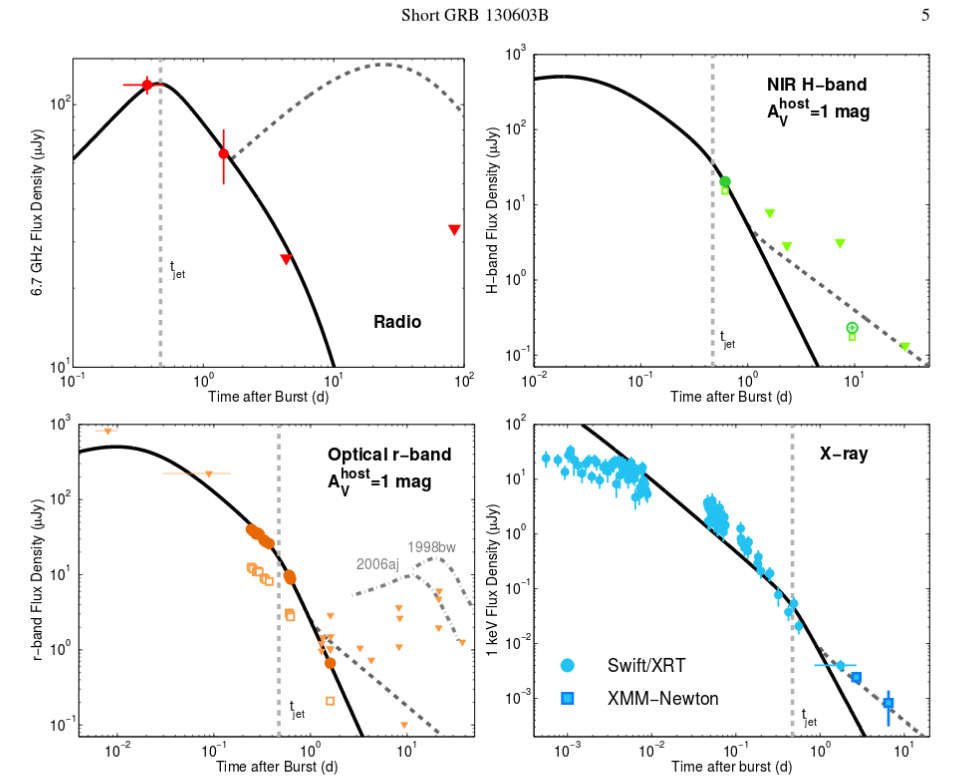
Figure 2 taken from
Fong et al., ApJ 780, 118 (2014)

Figure 2 taken from
Tanvir et al., Nature 500, 547 (2013)
It's not exactly clear which of these yields the peak luminosity; it may vary from one merger to another. But the theorists and observers agree that a NS-NS merger should be much, much more luminous than a typical nova. Metzger et al., MNRAS 406, 2650 (2010) coined a term in their abstract which has caught on:
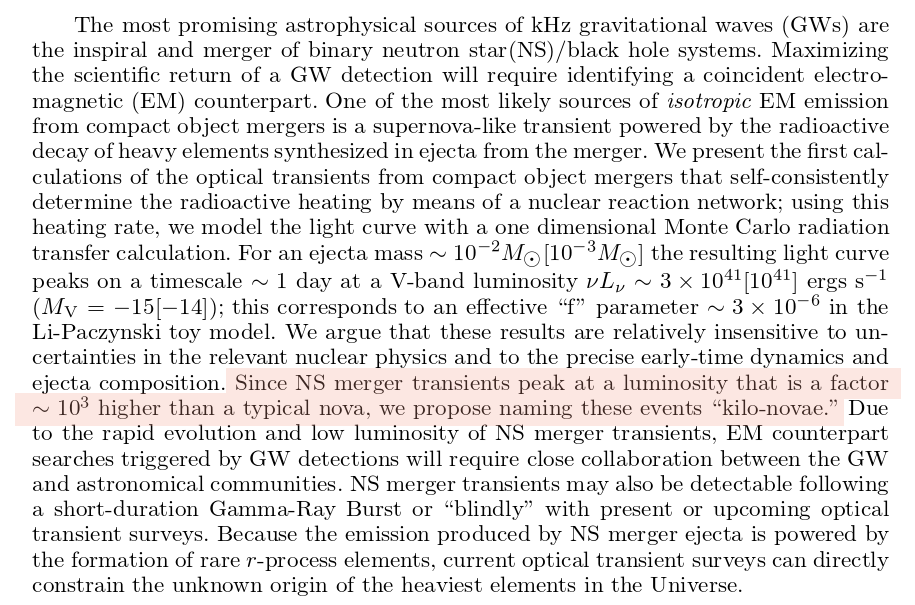
Abstract from
Metzger et al., MNRAS 406, 2650 (2010)
  Q:  If a luminous true nova has MV = -9,
          and a kilo-nova is 1000 times more luminous,
          what is the absolute magnitude of a kilo-nova?
The term macronova is, I guess, based on the same idea that a NS-NS merger results in something "bigger" than a typical nova. The more precise r-process supernova distinguishes between ordinary supernovae -- which are powered primarily by fusion up to (and nuclear decay products down from) the iron-group elements, and NS-NS mergers, in which the (late-time) power derives primarily from the radioactive decay of elements much heavier than iron.
Just what is the "r-process?" A short answer is "nuclear reactions involving a surfeit of free neutrons." It seems quite logical that a collision of NEUTRON stars ought to result in such reactions, doesn't it? For a much better answer, read this article by Bradley S. Meyer:
The periodic table below shows the mechanism which likely created most of the atoms of each particular element. Note the large number of heavy elements which for which the origin is described as due to "merging neutron stars."
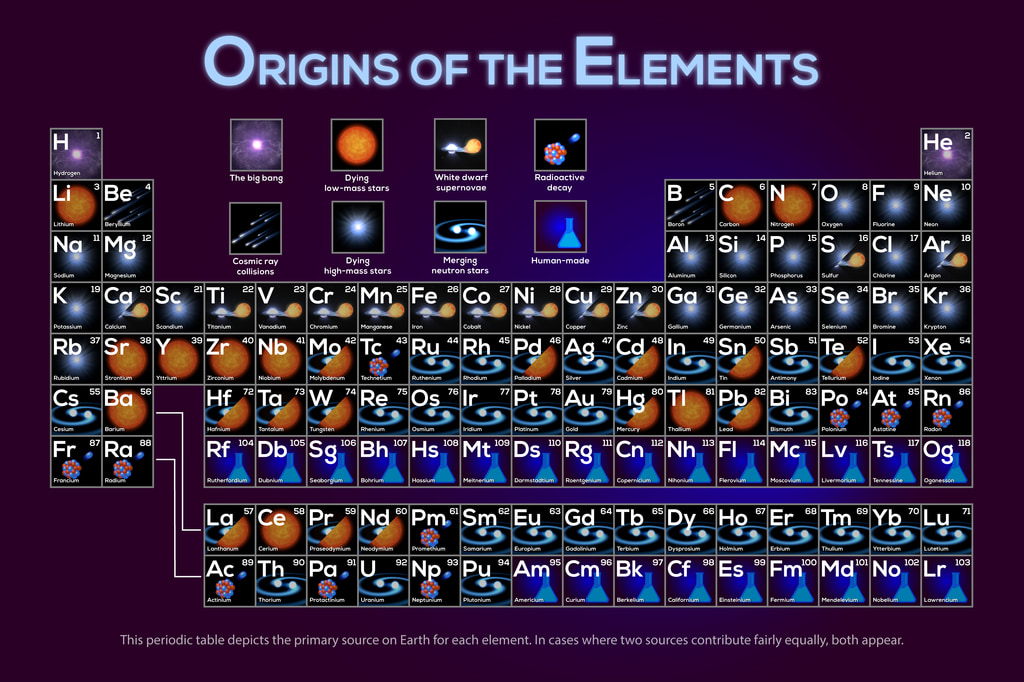
Image courtesy of
NASA's Goddard Space Flight Center
Let's now consider the optical brightness of the merger. This first detection turned out to be rather close to the Earth, making it appear brighter than the typical NS-NS merger might be in the future. We can use the measured properties of this first event to estimate what we might see when more distant mergers occur in years to come.
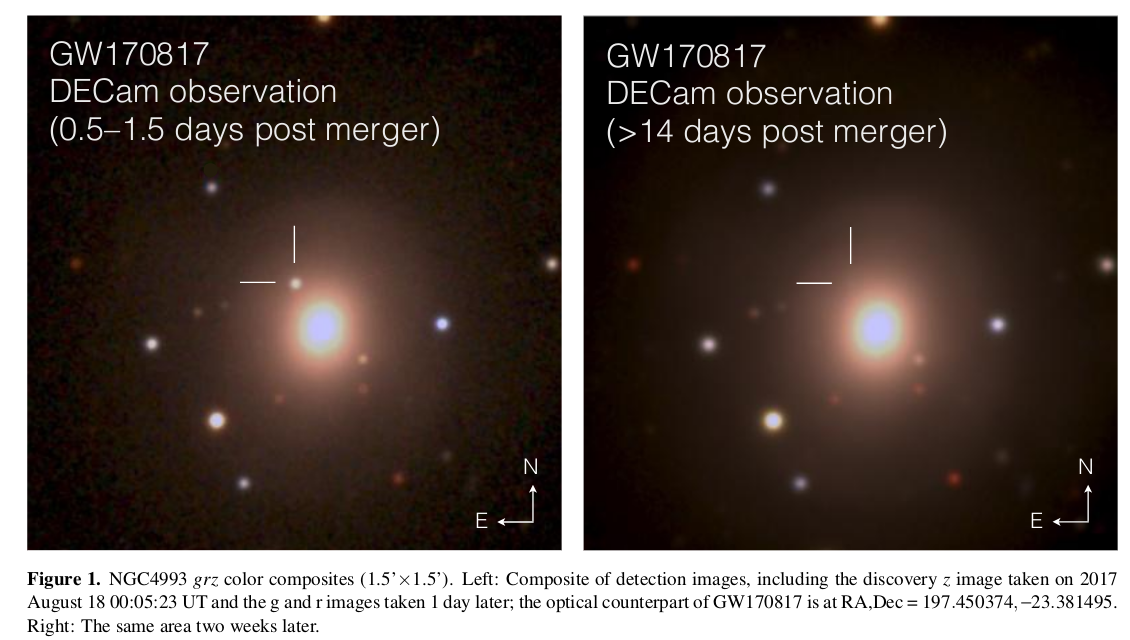
Figure 1 taken from
Soares-Santos et al., ApJ 848, L16 (2017)
What was the peak apparent brightness of GW 170817? Look at the V-band symbols in the light curves below.
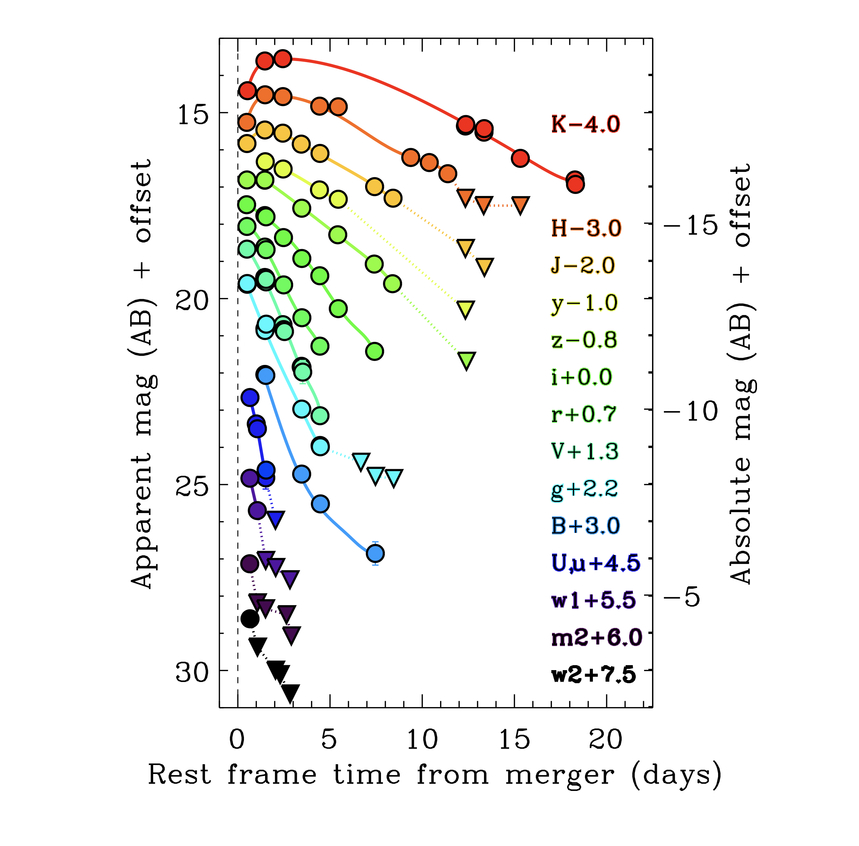
Swope + Magellan photometry of GW 170817,
Figure 2 taken from
Drout et al., arXiv 1710.05443 (2017)
  Q:  What was the peak apparent magnitude of GW 170817
          in the V-band, m(V)?


  Q:  Does that agree with the expected peak brightness of
          a kilonova at distance modulus 33.1 mag?
Our first job will be to figure out how many photons a telescope can collect from an object of this apparent magnitude. The V-band magnitude zero-point can be found in several places ...
  Q:  How many photons per sq. cm. per second per Angstrom
              are produced by an object of magnitude m(V) = 0?
Now, the V-band covers quite a range of the optical spectrum. You can find a description of it in Bessell, PASP 102, 1181 (1990). I've placed a copy in simple ASCII format here.
We can for rough purposes replace the real, curvy passband with an "equivalent" version which is a simple rectangle having the same area.
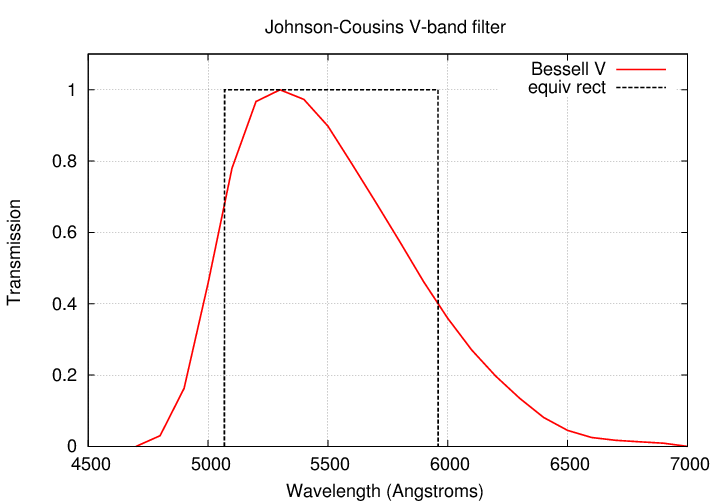
That equivalent V-band has the properties
  Q:  How many photons per sq. cm. per second
              are produced by an object of magnitude m(V) = 0
              integrated over the entire V passband?
Yes, yes, the real answer depends on the shape of the spectrum of the object, and requires a proper convolution. But we're doing rough calculations today.
  Q:  How many photons per sq. cm. per second
              are produced by an object of magnitude m(V) = 17
              integrated over the entire V passband?
Okay, that doesn't sound like many photons. Fortunately, we choose to study the sky by using telescopes, which collect photons over a large area and concentrate them on our detectors. Consider two telescopes: a "small" one of diameter 1 meter, and a "large" one of diameter 10 meters.
                      small (D = 1m)          large (D = 10m)
 -----------------------------------------------------------------

   area (sq.cm.)

   N photons/sec

 -----------------------------------------------------------------
Well, that's better. And, indeed, if one wishes to measure the total light emitted by an object of magnitude V=17, then even a relatively small telescope can do a good job (if one places it at a good, dark site with decent seeing).
But suppose we want more information: not just photometry, but spectroscopy. If we plan to break the light up into a wide range of bins based on wavelength, then the number of photons arriving in each bin might be smaller.
Just how wide should the bins be? On the one hand, narrow bins (= high spectral resolution) will allow us to identify features due to individual elements and transitions; on the other hand, they break the light up into more chunks. In the case of a NS-NS merger, it turns out that the violence of the explosion causes the ejecta to fly outward at very high speed, imparting a high Doppler shift to light emitted by the ejecta. For example, in a supernova, the optical spectrum near maximum light can look like this:
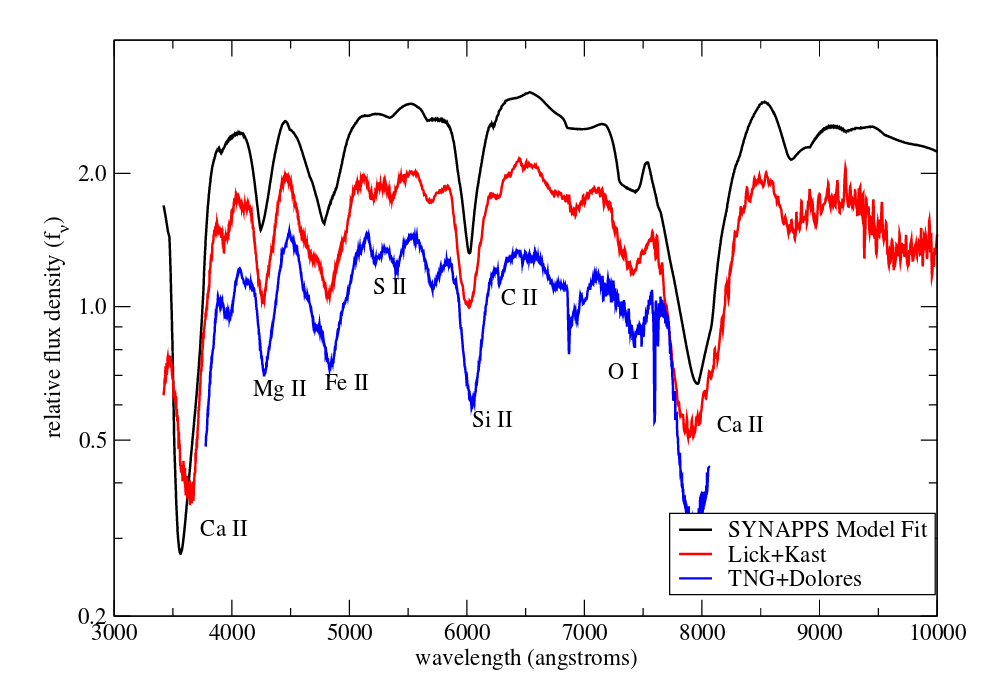
Figure 5 taken from
Nugent et al., Nature 480, 344 (2011)
  Q:  The full width of these lines is very roughly 200 Angstroms;
           that means that half-width (from center to edge)
           is maybe 100 Angstroms.

      Estimate the speed of the gas emitting (and absorbing)
           these spectral features.
In the case of such violent explosions, one doesn't need high spectral resolution, because any real features from the ejecta will be smeared out over a wide range of wavelengths. So, we might consider using pretty low spectral resolutions.
   Q:  Suppose we break up the photons arriving in the V-band
          (covering 890 Angstroms) into bins of width w.

          How many photons per second will arrive in each bin?


                  small telescope (D = 1m)       big telescope (D = 10m)
----------------------------------------------------------------------------

   unbinned

  w = 100 Angstrom

  w =  10 Angstrom

----------------------------------------------------------------------------
This still looks pretty good. However, in real life, spectrographs are complicated devices. They tend to have many mirrors and fibers and prisms and gratings, each of which may scatter or absorb a small fraction of the light which strikes it.
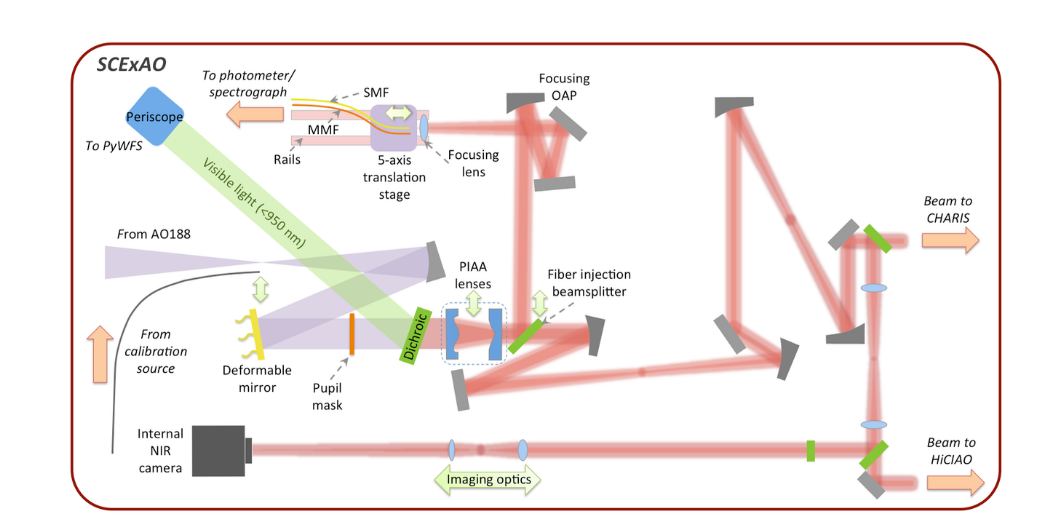
Schematic diagram of SCExAO taken from Figure 1 of
Jovanovic et al., Optics Express 25, 17753 (2017)
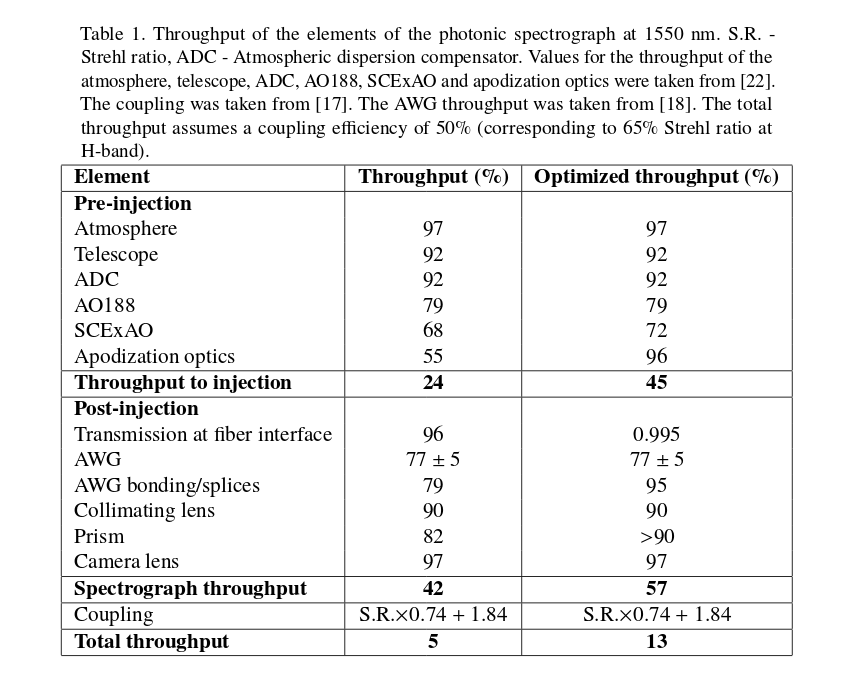
Table 1 of
Jovanovic et al., Optics Express 25, 17753 (2017)
In the end, a typical spectrograph only records a few percent of the incoming light with its detector. Yikes!
Suppose we adopt a figure of efficiency = 5% for the spectrograph we are using. What are the number of photons per second in each bin now?
   Q:  Adopt an efficiency of 5% for the spectrograph.

          How many photons per second will arrive in each bin?


                  small telescope (D = 1m)       big telescope (D = 10m)
----------------------------------------------------------------------------

  w = 100 Angstrom

  w =  10 Angstrom

----------------------------------------------------------------------------
Uh-oh. This isn't many photons at all. Is there some way we can increase the number?
Of course. We can just integrate for a long time. Let's use an exposure time of T = 1000 seconds. That will allow us to build up a largeish number of photons within each wavelength bin.
Oh, and let's do an additional calculation. As you may know, celestial sources are (almost always) examples of random Poisson processes. Photons arrive from the sources in a manner that leads to a simple relationship between the mean number of collected photons in some detector, and the uncertainty in that mean value.
Now, if we wanted to perform a proper estimate of the signal-to-noise ratio for this event, we'd have to account for a number of different sources of noise. Remember this?
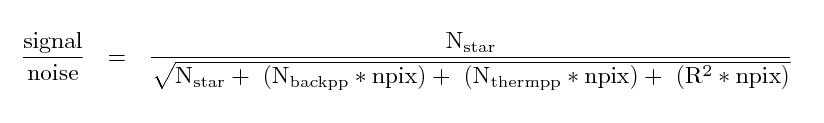
Well, let's take the best-case scenario: let's just pretend that
so that the only source of noise is the Poisson statistics of the kilonova itself.
So, please fill in the table now, assuming an exposure time of T = 1000 seconds.
    Q:  Compute the number of photons in each bin integrated over
           the exposure (N), the uncertainty in that number (sig),
           and the percentage uncertainty (p = 100% * sig/N)


                  small telescope (D = 1m)       big telescope (D = 10m)

                          N      sig     p             N      sig     p
----------------------------------------------------------------------------

  w = 100 Angstrom

  w =  10 Angstrom

----------------------------------------------------------------------------
Phew. If we do exposure for a long time, then we can build up a good signal-to-noise ratio within even relatively small bins. What is clear is that "small" telescopes aren't going to work very well; spectroscopy of NS-NS mergers like this requires "big" telescopes.
The spectra below were gathered with the VLT and Gemini telescopes: those are "large", over 8 meters in diameter each. The shaded regions mark wavelengths at which the atmosphere blocks most of the incident light from space.
At early times, the spectra seem to have plenty of signal, but as the kilonova fades, the spectrum becomes much noisier ... (click on the figure to see a full version). And the entire duration is just 9 days.
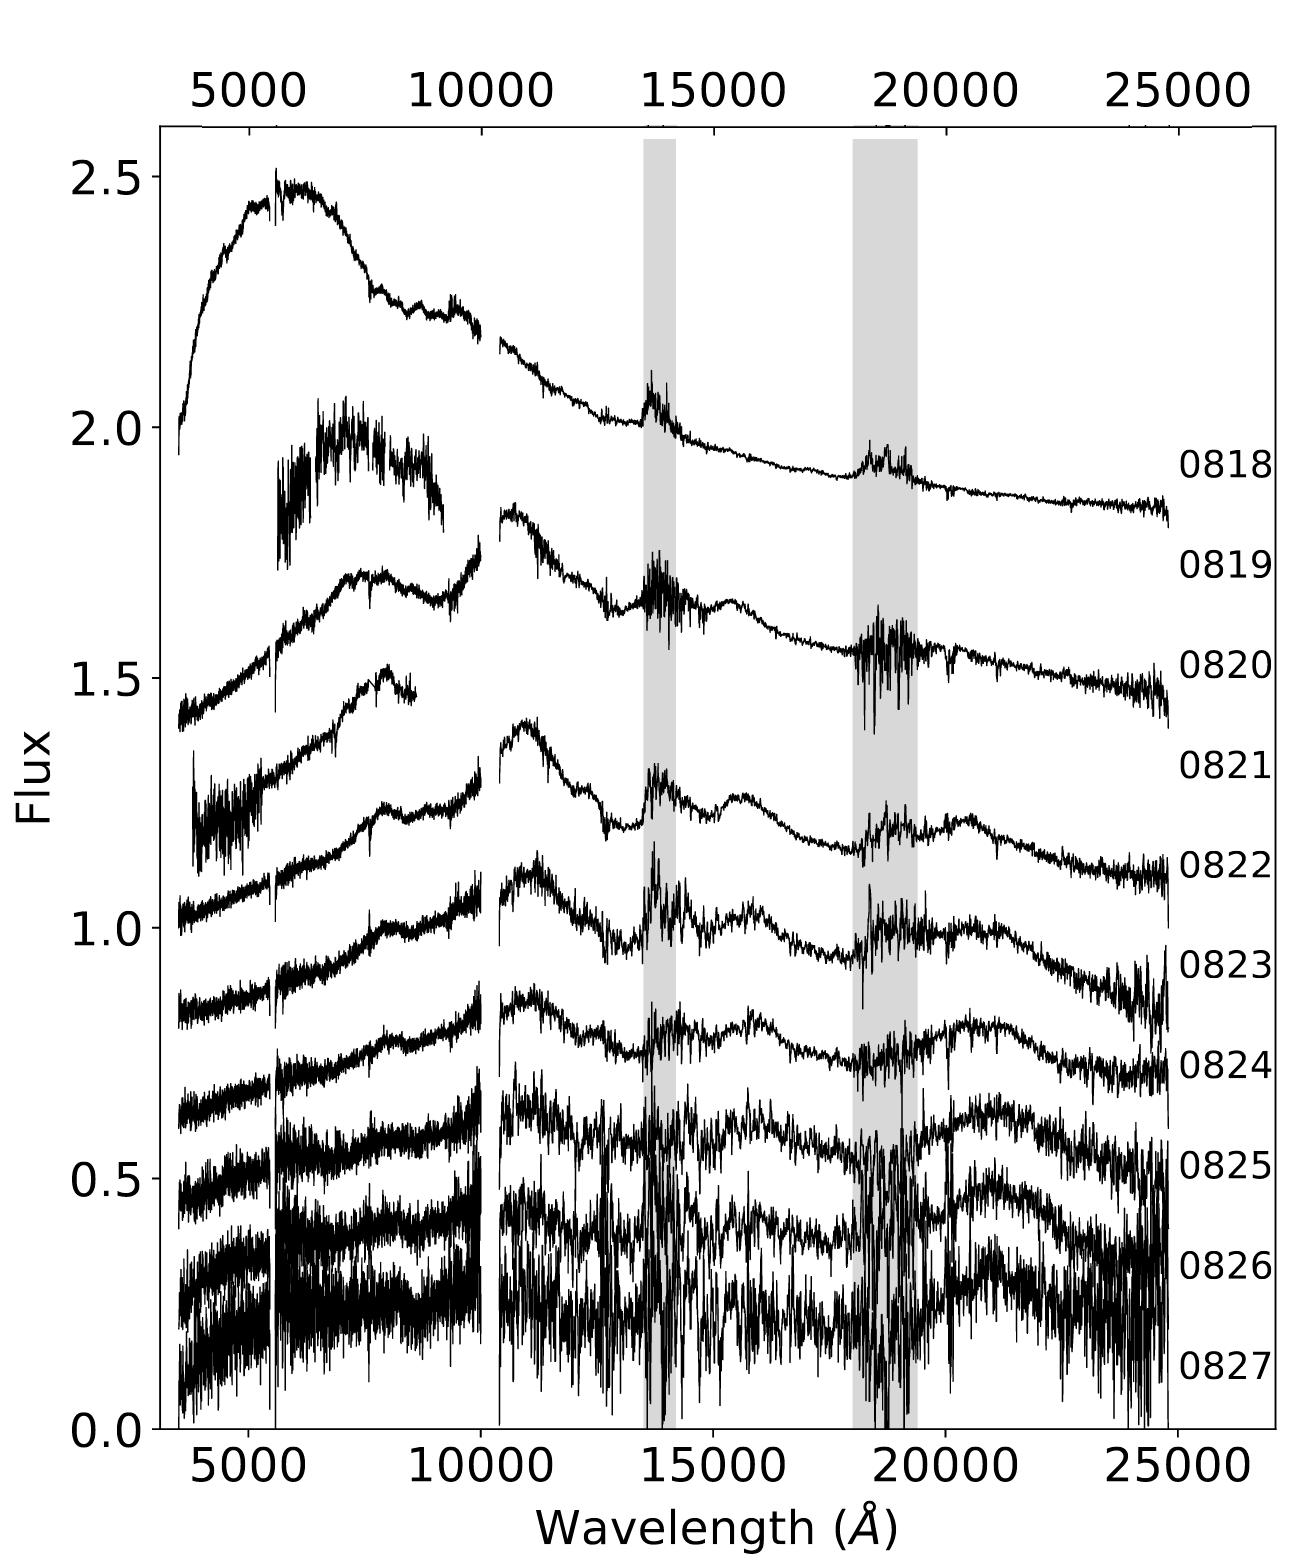
Cropped portion of Figure 2 taken from
Pian et al., arXiv 1710.05858 (2017)
Just how well can we compare "features" in the observed spectrum to those computed in model spectra of NS-NS mergers? Well, judge for yourself: look at the figure below, taken from Nicholl et al., ApJ 848, L18 (2017).
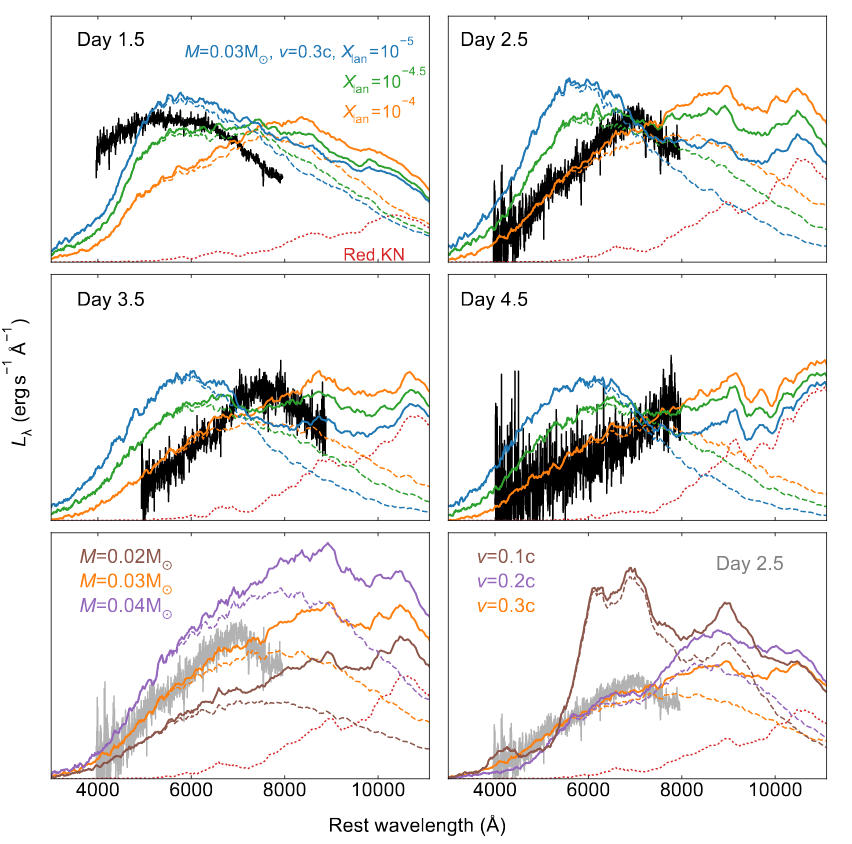
Figure 4 taken from
Nicholl et al., ApJ 848, L18 (2017).
See this paper for a more detailed comparison of model to observed spectrum:
All the calculations we've done so far have been based on the real event, GW 170817, which blew up at a distance of about D = 42 Mpc. But are future NS-NS mergers likely to be so close to the Earth?
Well, there are two opposing factors:
Slide 19 from
a presentation by Paolo D'Avanzo, given at
Eighth Huntsville Gamma-Ray Burst Symposium, 2016
When one puts the two together, it seems that most of the events LIGO is likely to detect in the near future will be closer to its outer range: perhaps at distances of 150 or 200 Mpc. Let's pick a value of D = 210 Mpc = 5 * 42 Mpc for one more set of calculations.
  Q:  If GW 170817 had occurred at this distance, what would its
            apparent V-band magnitude be?


  Q:  Fill in the table for an event like GW 170817, observed at
            a distance of 210 Mpc.


                  small telescope (D = 1m)       big telescope (D = 10m)

                          N      sig     p             N      sig     p
----------------------------------------------------------------------------

  w = 100 Angstrom

  w =  10 Angstrom

----------------------------------------------------------------------------
And remember -- this is for a spectrum taken at the time of maximum brightness. After 9 days, the kilonova might fade by ... well, let's see:
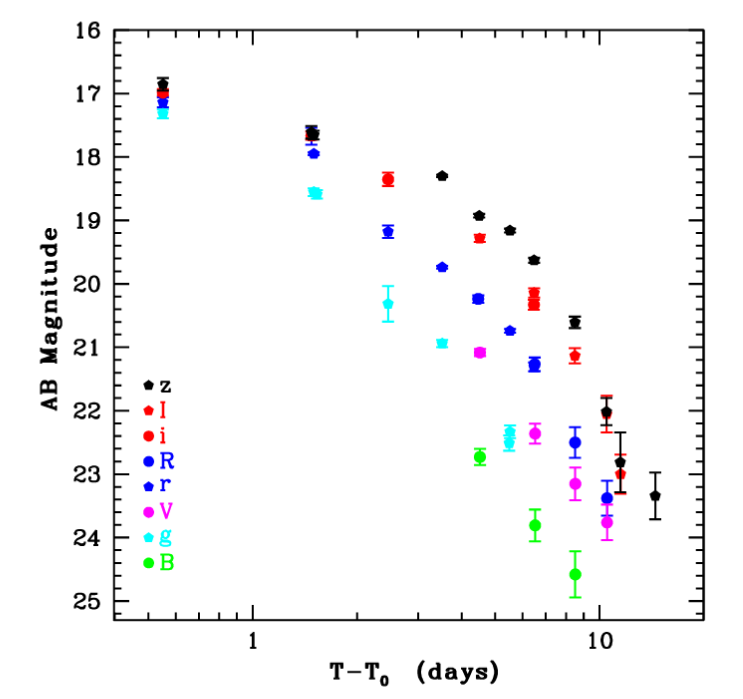
Figure 1 taken from
Pian et al., arXiv 1710.05858 (2017)
   Q:  By how many magnitudes in V-band did the object fade in 9 days?


       What is this fading, expressed in intensity?
Copyright © Michael Richmond.
This work is licensed under a Creative Commons License.