 Copyright © Michael Richmond.
This work is licensed under a Creative Commons License.
Copyright © Michael Richmond.
This work is licensed under a Creative Commons License.
The topic of signal and noise in a measurement is a very important one -- but also a very broad one. We will touch just the tip of the iceberg, using as an example measurements made from CCD images of optical sources.
Contents:
Astronomers want to know how long they need to expose their images. The answer will always depend on purpose for which the data are being acquired: someone who wants to measure the orbit of an asteroid needs merely a bare detection, like these:
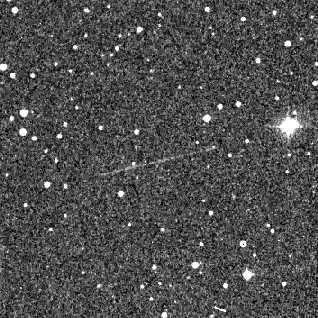
Near-earth object 1999AN10 leaves a faint streak |
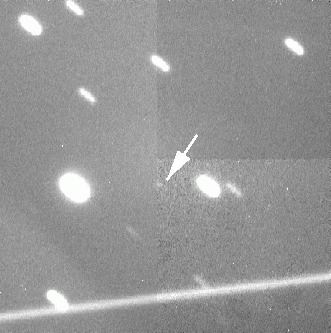
Tracking at just the right rate for asteroid (9969) Braille |
On the other hand, if one is looking for very, very small variations in the light of a star -- due to sound waves moving through its atmosphere, which have extremely small amplitudes:
The light of Wolf-Rayet star WR123 measured by the MOST Satellite
then one needs a much higher signal, and a much longer exposure.
Given a particular scientific question, one can estimate the quality of the data which are needed to answer it. We often describe the quality by the signal-to-noise ratio, sometimes abbreviated SNR or S/N. For our puposes, the S/N is inversely proportional to the fractional error in a measurement:
                                1
       S/N ratio   =  -----------------------
                      fractional uncertainty
So, for example, if the uncertainty in a measurement is 2 percent, the fractional uncertainty is 0.02. The S/N ratio would then be 1/(0.02) = 50.
There is a convenient relationship between S/N and uncertainty in measurements of magnitudes. For relatively small values of uncertainty -- say, less than 20 percent --
uncertainty in mag ~ fractional uncertainty
That is, a measurement with fractional uncertainty 3 percent = 0.03 will lead to an uncertainty of about +/- 0.03 magnitudes.
A more precise version of this relationship states that the uncertainty in magnitudes will be 1.08 times the fractional uncertainty in brightness. You can work this out yourself from the relationship between magnitude and intensity.
That means we can write
                                  1
       S/N ratio   ~   --------------------------
                       uncertainty in magnitudes
As you might expect, to compute the S/N ratio for some astronomical observation, we need to figure out two things:
In order to calculate the signal and noise properties of a digital image properly, we need to be careful to keep track of exactly what sort of information our image contains. There are three different quantities that one might consider: photons, electrons, and counts.
Stars and galaxies and other celestial sources emit photons. Models of these sources -- approximating a star as a spherical blackbody of temperature 5800 K, for example -- usually allow one to compute the number of photons emitted by a source, and therefore the flux of photons reaching the Earth's atmosphere, or one's telescope.
When photons from the sky strike a CCD or CMOS detector, they knock free electrons; the electronics on the detector then collect and measure the number of electrons in some way. One source of noise -- thermal motions of atoms in the crystal structure of the detector -- can also knock free electrons. Another source of noise -- readout noise in the amplifier -- is usually characterized by manufacturers in terms of electrons.
The best practice is to use electrons as the unit when computing the overall signal and noise properties of a measurement.
Unfortunately, most digital images do not contain a record of the number of electrons in each pixel. Instead, the ADC (Analog-to-Digital Converter) unit of the electronics converts the number of electrons in each pixel into another unit before recording it. This new quantity is called "counts" or "ADU" (for Analog to Digital Units) or "DN" (for Digital Numbers).
The conversion of electrons to counts involves a factor called "gain". It is often defined in the following manner (though strictly speaking, this is the inverse gain):
                         electrons
            gain  =   ------------
                          count
When one examines a digital image using a program
like
SaoImage DS9
or
AstroImageJ
or even
Gimp,
the numbers reported for each pixel are these "counts."
So, in order to perform signal-to-noise calculations properly on an image, one must know the gain of the detector which created the image. When you look up the gain for a particular camera, make sure that you get the units right. Sometimes, you might see quantity called "gain" which actually provides the number of counts per electron, the reciprocal of the usual definition.
There is only one source of signal from a star:
the light of the star itself.
If the star causes N(star) photons
to strike the CCD chip during the exposure,
and all of them knock free one electron,
then the image should have N(star) electrons.
That's the signal.
Of course, real detectors don't have 100 percent quantum efficiency. If N(star) photons do strike a detector, maybe only 0.70*N(star) electrons are knocked free.
For the standard astronomical passbands, there are equations which give the number of photons per second collected by a telescope of a particular size from a star of a particular magnitude. A good source of these zero-point fluxes is Allen's Astrophysical Quantities. Some additional references are collected at the end of today's lecture. I use these values:
  Passband     photons/sec/cm^2
              from star of mag 0
---------------------------------
    U            550,000
    B          1,170,000
    V            866,000
    R          1,100,000
    I            675,000
Exercise:
- Ignoring atmospheric extinction, how many photons should strike a CCD in a 15-second exposure with the RIT 12-inch telescope through the V filter of a star with magnitude V=13?
How does the signal depend on exposure time?
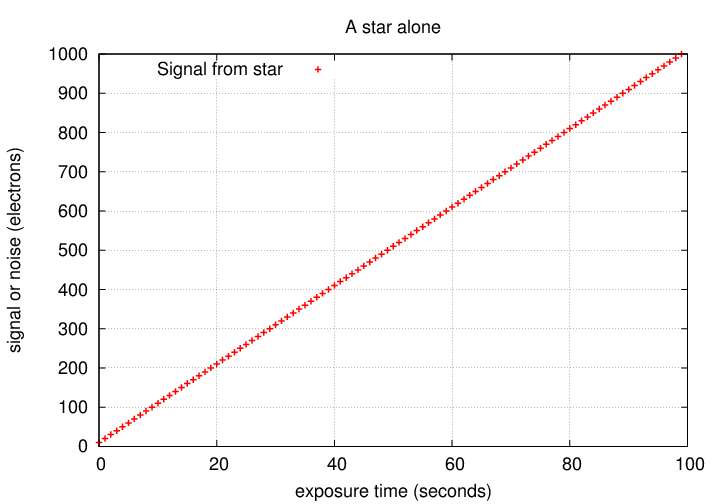
In a simple linear manner: if we expose twice as long, we get twice the signal. Great!
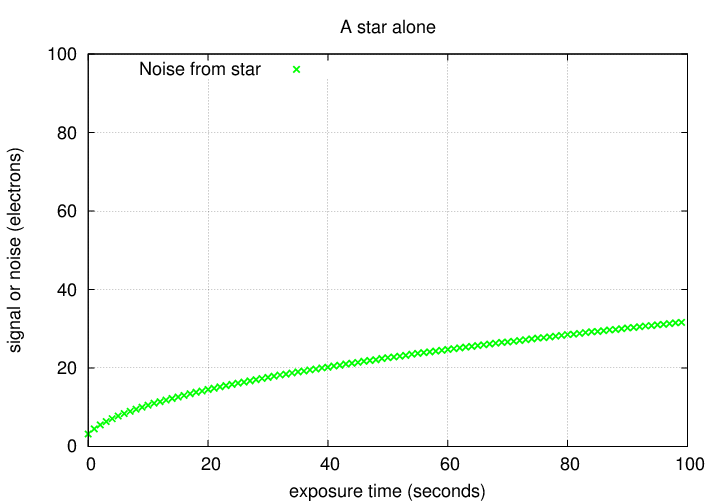
There are four main sources of noise for simple aperture photometry on a CCD: shot noise from the star itself, shot noise from the background sky, thermal noise from the CCD, and readout noise from the CCD. Let's consider each in turn.
        noise(star)  =  sqrt of number of electrons from star

                     =  sqrt[ N(star) ]
Exercise:
- Suppose we take a 15-second exposure with the RIT 12-inch telescope through the V filter of a star with magnitude V=13. If shot noise were the only factor, what would the signal-to-noise ratio be?
- In this case, what would be the expected uncertainty in measurements of stellar magnitude?
Let's look at the noise due to random fluctuations in the number of electrons liberated by starlight. How does it behave as a function of exposure time?
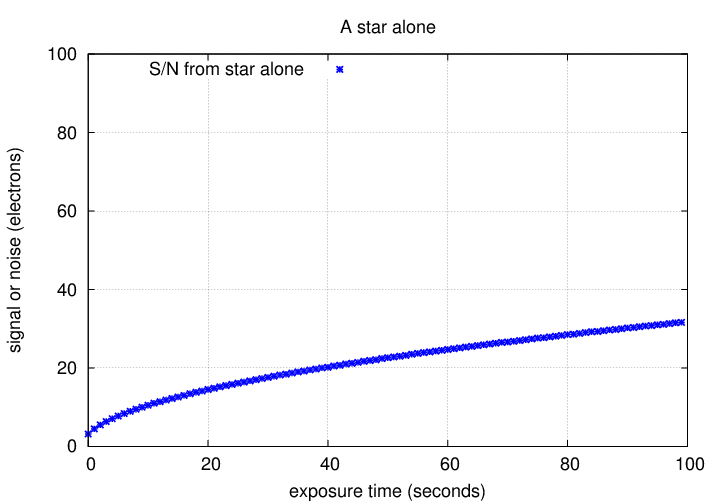
Okay. If we know how the signal and noise behave, we can compute the S/N for an isolated star measured with a perfect detector.
Exercise:
To measure the light from a star in a digital image, we need to draw a little circle around the star. For historical reasons, this circle is called the aperture.
When we add up all the electrons within the aperture, some may come from the star, but some will be due to this thermal contribution. If we take a series of dark exposures, we can measure the AVERAGE value of the dark current in each pixel ... but there will be random fluctuations around this average. We can subtract away the average value of this thermal contribution, but can do nothing about the random variations. Since thermal electrons also follow a Poisson distribution, the noise due to this random variation is
     noise(thermal)  =  sqrt of number of electrons from thermal motions

                     =  sqrt[ N(thermal)  ]
We can break this up into two factors:
the number of thermal electrons per pixel, and the number
of pixels in the aperture we're using.
N(thermal) = (electrons per pixel from thermal) * (number of pixels)
So we can write the thermal noise as
noise(thermal) = sqrt[ N(thermal per pixel) * npix ]
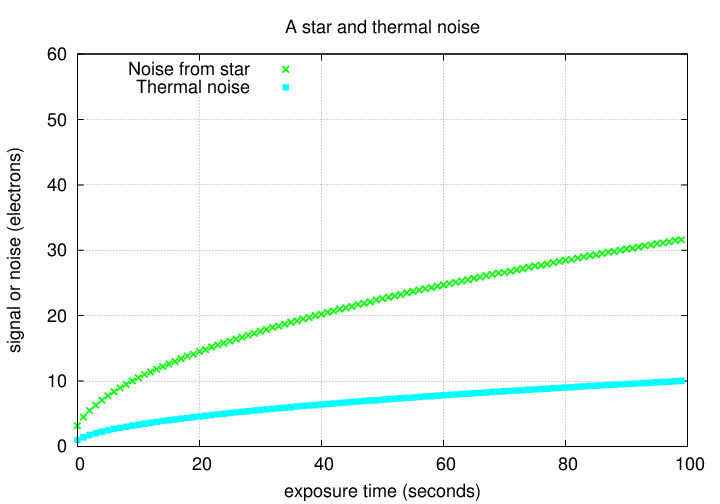
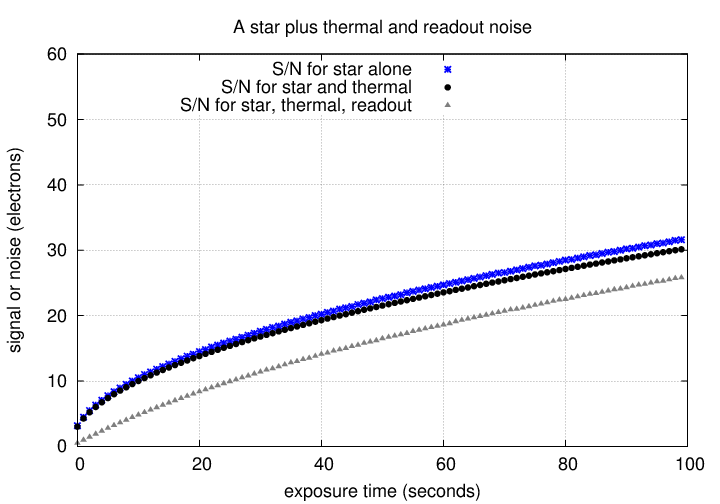
Let's look at a simple example: suppose that we are looking at a bright, isolated star in a perfectly dark sky. Then the signal from the star grows linearly, as usual. However, the number of thermal electrons also grows with time:
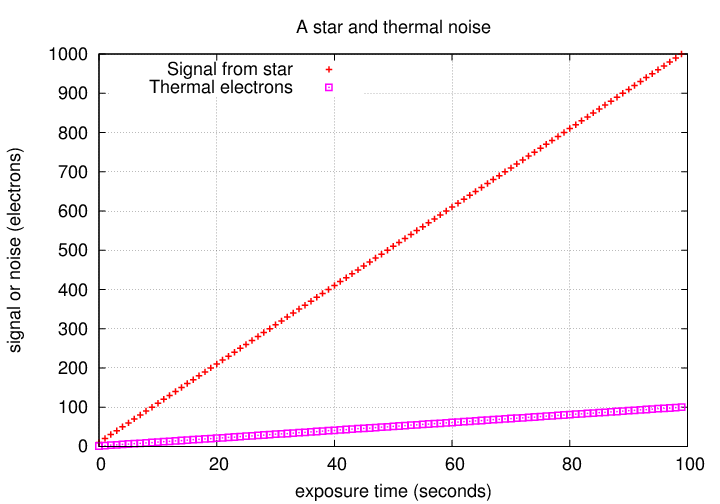
We now find two contributions to the noise, which behave in a similar fashion:
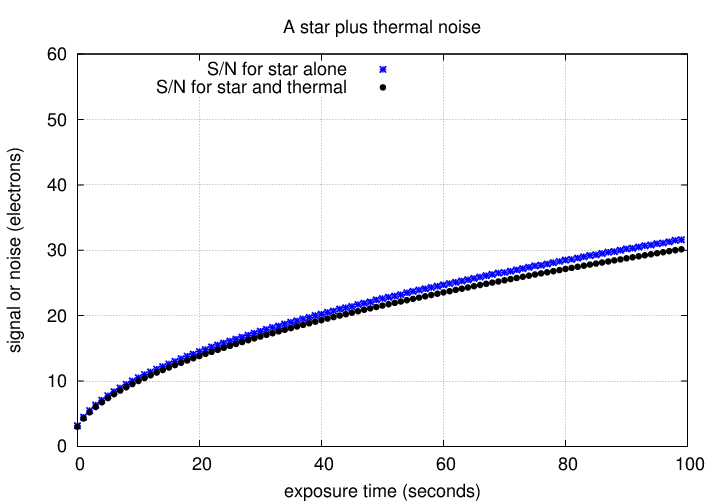
The signal-to-noise ratio will therefore be somewhat smaller due to the thermal noise.
                                           electrons
      readnoise R    =  stdev(counts)  *  ------------
                                             count
In our calculations of signal-to-noise, we need to convert from the stdev to the corresponding variance:
variance = (stdev * stdev)
and then add up the variance from all the pixels which fall
inside the photometric aperture. The result is
noise from readout process = sqrt [ (R*R) * npix ]
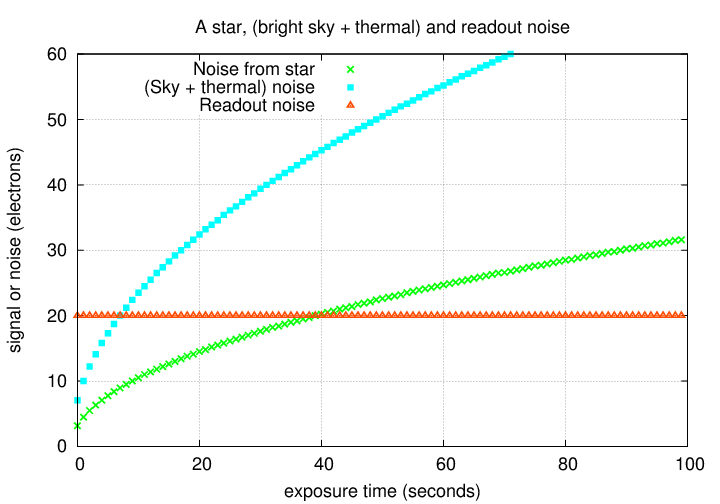
This source of noise behaves in a different way: it does NOT increase with exposure time.
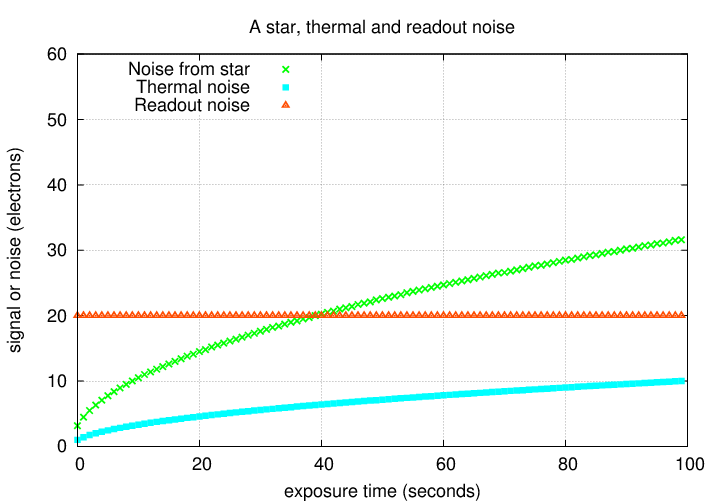
For very short exposure times, the readout noise can be the largest contributor to the "noise" part of the signal-to-noise ratio.
For long exposures, other sources of noise eventually dominate.
So, when we place an aperture around a star in an image,
we will integrate a mixture of electrons produced by light from the star, electrons knocked free by thermal motions, and electrons created by photons from these "background" sky sources. We can measure the amount of this "background" light by examining the pixel values in a region near the target object,
and then subtract the average value. However, just as the number of photons from a star varies randomly according to Poisson statistics, so does the number of photons from the sky. There is always some uncertainty in the amount of background light subtracted from the aperture. The noise due to this random variation is
        noise(sky)   =  sqrt of number of electrons from sky

                     =  sqrt[ N(sky)  ]
We can (again) break this down a bit further: to calculate the sky
contribution, we determine a local sky level per pixel,
and then multiply by the number of pixels within the aperture.
N(sky) = (electrons per pixel from sky) * (number of pixels)
So we can write the noise from the sky as
noise(sky) = sqrt[ N(sky per pixel) * npix ]
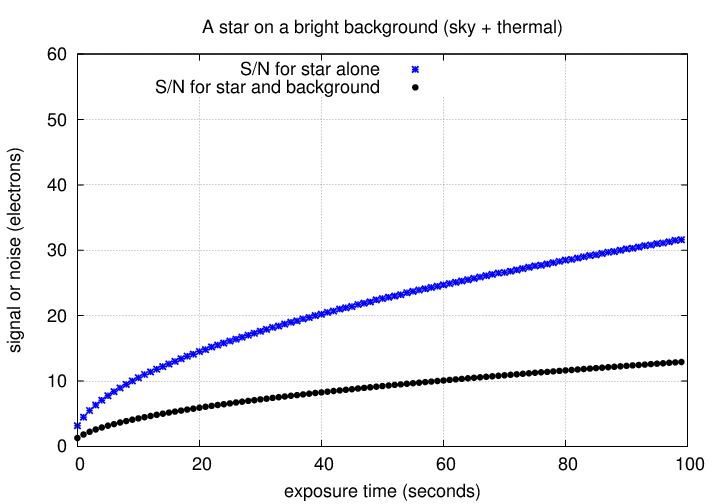
If the sky happens to be very bright -- or we choose a large aperture -- then the background might create even more electrons than photons from our target object.
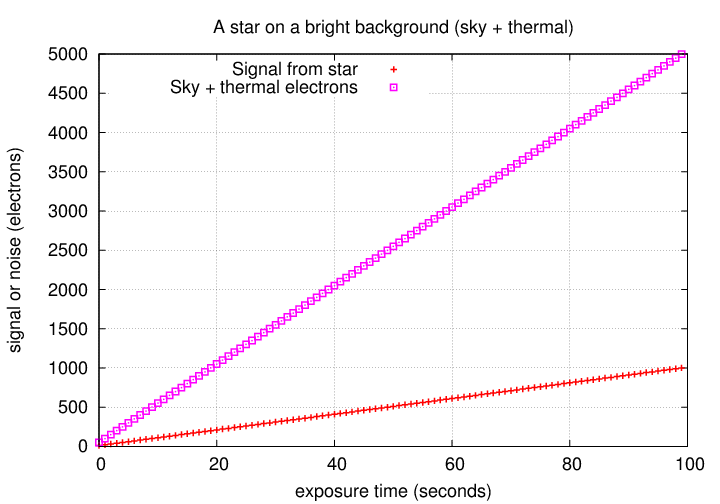
In that case, the noise might also be dominated by the background light:
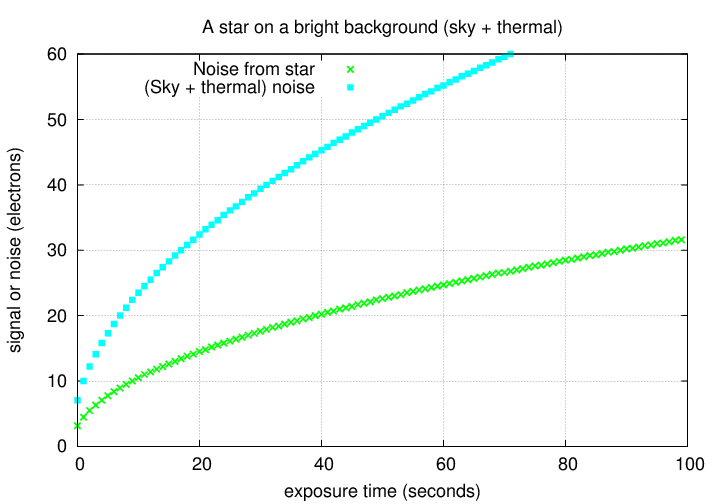
The overall S/N ratio would then be much lower than for the star on a perfectly dark background:
We can add all four sources of noise together: the way to do it is to add up all the electrons they produce, and then again appeal to Poisson statistics to find the noise.
    total noise      =   sqrt [ N(star)  +

                                N(sky per pixel)*npix  +

                                N(thermal per pixel)*npix  +

                                (R*R)*npix  ]
If we are looking at a faint star in a bright background, we might have noise contributions like
In order to find the S/N ratio, we simply divide the total signal by the total noise.
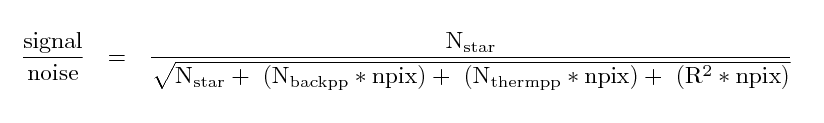
where
     N(star)                 is the number of electrons from the star
                                   which fall within the aperture

     N(backpp)               is the number of electrons Per Pixel
                                   due to the sky background

     N(thermpp)              is the number of electrons Per Pixel
                                   due to thermal effects

     R                       is the readout noise per pixel, in electrons

     npix                    is the number of pixels in the aperture
Remember to be consistent in your calculations. Always use electrons, in all the terms. It's easy to forget, and mix counts with electrons, but that will doom your work.
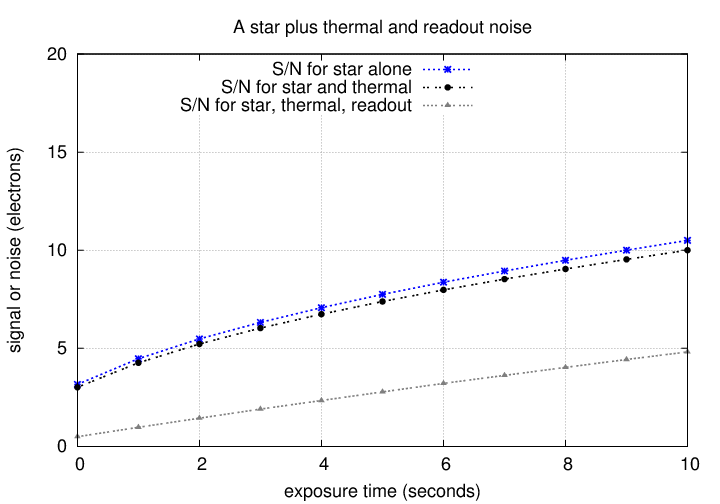
In the example above, we find a S/N ratio which grows with exposure time like so:
Let's work through one example to see how this works. We can use an image of the cataclysmic variable V404 Cygni as our laboratory.
We'll measure star "D" on this image.
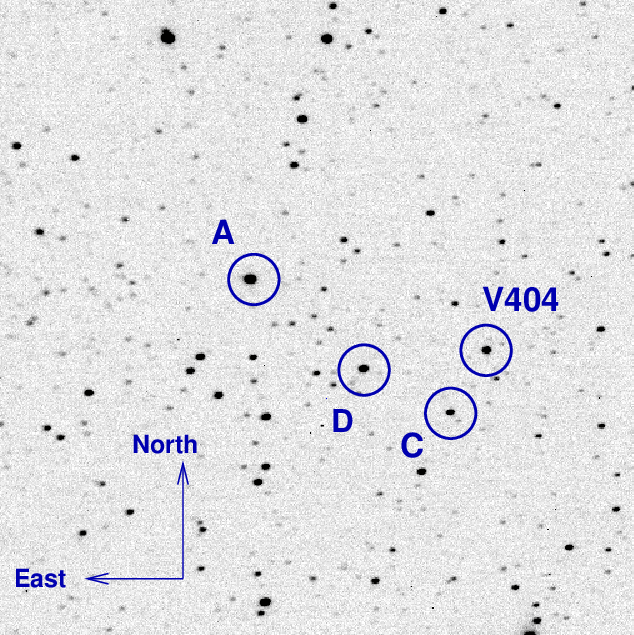
Use the 'a' key to measure the properties of this star, adopting parameters
Here's the result:
( 297.55 291.92) flux 28650.6 npix 153.4 mag 13.857 sky 42.0 [ 7.0 15 30]
I measured the thermal noise for images of similar exposure time taken on this night, and found an average of 600 counts per pixel.
You have been measuring "counts" in these images. But we really want to measure "electrons", since electrons are directly related to the number of photons which struck the silicon. This particular CCD camera, an SBIG ST9, converts electrons to "counts" using a factor -- sometimes called the gain -- of 2.8, like this:
1 count = 2.8 electrons
The camera has a readout noise of R = 13 electrons RMS per pixel. You can compute the contribution due to readout noise inside the aperture by calculating R*R, per pixel.
Make a table showing all the following:
   quantity                          counts           electrons
-------------------------------------------------------------------
  star in aperture

  sky in aperture

  thermal noise in aperture

  readout noise in aperture        ---------

  total inside aperture            ---------

-------------------------------------------------------------------
Using the numbers in your table, in the "electrons" column, you can estimate the signal-to-noise ratio for measurements of this star:
Look at an analysis of the images from which our example was taken, at http://spiff.rit.edu/richmond/ritobs/jun21_2015/jun21_2015.html Near the bottom of the page, you can find a graph showing the light curve of the star we've been calling "D"; it is shown with dark blue symbols and labelled "B".
Copyright © Michael Richmond.
This work is licensed under a Creative Commons License.