 Copyright © Michael Richmond.
This work is licensed under a Creative Commons License.
Copyright © Michael Richmond.
This work is licensed under a Creative Commons License.
The goal today is to learn how to measure the brightness of stars in astronomical images. We'll use the clean images you created in the previous class, and focus on the process of measuring light. Our method is called aperture photometry, which is one of the simplest ways to determine the brightness of an object. Once again, we'll use AstroImageJ to do the work.
If you need to go back to the RAW images, you can find them at
An "aperture" usually means "a hole", or "an opening." Back in ye olde days, astronomers using single channel photometers would point their telescopes so that the light of just one star -- the target -- would fall into an honest-to-goodness hole in a piece of metal. Only that light would reach a detector and be recorded.
But in the world of CCDs, we create "synthetic apertures" on our images. To see what I mean, read this page:
Using AstroImageJ to perform aperture photometry
So, how do we do this in AstroImageJ? Let's use your cleaned image of the target, number 400, as our guinea pig.
![]()
Click on the "Aperture Photometry Tool" in the small AstroImageJ toolbar.

Then, move your cursor to one of the bright stars in the image, and left-click. A new text window should appear, with a set of measurements of the pixels near this star. Some of the data columns contain real measurements, but some contain bogus values, or no real data. Be careful!
The most important of these numbers is the "Source-Sky" value.
Part 1:
Now, before we try to use this value, we need to make sure that several of the parameters are set properly. You can open a big dialog window which controls these parameters by choosing in the image window's menu the Edit -> Aperture Settings option. The three most important settings are at the top:
In order to figure out the right values for these parameters, we need to look carefully and up-close at stars in our image(s). We want the object aperture to contain most of the object's light, but not too much background sky; and the background annulus should contain very little or no light from the star in question --- or from other stars, if possible.
As a very rough guideline, the object aperture might be 2 or 3 times the FWHM of the image, while the background annulus might run from, say, 5 to 7 or 10 times FWHM.
When you measure bright stars, you will usually find that the choice of aperture parameters doesn't change very much. But when you examine faint stars, which rise only slightly above the background, even small changes in aperture can lead to significant changes in the measured brightness.
Let's investigate. In the same image, pick a much fainter star -- maybe the one near (224, 337). Use aperture photometry to measure its brightness:
Part 2:
It turns out that using aperture photometry to measure both bright and very faint stars in the same image(s) can be a tricky business. As explained nicely in Howell, PASP 101, 616 (1989), one might want to use different apertures for different stars: big apertures for bright stars, and small apertures for faint ones. Doing so can provide slightly better signal-to-noise, but at the risk of systematic errors due to the different apertures. A technique called curve of growth analysis must be used to correct measurements through different apertures before the results can be used in further calculations. That is all outside the scope of this simple introduction.
You should have a set of 10 or 20 (or more) images of the V404 Cyg field. Here's a chart showing the region, with some stars labelled.
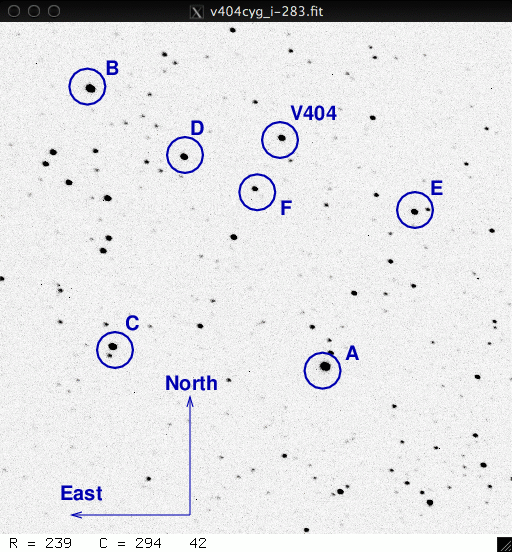
Choose the star labelled "D". Let's measure the brightness of this star in all the images in your set.
First, create an image stack with all your images.
Next, set the aperture parameters to reasonable values.
Now, the new part: use the menu above the image to choose Analyze -> Multi-Aperture . We are only going to use a single aperture, for a single star, this time ... but we'll use the full power of the tool later. Click on the Place Aperture button, and then left-click on star "D" in your image. Then press the Enter key to signal that you have finished marking stars to measure.
Lots of windows may pop up and appear. For now, pick the one which titled "Multi-plot Reference Star Settings". Choose Save Table, which will save the measurements of this star in ALL the images in a single, very wide, ASCII text file. Choose a name for the file, and save it.
What does this file contain? My version has 70 columns of data, separated by spaces. The first row of the table is shown below.
Label slice Saturated J.D.-2400000 JD_UTC JD_SOBS HJD_UTC BJD_TDB AIRMASS ALT_OBJ CCD-TEMP EXPTIME RAOBJ2K DECOBJ2K Source_Radius Sky_Rad(min) Sky_Rad(max) X(IJ) Y(IJ) X(FITS) Y(FITS) Source-Sky Source_Error Source_SNR Peak Mean Sky/Pixel Width X-Width Y-Width Angle Roundness X(IJ)_T1 Y(IJ)_T1 X(FITS)_T1 Y(FITS)_T1 Source-Sky_T1 Peak_T1 Mean_T1 Source_Error_T1 Source_SNR_T1 Sky/Pixel_T1 X-Width_T1 Y-Width_T1 Width_T1 Angle_T1 Roundness_T1 X(IJ)_T2 Y(IJ)_T2 X(FITS)_T2 Y(FITS)_T2 Source-Sky_T2 Source_Error_T2 Source_SNR_T2 Sky/Pixel_T2 Peak_T2 Mean_T2 X-Width_T2 Y-Width_T2 Width_T2 Angle_T2 Roundness_T2 rel_flux_T1 rel_flux_err_T1 rel_flux_SNR_T1 rel_flux_T2 rel_flux_err_T2 rel_flux_SNR_T2 tot_C_cnts tot_C_err
There are a LOT of numbers here, but the ones of interest right now are few. Which of these should we choose?
Part 3:
Okay, now that you know which ones to choose, can you figure out a way to make a plot showing the brightness as a function of time? You might choose to read the entire file into a spreadsheet program, and plot the contents of the proper columns inside the spreadsheet; or, you might figure out a way to plot them with some other program (like, say, gnuplot. Another option would be to pick out the columns of interest, write ONLY those values to a new data file, and then work on that smaller, more manageable data file. I found the following command useful.
awk '{ print $5, $38 }' Measurements.xls > stard.dat
Let's do that again, but this time, we'll choose three stars to measure in all the images: the stars labelled "D", "F", and "V404".
Run the Analyze -> Multi-aperture command again, but this time, we'll mark one star as the TARGET and two stars as COMPARISONS.
The program should start measuring all three of these stars in all the images in the stack. When it finishes, use the Save Table button to save the results as a text file. My version of this text file has 88 columns!
Part 4:
Suppose we want to convert our measurements from "counts" to something we can share with other astronomers. If we knew the magnitudes of the two comparison stars "D" and "F", we might be able to convert out measurements to magnitudes, at least to a rough degree.
Can you figure out the magnitudes of these two stars? I suggest using the Aladin tool to create a chart of the region around V404 Cyg. Then, inside Aladin's "Server Selector" window, use the "Surveys" option to select the "USNO B1.0" catalog. When you click "Submit", a set of overlaid dots should appear on top of some of the stars in the image.
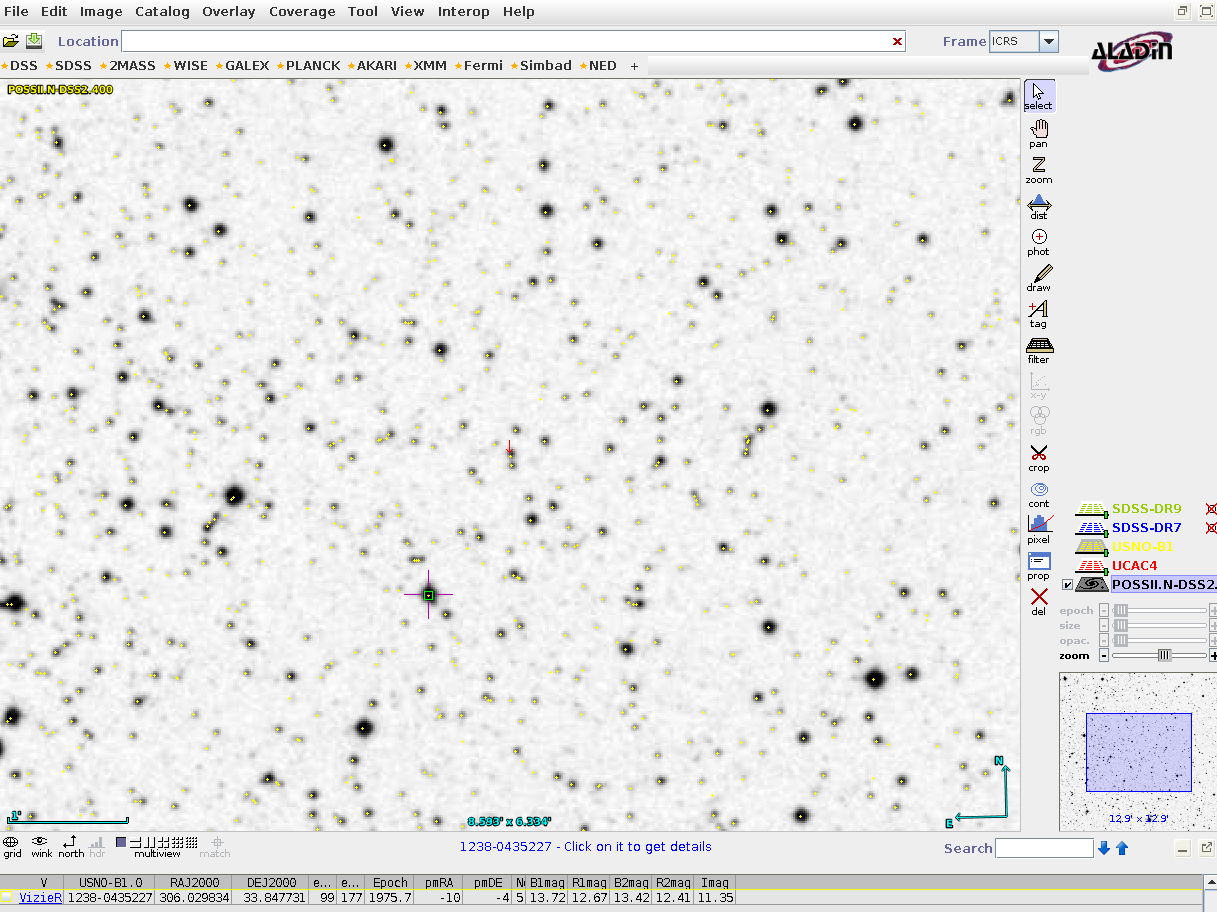
Clicking on one of these dots will cause information to appear below the chart, showing properties of this star in the USNO B1.0 catalog. One of the pieces of information you can find is the I-band magnitude.
Part 5:
Homework: measure 5 stars in all images
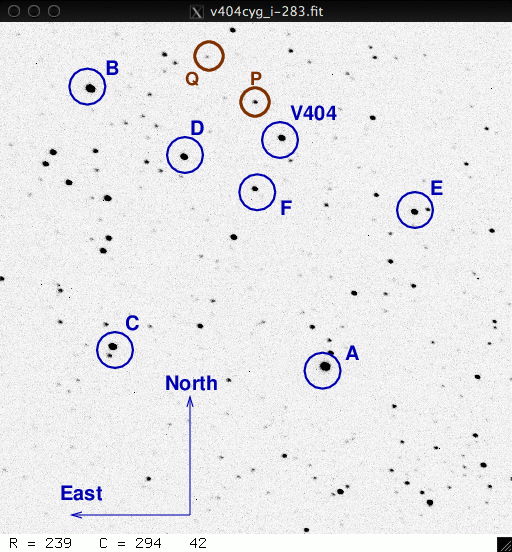
Now that you have the basics down, it's time to apply your skills to a reasonably large dataset. For this assignment, you'll need to analyze all 70 of the V404 Cyg images in the given dataset (numbers 380 through 459), and measure a total of 5 stars in each image.
The stars of interest are shown in the chart below. They are
Part 6:
instrumental mag = 25 - 2.5*log10(flux)
Bonus! Try out differential photometry
I am a big fan of "differential photometry", in which one uses the DIFFERENCES between measured magnitudes for stars in a single field as the basis for scientific analysis, rather than the measured magnitudes themselves. Why? Rather than explain, I'll let you try to figure it out for yourself.
Part 7:
diff mag of star X = (instr mag of X) - (instr mag of D)
In other words, convert your table of instrumental magnitudes
for each star into a table of (mag diff from star D).
Copyright © Michael Richmond.
This work is licensed under a Creative Commons License.