What happens after a bright source saturates HDI? In past years, we saw evidence for an effect I'll call persistent charge: after saturation, subsequent exposures show a faint residual image of the bright source at the source's location. Over time, that faint residual image gradually fades and disappears. However, the time required for a residual image to disappear can be quite long.
In February, 2014, Alec Hirschauer and Steven Janowiecki acquired a series of images to test the fading time. Rather than observing a bright source to saturate the detector, they turned the detector off, and then back on again; this procedure causes many pixels to be heavily saturated.
They wrote in an E-mail from Feb 24, 2014:
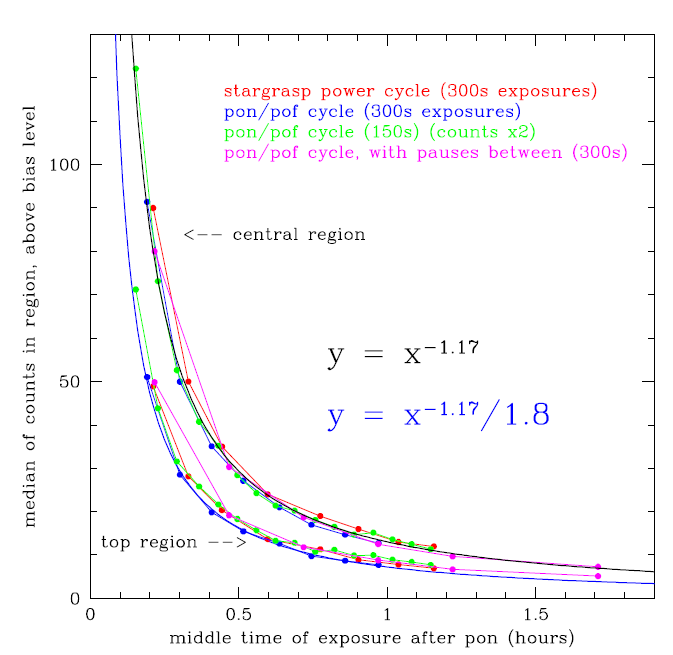
Since it was cloudy anyway, tonight Steven and I took Dark Frames in attempt to understand this strange issue that we've been dealing with. We decided to measure the median counts in two regions in these Dark Frames (a 200 pixel tall strip across the top of the image, and a 200 pixel tall strip across the middle of the image) as a function of time after powering on the detector.
Regardless of exposure time or observational cadence (i.e., total number of readouts), we found that the levels in the images decline logarithmically *only* as a function of time.
The attached plot shows the results of our study in four groups. We have found that regardless of method of power restart, length of Dark Frame exposure, and cadence of observation, the relation remains the same. These different series of Dark Frames correspond to:
(1, in red) 300 second exposures taken after running the commands "power stargrasp cycle", "stage2", "pon" as per the recovery procedure in the HDI manual following a network connection error,
(2, in blue) 300 second exposures taken after powering off ("pof") then powering back on ("pon") the detector,
(3, in green) 150 second exposures taken after powering off then powering back on the detector,
(4, in magenta) 300 second exposures taken after powering off then powering back on the detector, but waiting 15 minutes between exposures.
A comparison of (1) & (2) revealed to us that there was no difference in the effects between the "power stargrasp cycle" and "pof/pon" means of restarting the detector.
A comparison of (2) & (3) revealed to us that an increased number of readouts over an equivalent timespan made no difference in the effect.
A comparison of (2) & (4) revealed to us a similar conclusion as the above, but in the opposite direction (e.g., fewer readouts over an equivalent amount of time made no difference in the effect).
Overall, we find that following a power cycle, the detector demonstrates a global excess of counts that falls off as a function of time. Through comparison of the "top" and "central" regions, we find that the ratio of counts is constant. Please refer to the images we sent last night.
We have fit the trend to a power law (solid black line) for the central region, and have included a scaled down power law (solid blue line) to fit the top region.
We hope this helps in the understanding of this strange issue. Please let us know if there is anymore information we can provide. Thank you!
Click on the image below to download a PDF copy.
Based on these tests, residual charge decreases as time to the -1.17 power. After one hour, pixels which were originally saturated have values of 8-12 counts above the bias level.
HDI was sent to Hawaii for adjustments in the autumn of 2014, and returned to Kitt Peak in November, 2014. In February, 2015, Con Deliyannis took images which can be used to check the behavior of "persistent charge." On UT 2015 Feb 20, he took images of the open cluster M35; one of them, c7073t0064o, has an exposure time of 1800 seconds through the I-band filter. Several of the stars show strong saturation and long bleed trails:

After this image, Con took a series of 5 bias images over the next 5 minutes or so, followed by one more bias image about 11 minutes after the saturated image.
  image      UT of exposure_end       exptime
---------------------------------------------------------------------
c7073t0064      06:39:37               1800 sec        I-band M35

c7073t0065      06:41:45  (128 sec)       0 sec        bias
c7073t0066      06:42:21  (164 sec)       0 sec        bias
c7073t0067      06:42:57  (200 sec)       0 sec        bias
c7073t0068      06:43:34  (237 sec)       0 sec        bias
c7073t0069      06:44:10  (273 sec)       0 sec        bias

c7073t0070      06:50:38  (661 sec)       0 sec        bias

---------------------------------------------------------------------
Just how saturated was the chip?
Let's consider the star marked "A", which has coordinates RA = 06:09:15.45, Dec = +24:25:35.8. This star produces by far the largest number of electrons in the saturated image. The star has a V-band magnitude of 8.5, but I can't find an I-band measurement; I'll assume I = 7.5, but this could be in error by perhaps +/- 0.5 mag.
Using the WIYN 0.9-m signal-to-noise calculator and an assumed airmass of 1.5, we find that in an 1800-second exposure, this star should have created roughly 2.5 billion electrons in a small area on the CCD. As a check on the calculator, I used it to predict the number of electrons in the background sky of the image. The prediction was about 30,300 electrons per pixel, but the measured value was only about 15,000. Clearly, all the estimates here may be off by factors of 2 or 3.
I then defined a shape which included star "A" and its long bleed trails in both directions. This shape unfortunately also included a nearby star, just to the SW of star "A"; but since that star is considerably fainter, I'll ignore it. Adding up all the counts in this region, I find a sum of roughly 0.6 billion electrons.
"Box" tests
Before making any measurements, I converted the original unsigned 16-bit integer FITS images into a slightly modified form: signed 16-bit integer FITS, with a range of -32768 to +32767. I divided all original pixel values by 2 to shrink the dynamic range into this range, but that will not affect the following measurements in any significant way.
I subtracted a mean bias level from each image, using the overscan pixels on one side of the image.
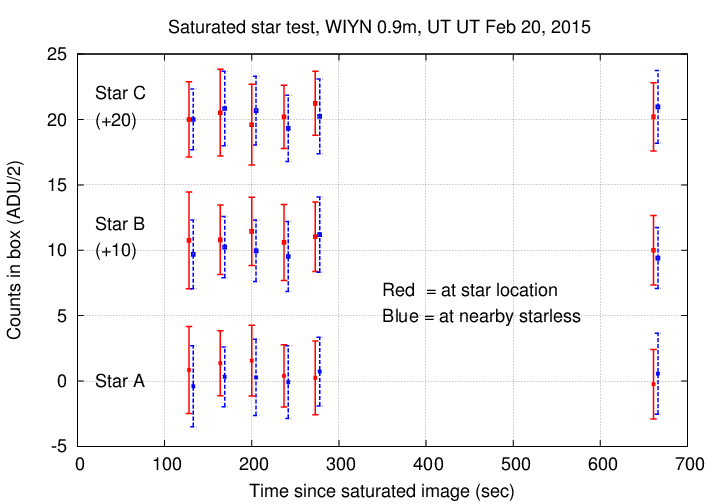
My first attempt to check the persistance of charge was to define a square box, 5-by-5 pixels, centered on each of the three bright stars A, B, C. I also defined a 5-by-5 pixel box in the neighborhood of each star, but in a region empty of bright stars. The basis for this test is comparing the amount of charge inside each "star" box to the amount of charge inside each "starless" box.
The results are shown below. I've offset the results for stars B and C vertically for clarity, by 10 and 20 units, respectively.

This graph OUGHT to show a gap between the red ("star") and blue ("starless") measurements which shrinks over time, due to the persistent charge in the chip at the locations of the bright stars. However, the statistics are poor: there just wasn't a lot of excess charge at the star locations. That's good news, of course, but it makes trying the measure the effect difficult.
One can see a hint of the expected effect for stars A and B, but not for star C. The numbers are too noisy to draw any real conclusions.
"Row" tests
If one examines the first bias image taken after the saturated exposure, one can see a faint vertical streak, or maybe two streaks.

The more prominent streak, to the right of center, is at the location of star "B", while a fainter streak can be glimpsed to the left of center, near the location of star "A". I decided to add up counts along groups of vertical columns in order to increase the signal-to-noise measurement of these faint features.
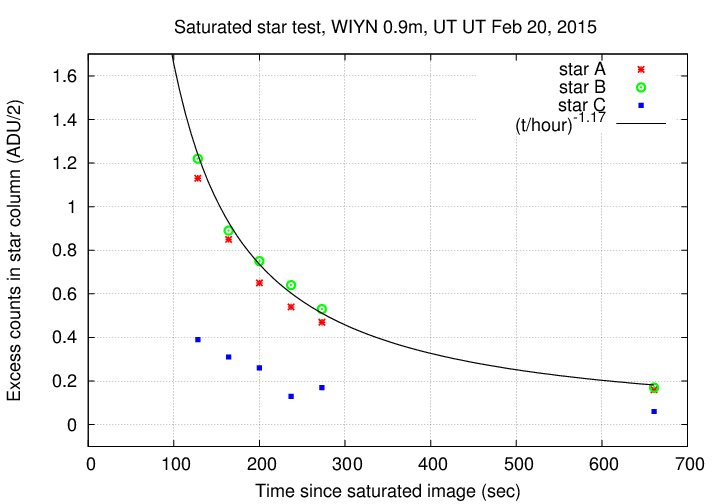
I defined boxes running from top to bottom of each image, 3 columns wide. As before, I created one box per star, plus a "starless" box close to the location of each star. I computed the mean value of all pixels within each "star" region, and subtracted from that the mean value of all pixels in the neighboring "starless" region.
The results are shown below.

Excellent. There columns near stars "A" and "B" show a clear signal which fades with time, and one can even see a rough indication of the same effect for star "C".
When I fit a model to the measurements of stars "A" and "B", I found that the values declined as time to the power of -1.19, which is very close to the value of -1.17 found back in Feb, 2014. I have drawn a model line for the latter power to show how well it reproduces the behavior in this recent test.
We can conclude -- remembering that these values probably have uncertainties of order factors of 2 --