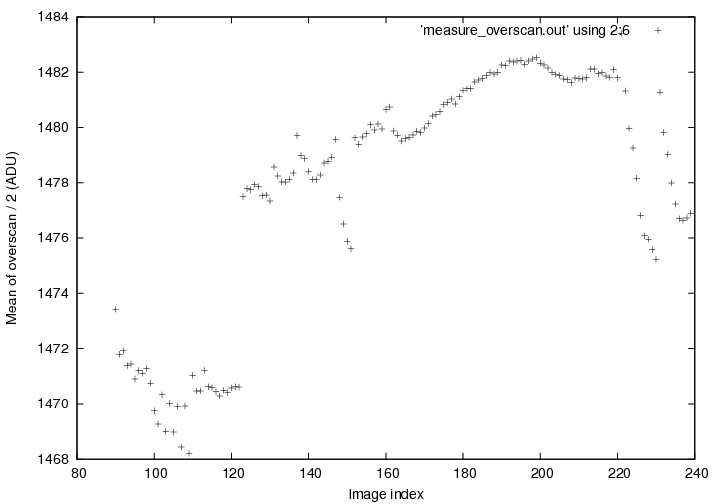
I examined the properties of the overscan region of HDI images taken in 1-amp mode. The images were acquired on Jan 22/23, 2014:
c6680t0090o00.fits - c6680t0239d00.fits
The overscan region lies in columns 4096 - 4142. For this study, I restricted my calculations to the columns 4100 - 4130 to avoid any edge defects.
I also divided all raw pixel values by 2, in order to force all values into the range 0 - 32767.
Over the course of about six hours, the overscan value changed quite a bit. Note several features:

I checked the values of the pixels in the overscan region as a function of the row position, and found no significant trend with row position. In other words, the overscan value has a constant value along the entire chip, albeit with random noise all along the way. Even when the overscan value is changing rapidly from one image to the next, as around image index 221-222-223, the level remains constant within a single image.
Since the overscan value may change by 5 to 20 ADU over the course of a single night, one must be careful when taking and using dark frames. On this night, I took three sets of dark images:
                                       entire image
   index       UT      exptime        mean pixel value
              start     (sec)       (after dividing by 2)
 ---------------------------------------------------------
  113 - 122  07:01      60               1470 ADU

  221 - 230  12:21       1               1477

  231 - 239  12:32     500               1478
 ---------------------------------------------------------
If one ignores the overscan and takes the overall mean value of each image, one finds that the 60-second darks have a lower pixel value than the 1-second darks. That's clearly not right.
What's happening --- as shown by the overscan regions --- is that the bias level is slowly varying over time.
   index       UT      exptime       mean overscan value
              start     (sec)       (after dividing by 2)
 ---------------------------------------------------------
  113 - 122  07:01      60               1470 ADU

  221 - 230  12:21       1               1477

  231 - 239  12:32     500               1477
 ---------------------------------------------------------
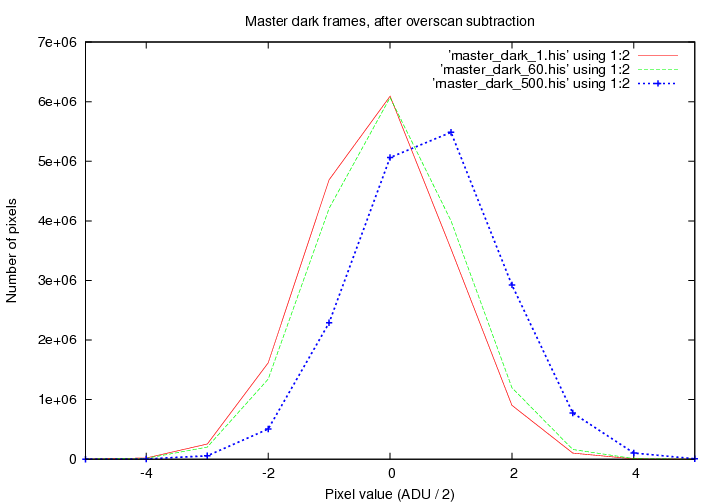
Once we subtract this mean overscan value, we end up with a very small amount of residual charge in the dark frames. I measured the histogram of pixel values in "master" dark images, made from the median of 10 individual overscan-subtracted dark frames of each exposure length. The figure below shows the histogram for each image:

As you can see, the distribution of pixel values for a 1-second and 60-second dark frame are almost identical. The 500-second dark frame has a peak which is shifted roughly 1 (ADU / 2) to the right.
We can therefore conclude that the dark current is roughly (1/2) ADU every 500 seconds. Since the gain is about 1.3 electrons per ADU, we find a dark current of about 0.7 electrons/pixel/500 seconds, which is equivalent to about 5 electrons/pix/hour. The spec sheet from e2V for this CCD states that the dark current should be about 3 electrons/pix/hour at a temperature of -100 C.
So, our measured value is very roughly the same as the value on the spec sheet. That's good. This value is also much, much lower than the value I erroneously derived in Tech Note 2.
As a first step in the data cleaning process, users should measure the mean value of pixels in the overscan region of each image, and subtract that mean value from all pixels.