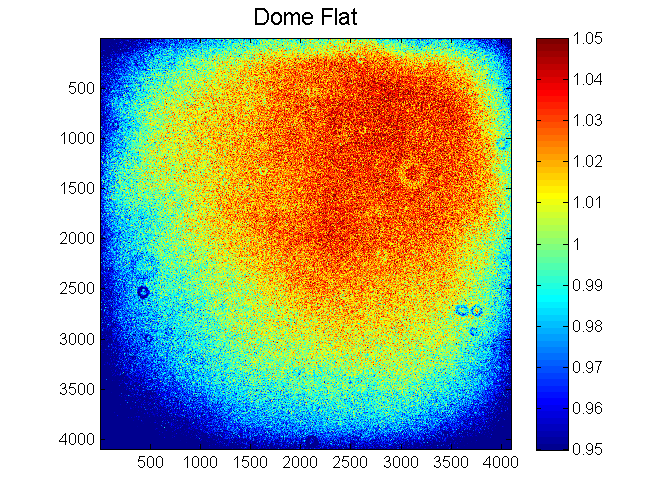
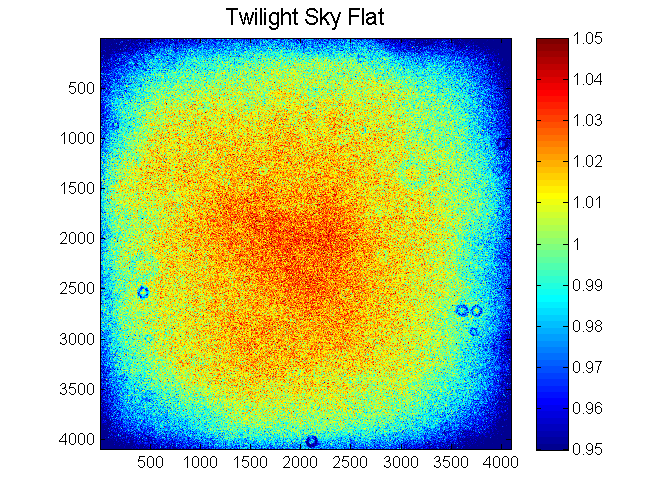
Figure 1. To evaluate the illumination of the flat field screen in the WIYN 0.9m dome, dome flats were compared with twilight sky flats. An illumination gradient is apparent in the dome flats.
On January 24th 2014, dome flats obtained with HDI were compared to twilight sky flats. The dome flats were obtained using a 10 second exposure in the R filter, with the "low" bulb at 90% brightness. The mean value in the frames was approximately 26600 counts (Figure 1, left). Four sky flats were acquired using 10 second exposures in the R filter several minutes after sunset (at 1:17:41, 1:18:28, 1:19:14 and 1:20:01 Zulu) with average counts of approximately 22000, 18000, 16000 and 14000 counts, respectively. Each frame was dark-subtracted using a set of 10 median-combined 1 second dark frames. The sky frames were scaled to have the same average value as the highest-value frame and median combined to remove the star trails (Figure 1, right).
Figure 1. To evaluate the illumination of the flat field screen in the WIYN
0.9m dome, dome flats were compared with twilight sky flats. An illumination
gradient is apparent in the dome flats.
In order to quantify the steepness of the gradient, the dome flat and the sky flat were both normalized to their respective mean values. Then, the normalized dome flat was divided by the normalized sky flat. This isolated the gradient, which is shown in the right panel of Figure 2. The difference between the darkest and the brightest corners is approximately 10%. The right panel of Figure 2 shows the profile across the middle of the gradient image in the x and y directions.
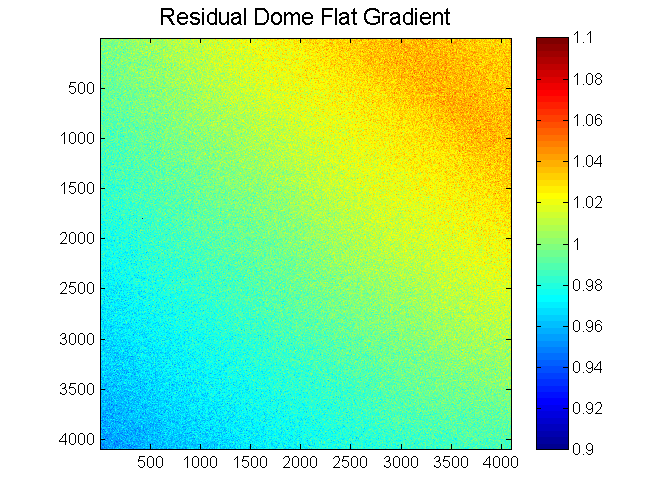
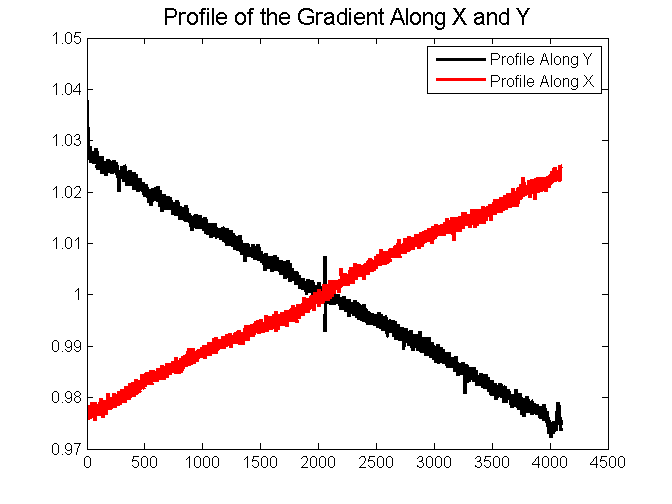
Figure 2.
Dividing the dome flat by the sky flat reveals a diagonal gradient. The right
panel shows the horizontal and vertical profiles in the middle of the gradient
image.