Over the past few months, some observers have noticed noise in their HDI images. The noise appears in two basic forms. This document describes those forms and provides some examples.
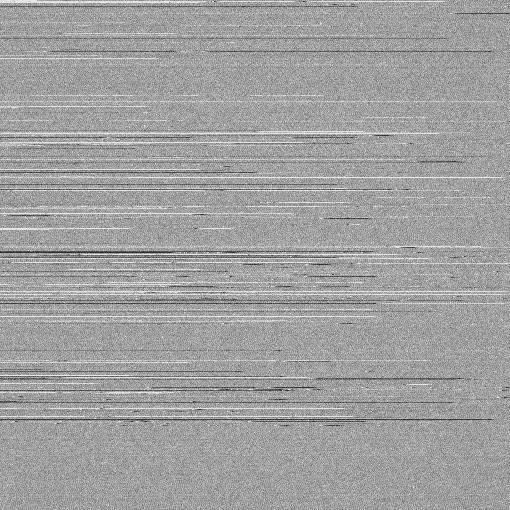
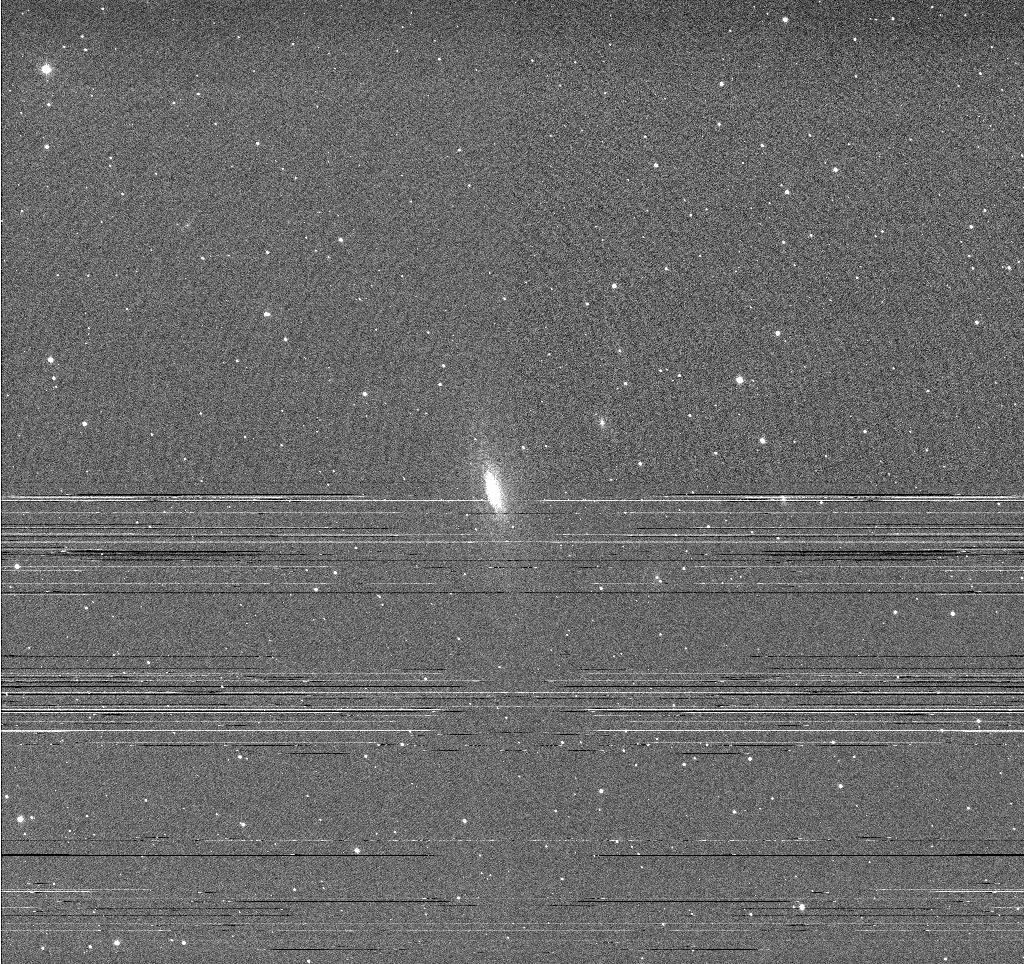
The figure below shows a small version of an entire HDI bias image, shrunk down to a small size. You can see a number of horizontal streaks, both light and dark. Note that these features do not stretch across the entire frame in most cases; in other words, the pixels in a row sometimes return to normal. It appears that the noise may originate at the left-hand side of each row, but decay or disappear before it reaches the right-hand side.
If we zoom in, looking at the central portion of the image, we can see the individual pixel features.
In these bias images, the typical pixel value is around 2740 counts. The light and dark streaks have values which are 20 to 40 counts higher or lower than the average.
One way to characterize these frames is to compute the median value of each horizontal row. Images with ordinary data values will show a relatively constant value from top to bottom, with random scatter of just +/- a few counts (in the figure below, the overscan values have been shifted by -50 counts for clarity).
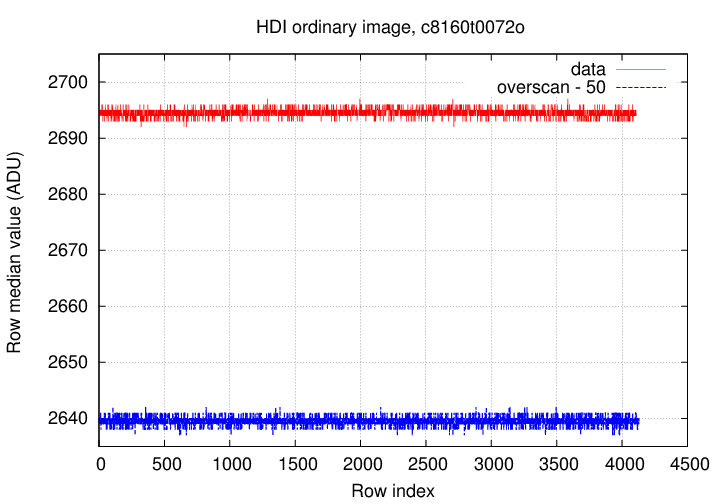
But images with streaks can show clear outliers, as shown in the plot below.
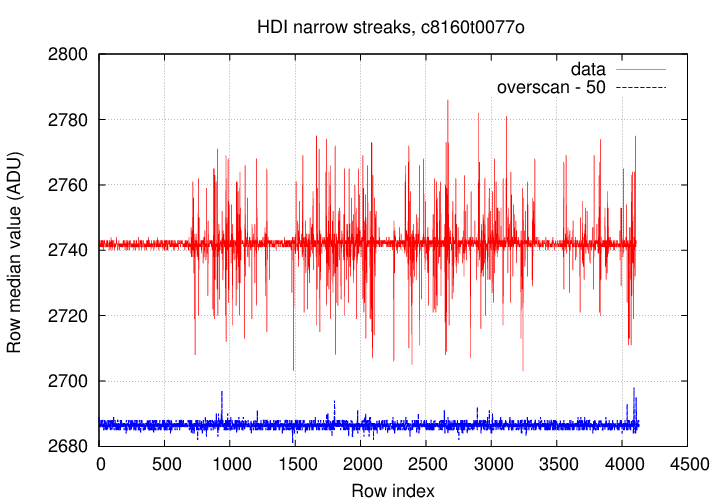
I defined "data" and "overscan" regions for these images in a conservative manner as follows:
You can see that the spikes are much less apparent in the overscan region of the chip, which is located on the right-hand side of the image. As mentioned above, the noise often disappears before it reaches the right edge of the image.
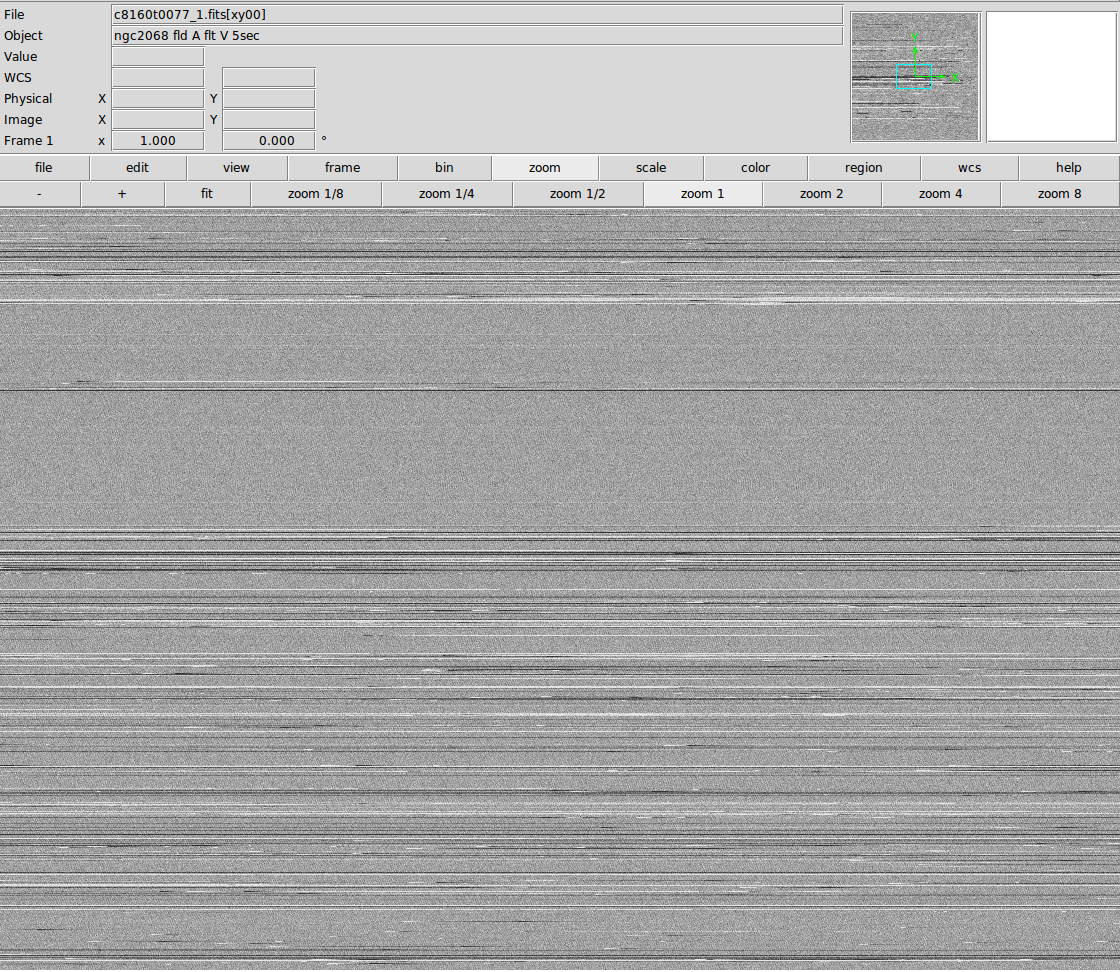
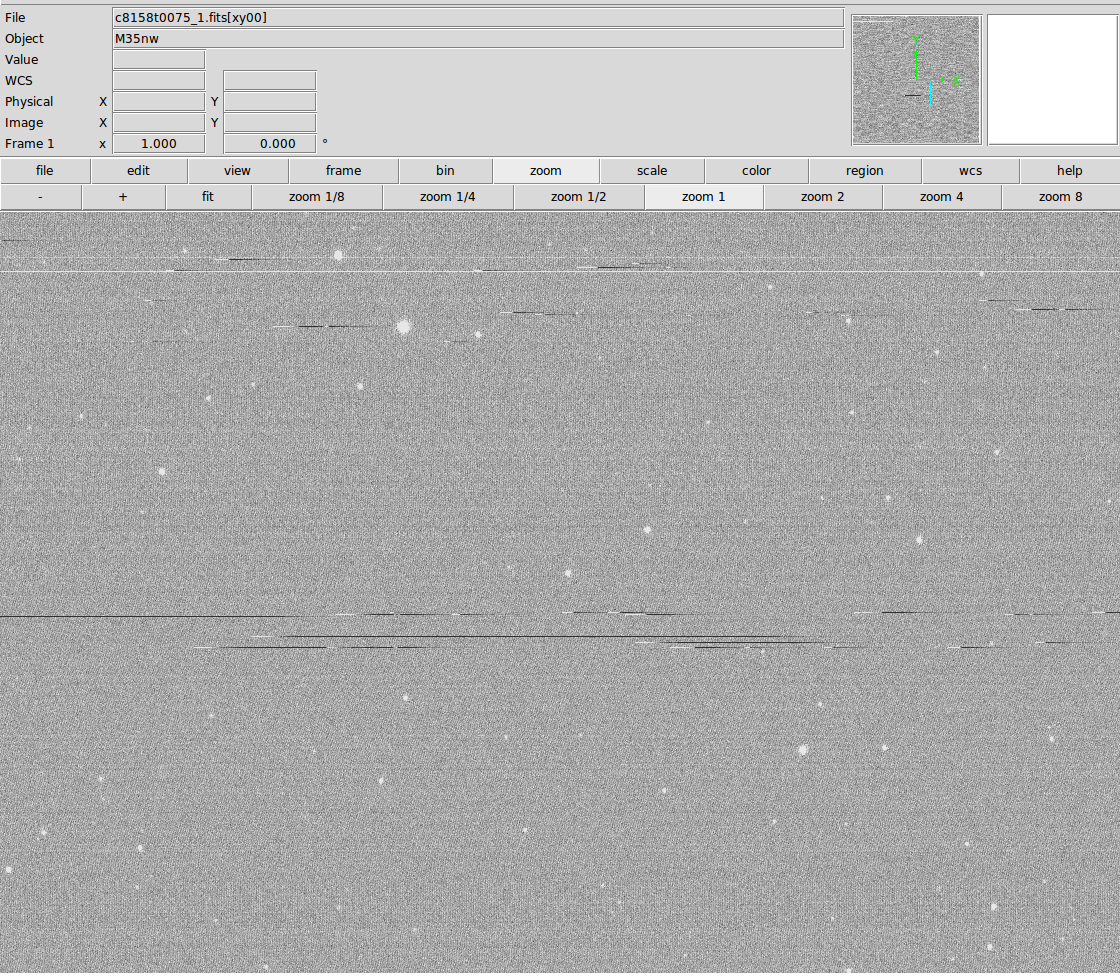
The example shown above, c8160t0077, was a particularly egregious example of streak noise. But some images have fewer streaks. For example, c8158t0075 looks almost ordinary at a casual glance:

If one zooms in to the individual pixel level, one notices a few of the horizontal streaks:
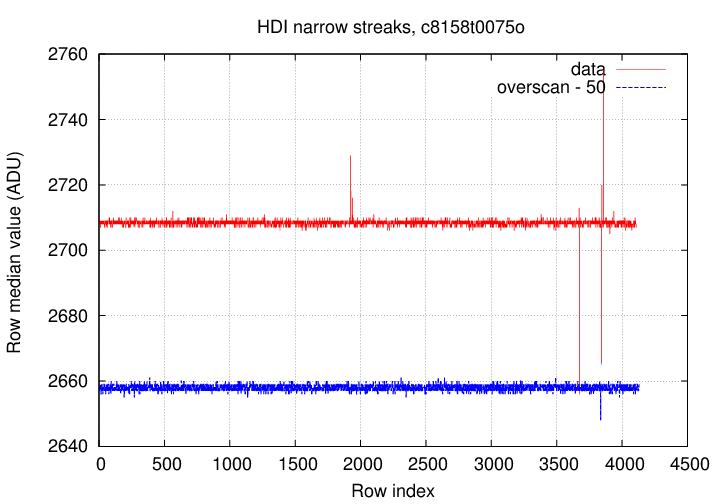
A plot of the median values of its rows shows -- almost nothing! In this case, the streak noise usually did not reach all the way across the chip, and so the median value in most rows had its usual value. Designing a statistical test to identify "streaks" automatically is not a trivial task ...
If one takes images in 4-amplifier mode, the streaks show two important features:
The image c8051t0113o00.fits, shown below, illustrates both of these features. The first version is a small one, zoomed at 25% of full size:
This is the same image, shown at a magnification of 50%.
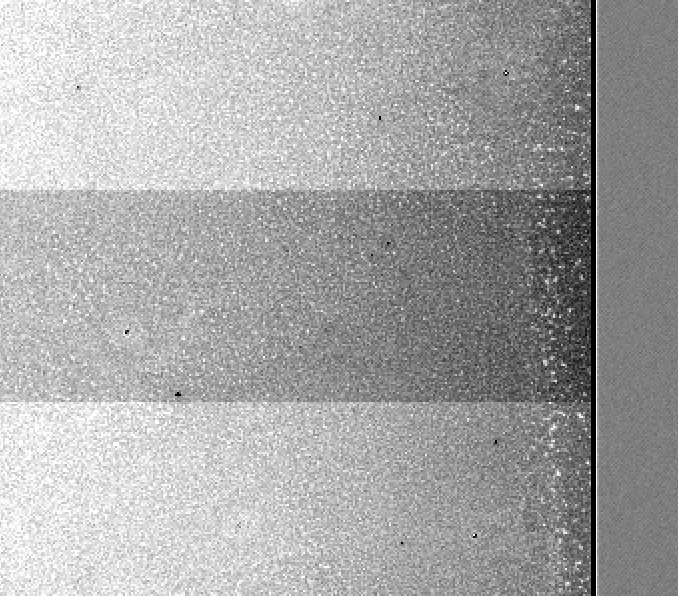
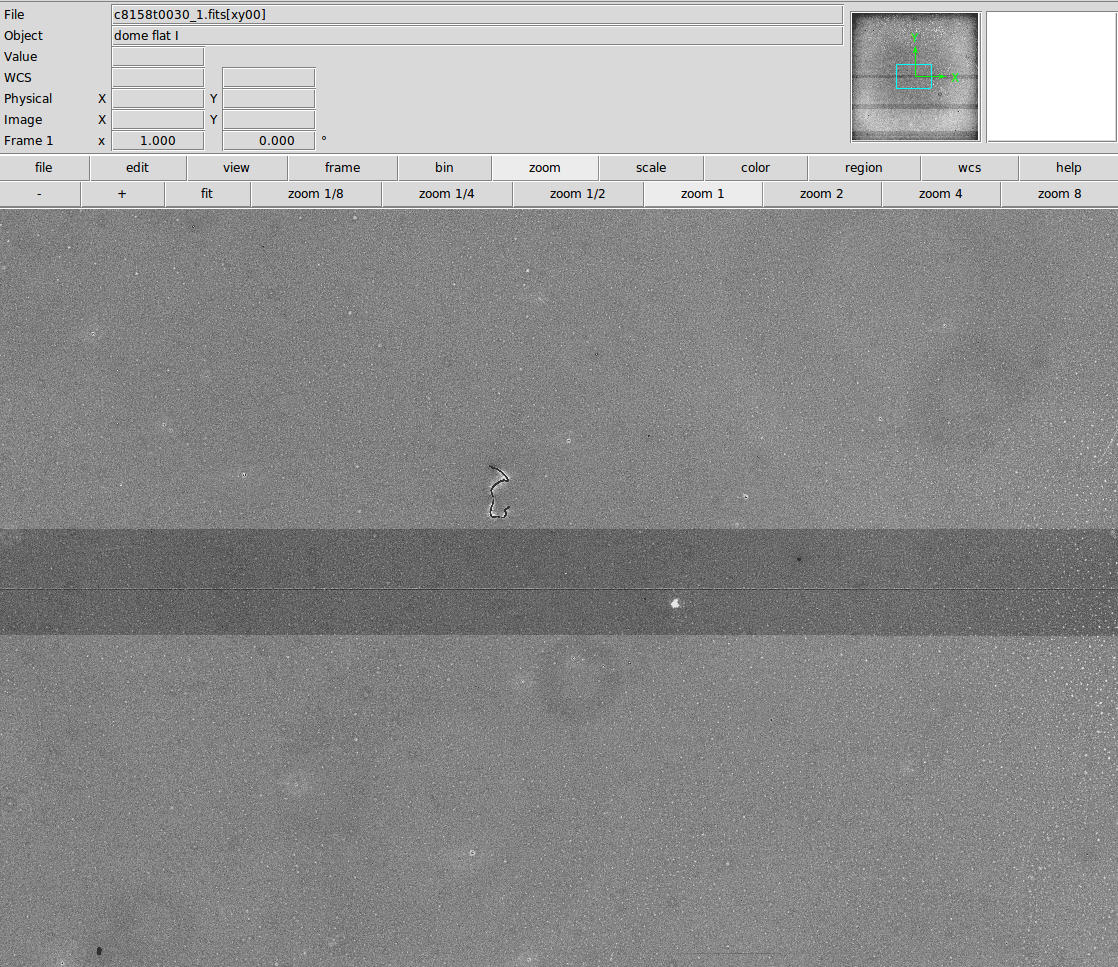
In February 8, 2018, a new sort of noise pattern appeared. The pattern in this case is wide horizontal "bands", which stretch uniformly across the image from left to right. Bands range in size from a few rows to over 100 rows.
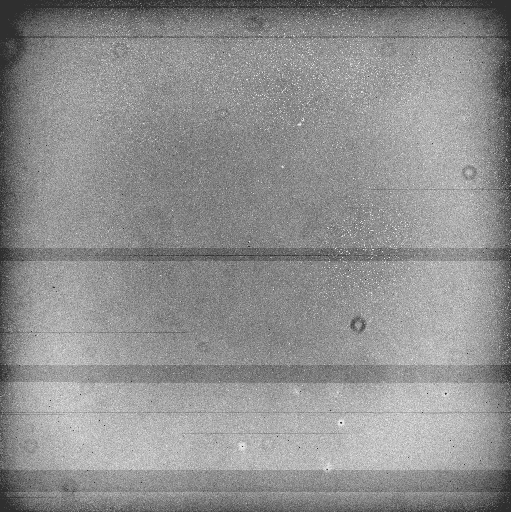
Zooming into the center of one such image, we see that the pixel values in each band have roughly the same offset from the norm.
If we again compute the median value of pixels in each row, we see clearly the large dips within each "band": pixel values drop by 200-500 counts.
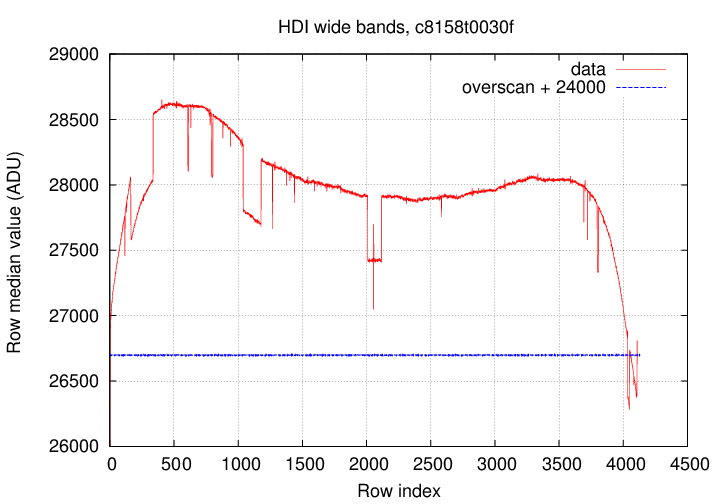
Note that the overscan region does NOT show the same changes. It remains constant. The "bands" are restricted to the data portion of the chip, as this closeup (below) of the image's right-hand side shows. I've modified the color maps, and done a bit of cut-and-paste, to show the very low overscan values at the same time as the much higher data values in this flatfield image; the important point is that the data region shows a large dip in brightness inside the band, but the overscan region shows no feature at all at the same location.