Brief introduction to JSkyCalc, a nice planning tool
Michael Richmond
Jan 7, 2018
One of the main tasks facing astronomers at the
start of an observing run, or the start of the night,
is making up an observing plan:
a list of the objects to be observed, in the proper
order to maximize the quality of each object's
data, and the number of objects observed.
This can be complicated, as each object has
its own window of time during which it may be
best studied.
A very nice tool to help with this job is the
program called
JSkyCalc,
developed by John Thorstensen of Dartmouth College.
It allows one quickly and easily to see when
a list of objects will rise, culminate, and set,
and how those times compare to sunrise, sunset,
and the position of the Moon.
Below is a very brief guide to installing and running
this program. It does not describe most of the
very nice features of the software.
- download and install
- This program is a single Java "jar" file, containing
everything it needs to run.
You must copy the file onto your computer
(and have Java installed, too, of course).
Download the file
and save it with the name "JSkyCalc.jar".
- run the program
- To run the program on a Unix-like system,
type
java -jar JSkyCalc.jar
You should see a couple of windows pop up,
like this:
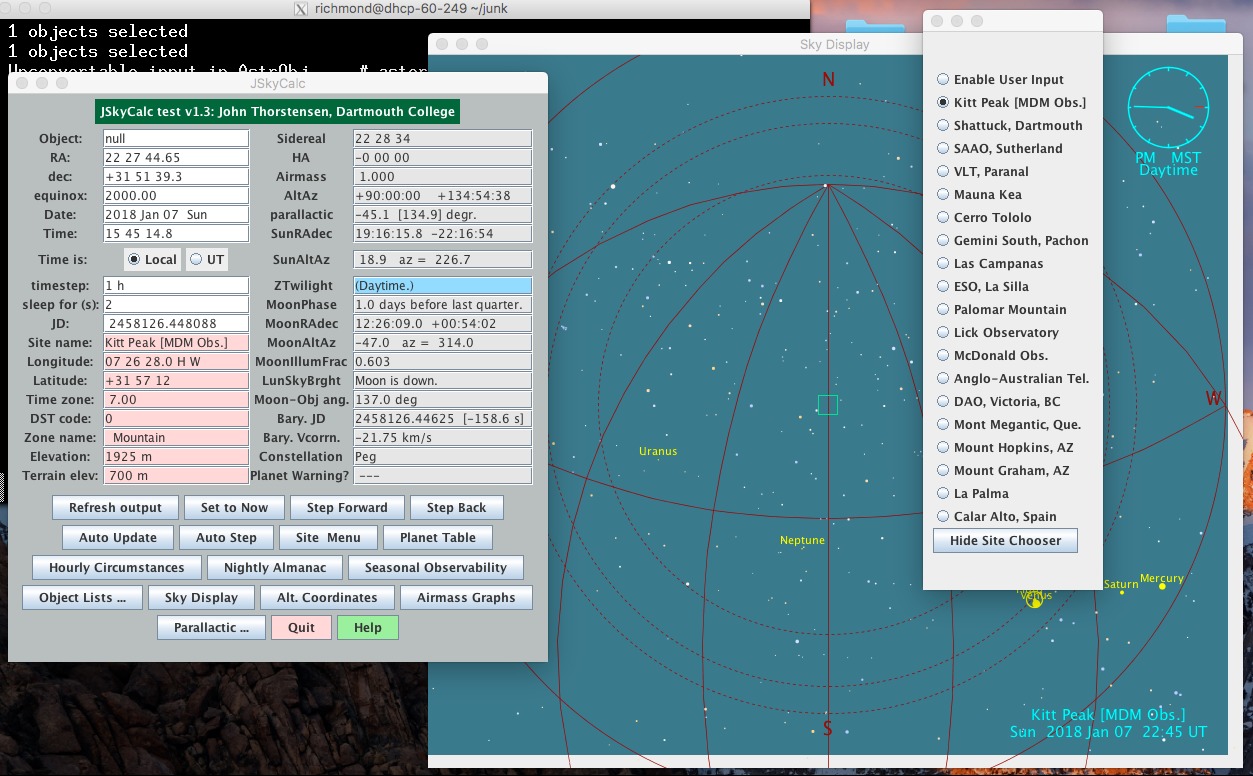
Set your location using the "Site Chooser" window
(at the right in the image above)
- create a list of targets
- Create a text file with a list of your targets,
one item per line.
Each line should at least 8 columns,
separated by spaces, looking like this:
V1647_Ori 05 46 13.135 -00 06 04.82 2000
The columns are
- object name. Do not use spaces, so
"V1647_Ori" instead of "V1647 Ori".
- Right Ascension, in format "HH MM SS.s"
- Declination, in format "DD MM SS.s"
- Equinox
You may have additional information in columns after the
equinox (I think).
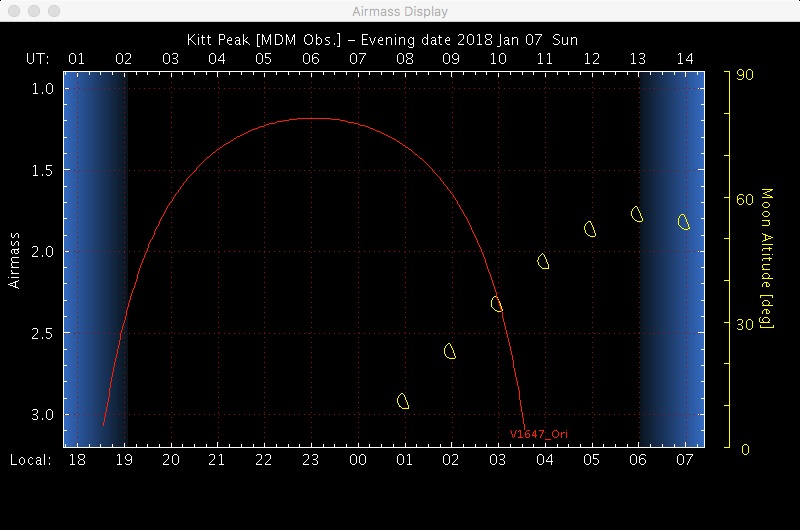
- make airmass graphs
- This is the payoff.
Once you've created the file with targets,
click the "Object Lists ..." button
in the main JSkyCalc window.
A new window will pop up:
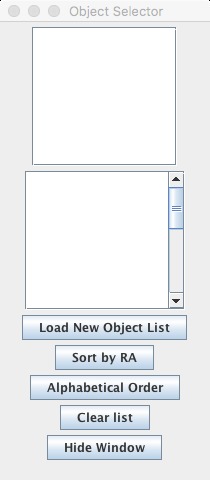
Click the "Load New Object List" button,
and select the file you've created with the target list.
You should see the list of objects appear in the
window's upper panel.
Next, click the "Airmass Graphs" button.
A new window will pop up.
Select one of your objects (or many of them),
and click "Plot airmasses".
You'll see a new window which tells you all
you need to know.