In order to determine the best focus position for the telescope, one takes a series of images, changing the focus position by some small stepsize each time. There is no simple way to automate this procedure of acquiring images -- but there is a piece of software which may help you to analyze the resulting images and pick the best focus position.
The very first thing you must do is to make sure you are logged into emerald as the user 36inch.
Next, type these two commands, one at a time, in the terminal window(s) you plan to use for all subsequent steps.
          bash

          heainit
Finally, make sure that all the focus images are in your current directory. You can read this section of the HDI manual to learn about the scripts
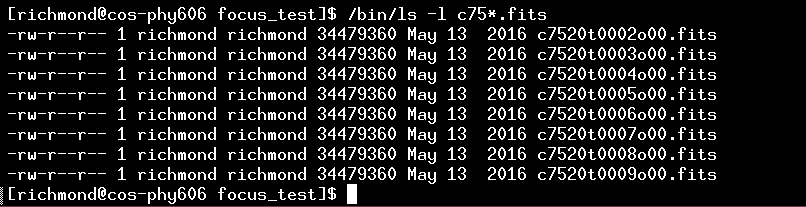
As an example, I've copied a set of focus images taken on 2016 June 19.
There are 9 images in this set, with names like c7543t0094o00.fits; the focus values range from 32851 to 33250.
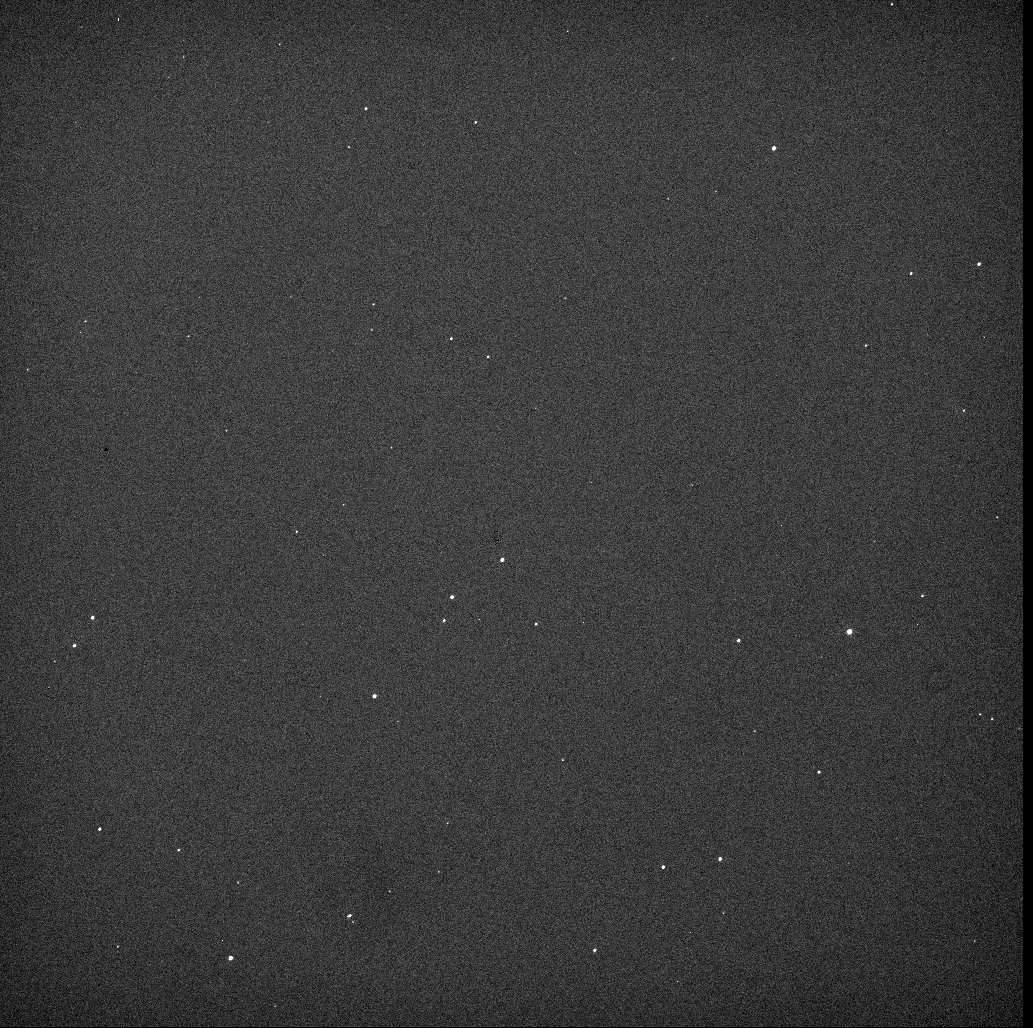
Humans can look at an image containing just a single star and determine a reasonable value for the FWHM or other property of the point-spread-function, but computers aren't as wise. In order for this script to do a good job, it needs at least 4 or 5 or 7 stars in the field of view which are reasonably bright. Here's an example of a good field: nothing crazy like an open cluster (though an open cluster would be fine), but a fair number of stars of roughly equal brightness.
Another difference between humans and computers is their ability to handle really out-of-focus stellar images. For example, a human can look at this
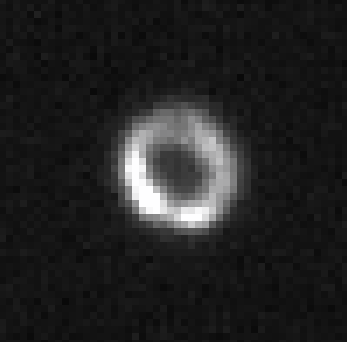
and figure out that the outer ring of this "donut" is about 25 pixels wide, while the inner ring is about 10 pixels wide. My software, on the other hand, doesn't even realize that something like this IS a star.
This particular "donut" was produced by moving the telescope 350 units away from best focus. So, watch out if any of your images are THIS bad; the script will probably fail to measure them accurately.
In other words, using a range of focus values which stretches from about -200 to +200 units around some guess at the proper value is a good plan.
If the stellar images look something like this
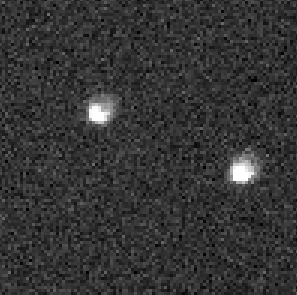
then the code will do just fine.
The next step is to run the do_focus.pl script. Usage is
Since all the images in my test set have names like c7543txxxxo00.fits, I can run the script by typing
Here's what happens when I do:
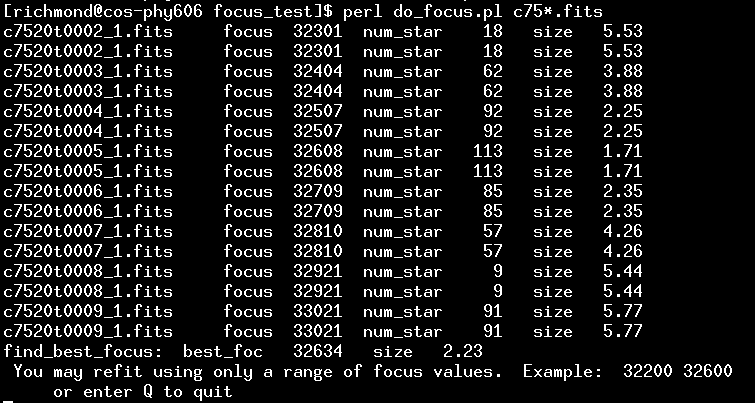
What's going on?
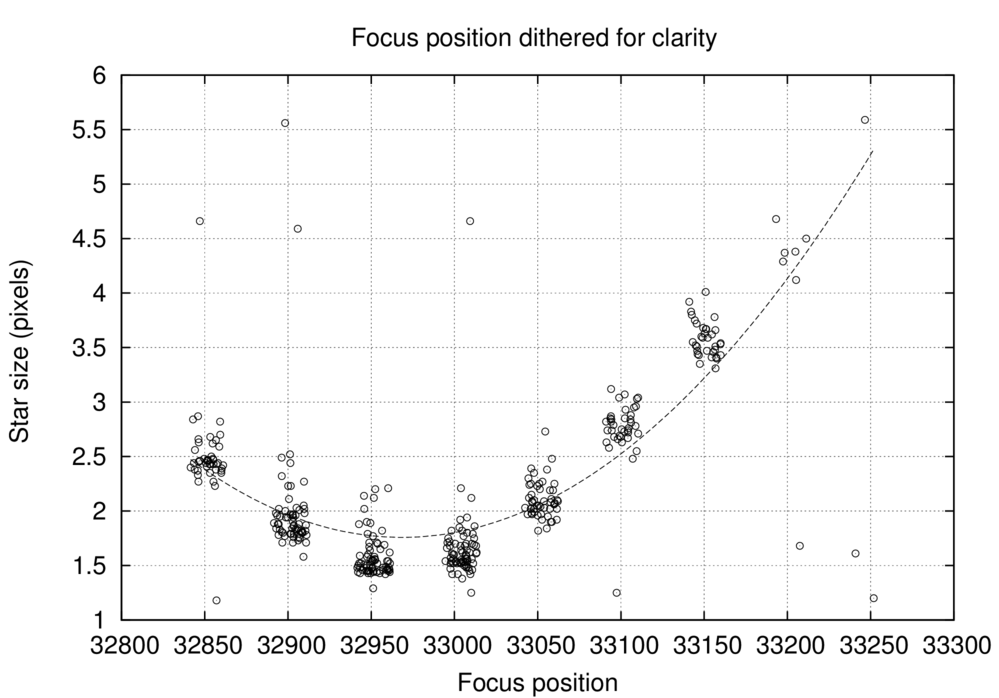
Now, the list of images, with number of stars and "size" of each, might be good enough for one to determine a good focus position. But to make it easier, the script will create a window (it may take a few seconds) showing a graph like this:
At the same time, the script will display a few lines of text in the terminal window:

The numbers here are a guess at the best focus position, based on a parabolic fit to the "star size" as a function of focus position. Where does it get the numbers?
So, at this point, if you are happy, you can simply type "Q" in the terminal window, and the script will terminate.
However, you may notice that some of the data on the graph are bogus; in the example above, for example, the measurements for images with focus position greater than 33200 look pretty sketchy. If you wish, you may type a pair of numbers, specifying a new range of focus positions to be used in the parabolic fit.
In the example here, I typed
and pressed the "Return" key, since I wanted to discard all the data with focus positions greater than 33170. After I did so, the script produced a new graph and fit:
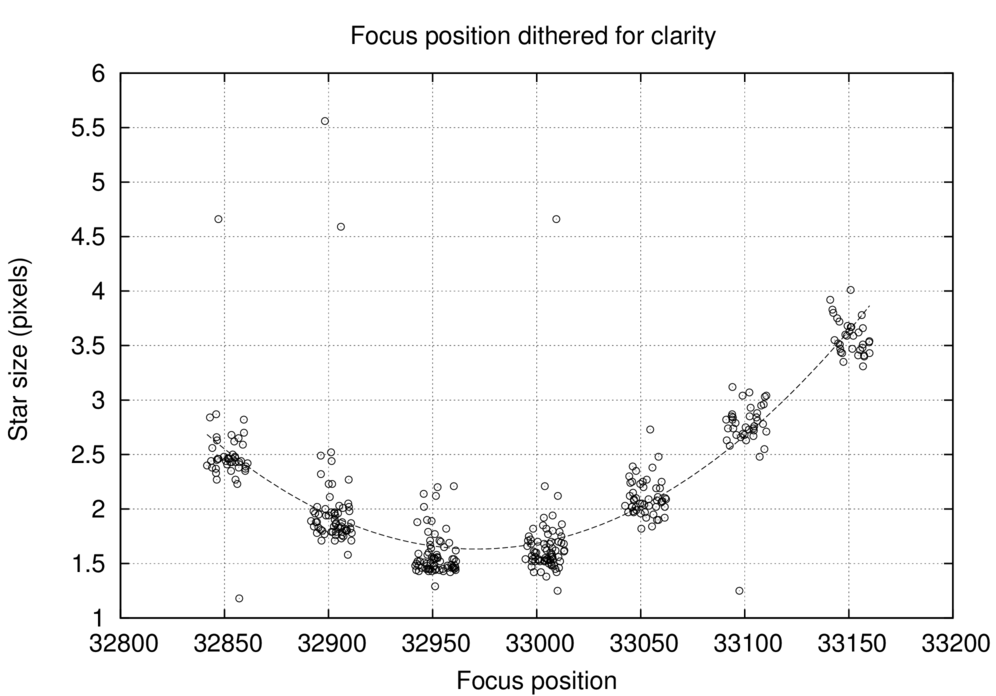
This fit looked fine, so I wrote down the fitted focus position (32971) and then typed "Q" to quit.