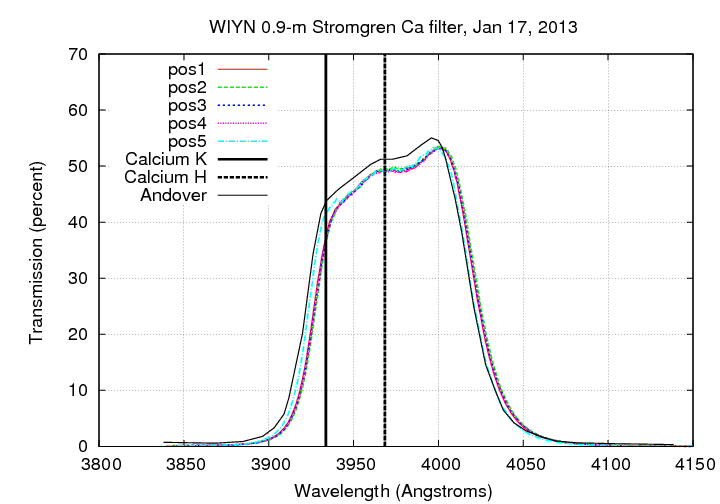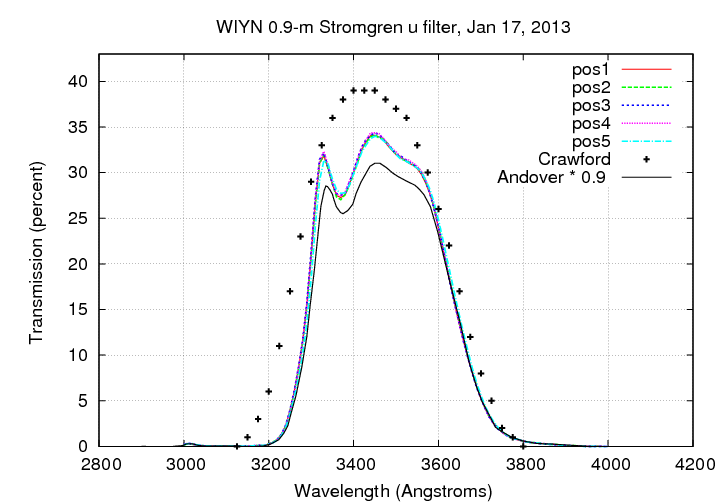
We have acquired a set of filters for the WIYN 0.9-m telescope which are designed to mimic the Stromgren intermediate-band photometric system. This document presents measurements of the filters made by Flynn Haase on Jan 17, 2013, using the Lambda 9 Spectrophotometer at KPNO.
Each filter was scanned at five positions. The values in the table below were taken from the scans in position 5.
| Filter | Central wavelength | FWHM | max transmission |
| (Angstroms) | (Angstroms) | (percent) | |
| u | 3467 | 339 | 34 |
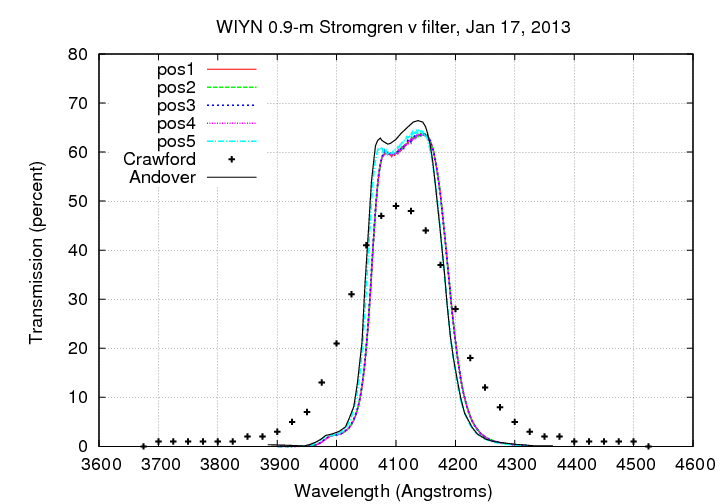
| v | 4117 | 133 | 65 |
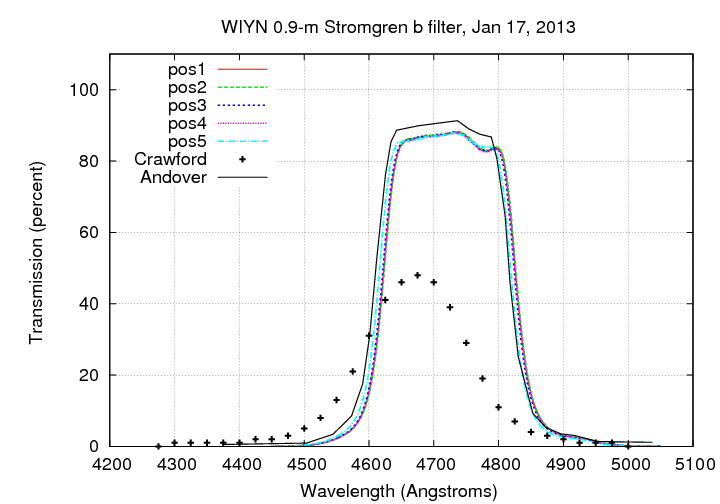
| b | 4718 | 208 | 88 |
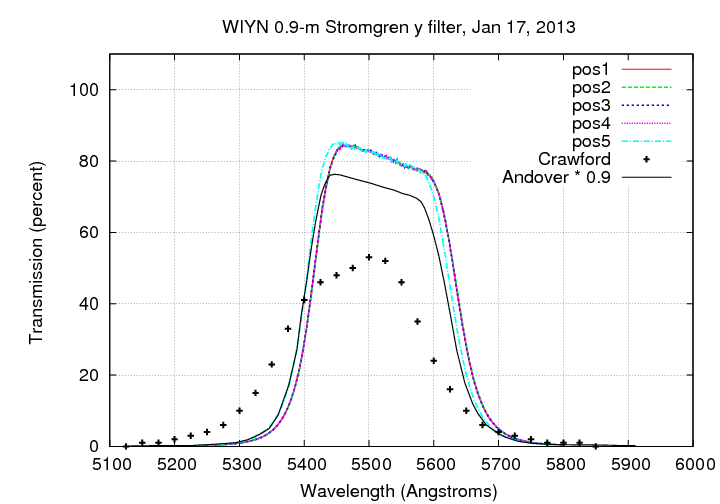
| y | 5514 | 227 | 85 |
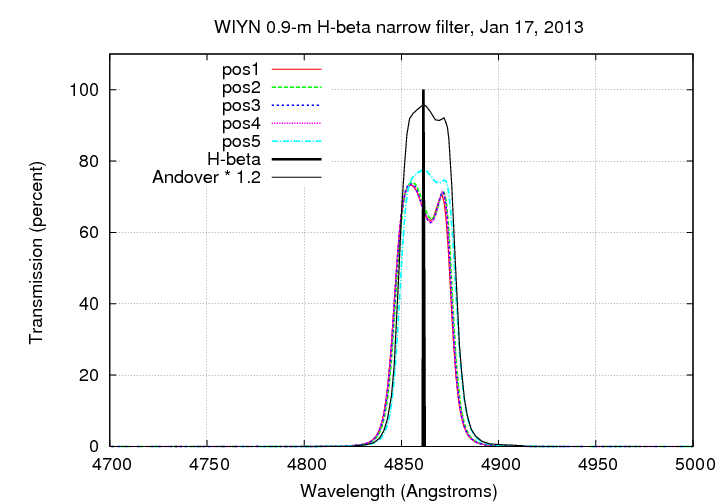
| H-beta narrow | 4864 | 30 | 78 |
| H-beta wide | 4876 | 139 | 90 |
| Calcium | 3972 | 96 | 53 |
Click on the links in the table below to download ASCII text files with data from the scans. The format of each file is a header with lines starting with "#", followed by two columns of data in each line: wavelength (Angstroms) and transmission (percent). An example is shown below:
#== Filter Data - Lambda 9 Spectrophotometer ==
#  Kitt Peak National Observatory - NOAO
#------------------------------------------------
#Filter: u_POS1
#Date: 01/16/13   Time: 13:50:29  Operator: FH
#cwl=  3462.33A  fwhm= 338.93A  Tmax= 34.08% at  3450.00A
#Tcutoff=  2.00 %  Slitsize =  3 A
#fwhm spans 3292.86A to 3631.79A
#90%  spans 3319.14A to 3543.95A
#bw90 is  0.663; Tmin90/Tmax is  0.800
#No data smoothing
#
#Npts=  101     Disp= 10.00A/Interval
#*****
  3000.00     0.175
  3010.00     0.295
  3020.00     0.230
  3030.00     0.135
| Filter | pos1 | pos2 | pos3 | pos4 | pos5 |
| u | u-pos1 | u-pos2 | u-pos3 | u-pos4 | u-pos5 |
| v | v-pos1 | v-pos2 | v-pos3 | v-pos4 | v-pos5 |
| b | b-pos1 | b-pos2 | b-pos3 | b-pos4 | b-pos5 |
| y | y-pos1 | y-pos2 | y-pos3 | y-pos4 | y-pos5 |
| H-beta narrow | Hb-n_pos1 | Hb-n_pos2 | Hb-n_pos3 | Hb-n_pos4 | Hb-n_pos5 |
| H-beta wide | Hb-w_pos1 | Hb-w_pos2 | Hb-w_pos3 | Hb-w_pos4 | Hb-w_pos5 |
| Calcium | Ca-pos1 | Ca-pos2 | Ca-pos3 | Ca-pos4 | Ca-pos5 |
The data labelled "Crawford" is from the paper which defines the Stromgren filter system, Standard stars for uvby photometry by Crawford, D. L., and Barnes, J. V., AJ 75, 978 (1970).
The data labelled "Andover" is based on scans of the filters provided by the supplier, Andover Optical. They sent us a PDF with graphs of the transmission curves; I digitized the graphs and extracted numbers to plot on these graphs. I've scaled some of the Andover transmission values for clarity.
Stromgren u

Stromgren v
Stromgren b
Stromgren y
Narrow H-beta
Wide H-beta

Calcium H and K
