A detailed description of this problem and its solution can be found in HDI Technical Notes 14 and 15:
Starting in December, 2015, observers reported that some HDI images showed higher-than-normal levels of noise: roughly 30 counts RMS, rather than the normal 6 counts. There was a strong herringbone pattern to the noise, suggesting a problem with electronics. The problem occurred occasionally through March, 2016, when it became nearly constant.
Thanks to the efforts of Flynn Haase, Nathalie Haurberg and her student Izak, the problem was traced to a grounding wire within the HDI electronics unit which had become loose. When the grounding wire was properly re-connected, the noise disappeared.
Flynn made a semi-permanent fix in early April, 2016, and we have not seen the problem since that time.
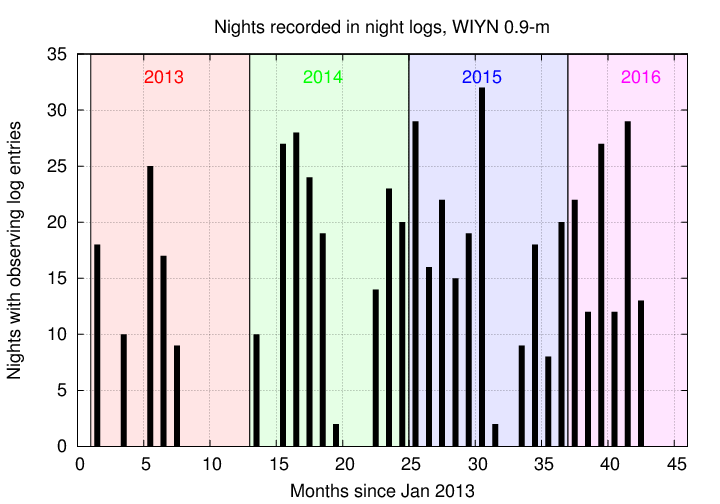
Users of the WIYN 0.9-m telescope are asked to fill out a web page at the end of each night, describing the duration of the night, the fraction of time spent in various categories, the seeing, and a few other items. I collected the logs written between Nov 2013 and June 2016. Below are simple summaries of the information contained in these logs.
The number of nights used during each month has averaged about 19 during the first half of 2016.
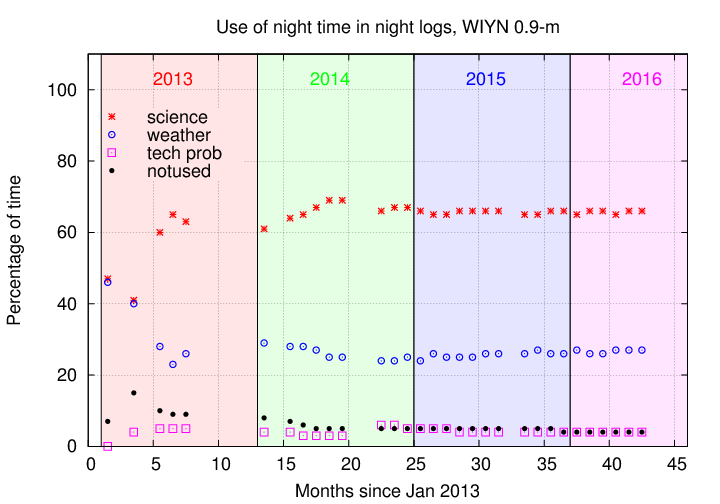
How have we used the time during each night? Observers are asked to record the number of hours between sunset and sunrise, and the number of hours spent doing various operations. Roughly two-thirds of the scheduled time each month is spent doing science; in other words, about one-third of the scheduled time is lost to bad weather or (much less commonly) technical problems.
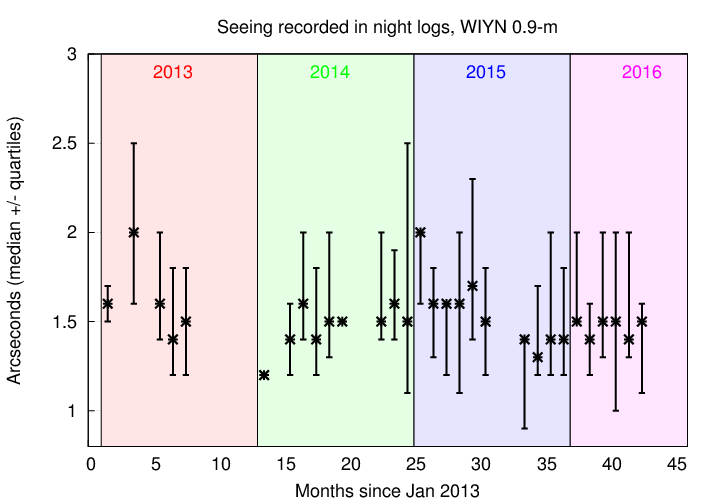
The "seeing" is a rather vague term, and its definition may vary slightly from one user to the next. One might assume that it is related to the FWHM of a stellar image. I took all the values reported by users during each month, and computed the quartile values. The graph below shows the median seeing in arcseconds (symbol) with errorbars running up to the 75th and down to the 25th quartile. The typical value appears to lie between 1.5 and 2.0 arcseconds.
Below are graphs showing HDI temperature (left-hand panels) and pressure (right-hand panels) over the past 3 years, summer 2013 to summer 2016.
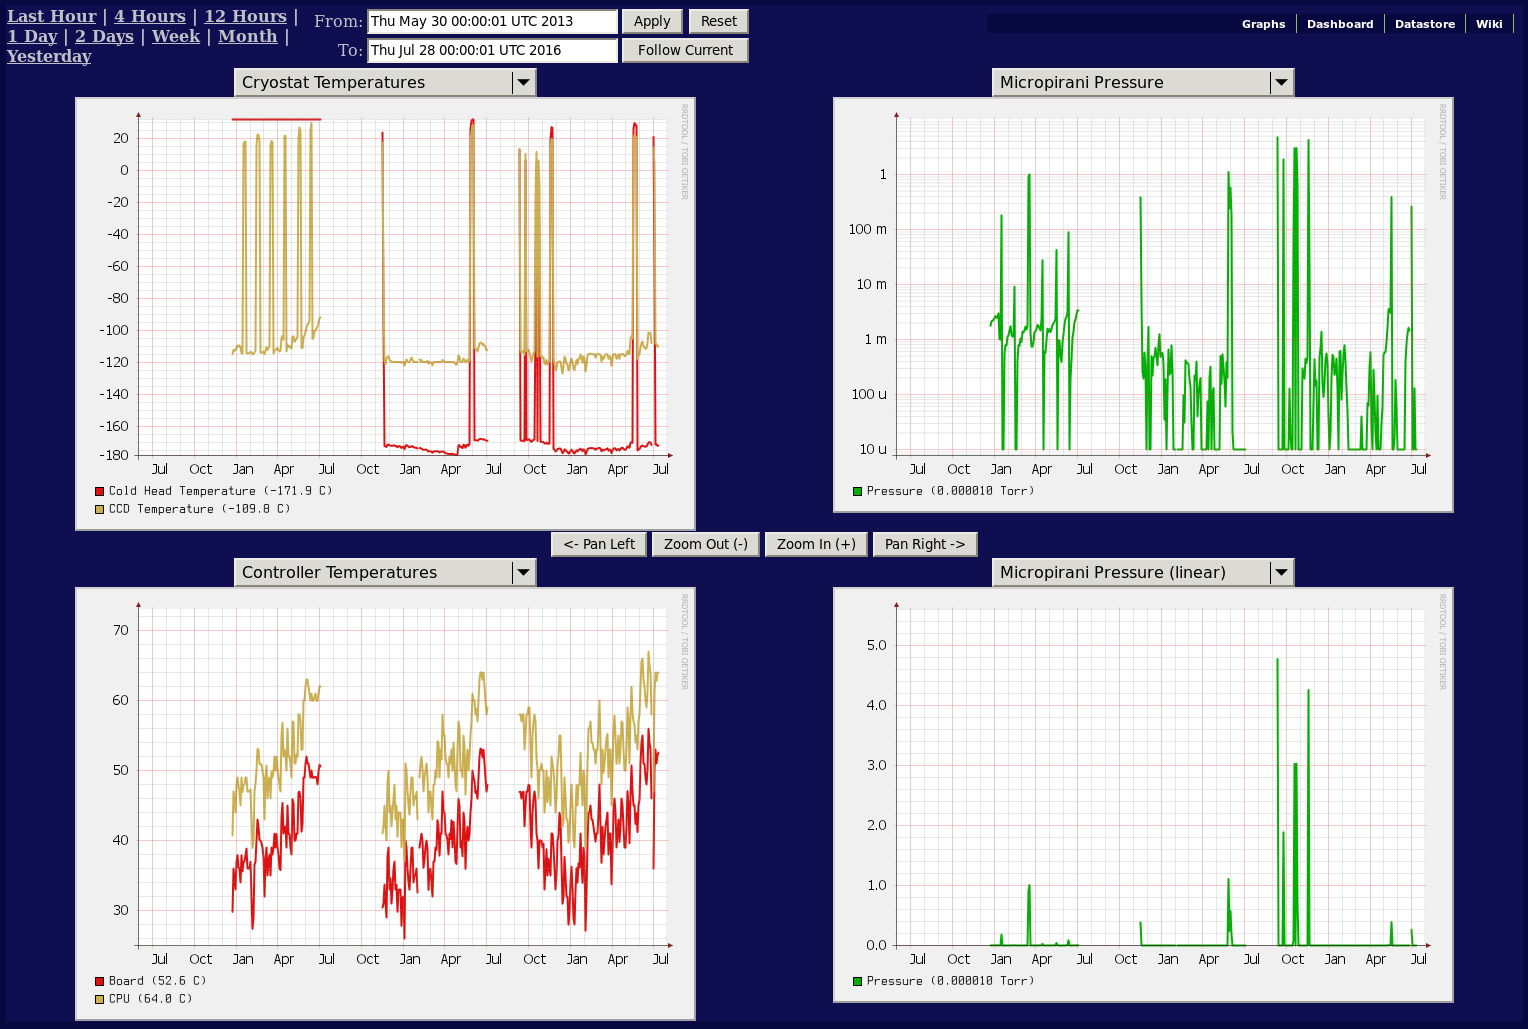
The top-left panel shows that HDI was warmed up to room temperature several times in the fall of 2015, but only once since that time, in May, 2016.
The bottom-left panel shows annual changes in temperature. Note that summer of 2016 reached significantly higher temperatures than the summer of previous years. These very high temperatures caused HDI to print warning messages to the console, stating that it was close to overheating. We advised users not to operate the camera when those messages appeared. Flynn Haase is currently investigating how small computer fans might be attached to the HDI enclosure to push hot air out and cool the electronics.
The top-right panel shows that the pressure inside HDI was consistently low for most of the past year. That's good news.