The source_stack table contains a large number of magnitude measurements for each detection. In this note, I compare the scatter in repeated measurements of objects in a small region for four particular choices of aperture size: magaper120_zmr, magaper140_zmr, magaper175_zmr, magaper245_zmr. The database contains measurements of these types starting in Dec, 2022, so the first three years of Tomo-e operations are not available. If one uses these values as they appear in the source_stack table, one will find significant differences in the scatter from the mean value: large apertures are better for bright stars, and small apertures better for faint ones. If one applies ensemble analysis, however, one finds that all aperture sizes yield much improved results; by a very marginal degree, the magaper140_zmr option is probably the best choice in general.
The source_stacked table contains many different varieties of calibrated magnitudes for each detected object. We will examine here four varieties of aperture magnitudes, all of which are calibrated using the _zmr method (PS1 r-band with no color term).
Each magnitude has an associated estimate of the uncertainty, based on SExtractor's measurements of the signal and noise inside the aperture; these uncertainties have names like magaper120err, magaper140err, and so forth.
In order to speed up the calculations, I restricted this comparitive study to a relatively small region on the sky: a 3-by-3 degree region centered on RA = 180, Dec = +5. I divided the region into "patches" of size 0.25 degrees on a side, each of which was analyzed as an ensemble. There were 156 patches in this area.
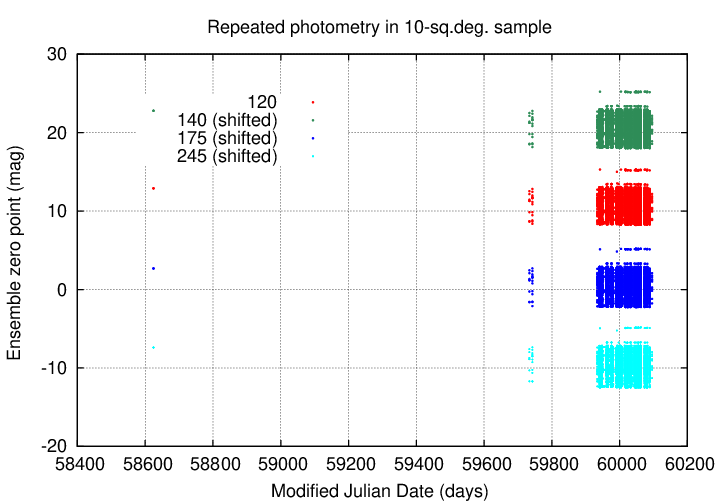
The figure below shows the time coverage of measurements in the source_stack table.
It appears that reductions of the Tomo-e data did not include aperture photometry of any of these sizes until Dec, 2022. We therefore cannot use aperture magnitudes to investigate objects in the span 2019 to 2022, unless we re-measure all the images with SExtractor.
We will begin by looking at the magnitudes in the source_stack table with no adjustments. For each patch in the study area, we identify all measurements of the same star, and compute the 25th, 50th, and 75th percentiles of those magnitudes. We can then define
   "mean" magnitude           =    median value

   uncertainty in magnitude   =    (75th - 25th) percentile
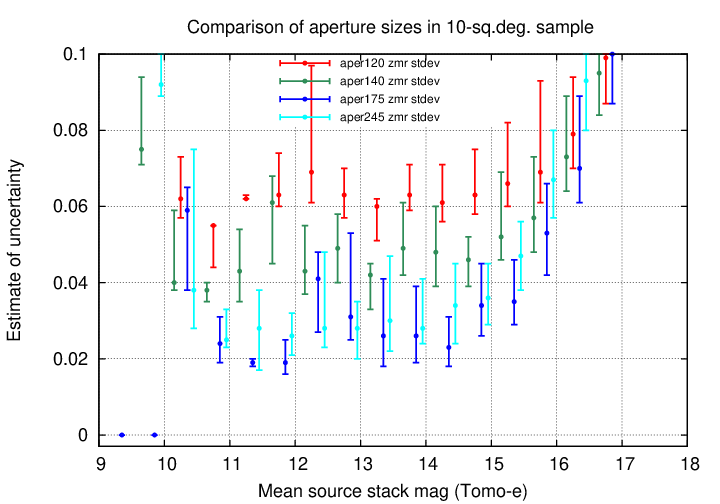
The graph below shows the uncertainty as a function of "mean" magnitude. It is clear that the smallest aperture has the largest scatter at bright magnitudes, but the smallest scatter at faint magnitudes.

We can zoom in to concentrate on the regions of smallest scatter.
Now, we can apply ensemble analysis to the data based on any choice of aperture size. The graph below compares the standard deviation from the mean ensemble magnitude to those based on the source_stack values.
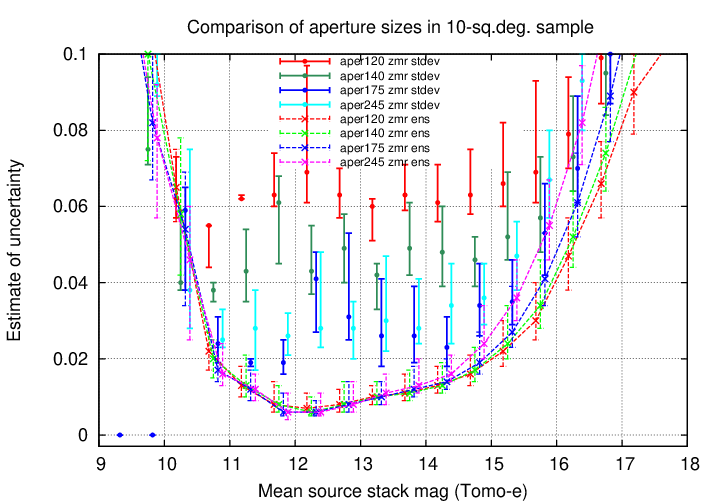
Two facts are clear from a glance at this graph:
We can zoom in future to examine the properties of ensemble solutions for different apertures sizes.
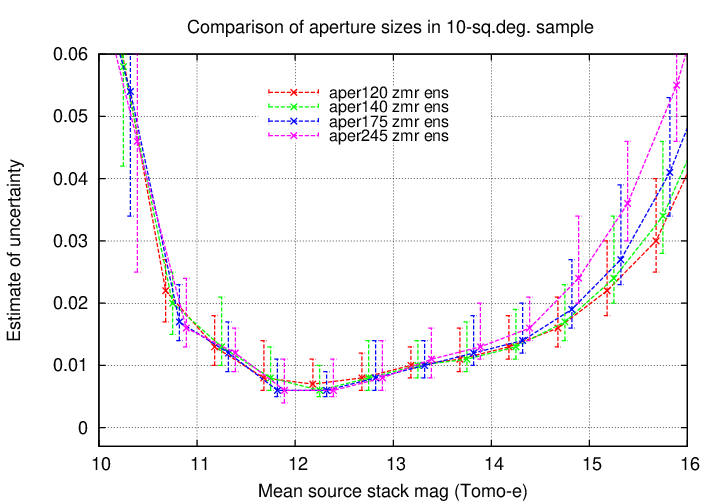
This graph shows
My conclusion is that, if one must choose a single aperture size for some large project, the best choice would be one of the smaller ones: magaper140_zmr might be my choice.