This document describes a simple analysis of the differences in photometric calibration between chips in the prototype Tomo-e PM camera.
The data used in this analysis was taken with the 8-sensor prototype Tomo-e PM camera, during the period Mar 15 to Apr 14, 2016. The eight sensors were arranged in a line stretching across the focal plane.
I used the results of the transient search pipeline to conduct these tests. The stars found in each image were calibrated astrometrically against the UCAC4 catalog, and a subset of stars in the range $9 < V < 15$ were used to calibrate the photometric measurements. The calibration was performed in two ways, which provides two different types of information:
Note that I compared the UCAC4's V-band magnitudes to the unfiltered Tomo-e measurements.
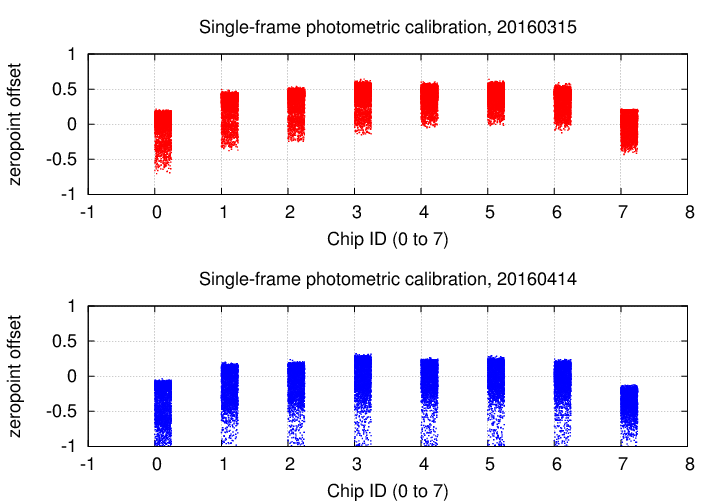
In the graphs below, the y-axis shows the difference between the instrumental magnitude and the UCAC4 V-band magnitude of stars in each image. There are thousands of images taken by each chip during a single night, so there will be thousands of symbols. The values for a single chip will vary over the course of a night, due to changes in extinction as the field(s) rise and set, and due to changes in transparency.
The first graph compares the offsets for the 8 chips on two nights. Note that the chips near the edges of the focal plane, chips 0 and 7, have the largest offsets. The pattern of these offsets looks very similar on the two nights, suggesting that the offsets are due in part to vignetting.
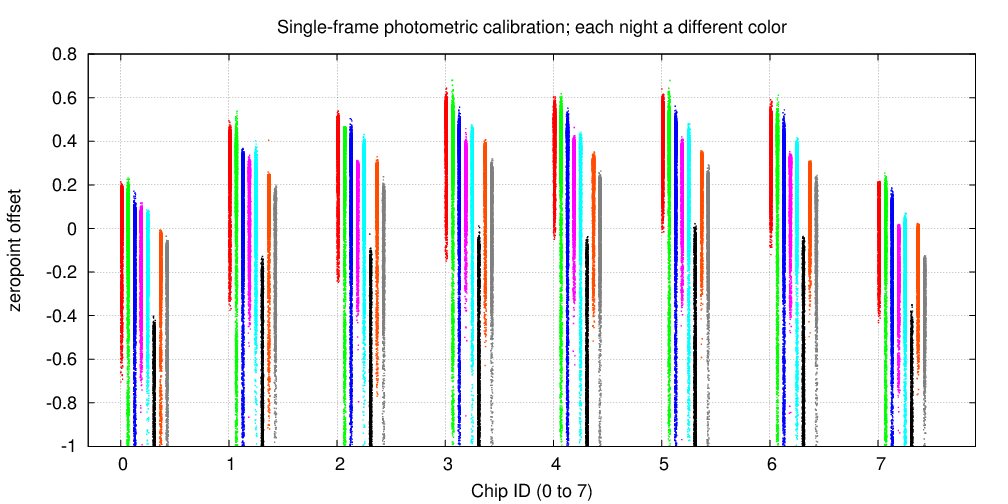
The second graph compares the offsets for the 8 chips on all eight nights for which we have measurements. I've offset the symbols for each night horizontally by a small amount, and changed the color of the symbols for each night as well.
The patterns are very similar on all 8 nights.
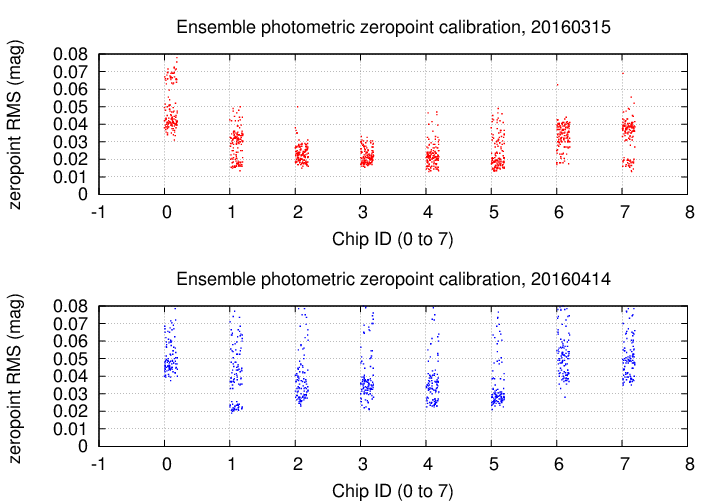
The zero-point differences between ensemble and catalog magnitudes is not a useful quantity, as it can be biased by the exact choice of the brightest star included in the ensemble. But the scatter in the relationship between ensemble and catalog magnitudes is interesting: it describes how uniform the zero-point relationship is across a single sensor.
Below are graphs showing this quantity for each chip over the course of two nights: 0315 and 0414. Note that the scatter is considerably smaller in the central chips than in the outer ones, especially chip 0.
The same quantity is shown below for all 8 nights, using a different color for the measurements on each night.
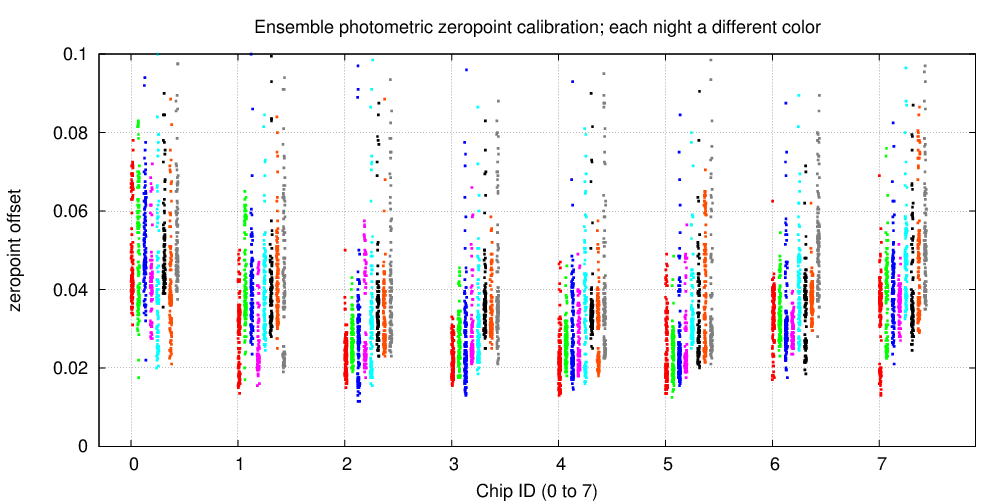
I belive it is possible that the increased scatter for the outer chips is not only a consequence of vignetting -- which reduces number of photons and hence S/N of every star -- but also due to an increase in chromatic aberration and off-axis distortions in shape. Recall that we are comparing UCAC4 V-band magnitudes to the instrumental magnitudes of unfiltered Tomo-e measurements. If the outer chips suffer from significant chromatic aberration or distortion, stellar images may have significantly different SHAPES on different sides of a single image; that could yield a bias in aperture photometry across the chip.