There are (at least) two important factors in the Tomoe pipeline which affect the number of objects which are identified as "stars" and measured. These are
This note takes a brief look at the result of changing the settings of these two variables on a small dataset from Apr 11, 2016.
I'll describe the results of 4 runs through the same set of data, using different choices of the parameters.
The dataset is the composite FITS file TMPM0109330.fits, which contains 360 Tomoe images taken during a period centered on JD 2457490.1051285 = 2016 April 11 14:31:23. The field location is
(J2000) RA = 196.5758 Dec= -16.2223
I ran the pipeline through this dataset, using 4 different combinations of parameters:
Let's begin by making a small grid of values of these parameters:
| Parameter | R | P | T | U |
| minsig | 10 | 5 | 5 | 5 (*) |
| num_det | 10 | 10 | 5 | 5 |
| stars in final output | 137 | 307 | 430 | 295 |
| time (sec) to find stars | 76 | 180 | 177 | 141 |
Note:
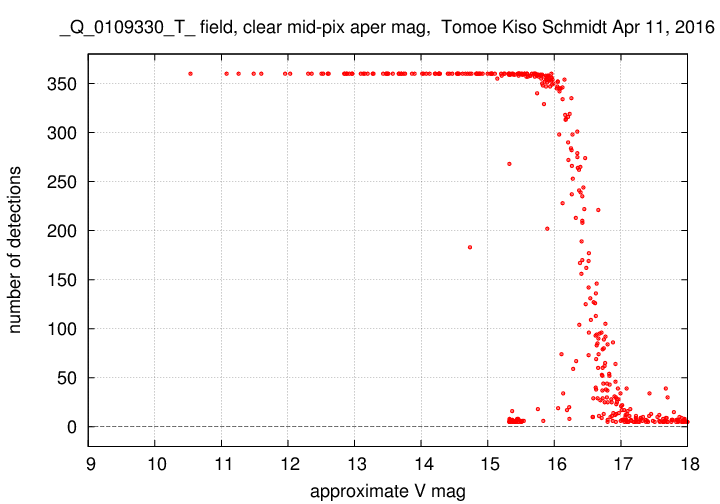
Now, let's look at one way to describe the results: a graph showing the number of times an object was detected (out of 360 images), as a function of the object's V-band magnitude. We would expect that bright objects should appear in all 360 images, and faint objects in only a few.
We'll go through the results the order described above: R, P, T, U.
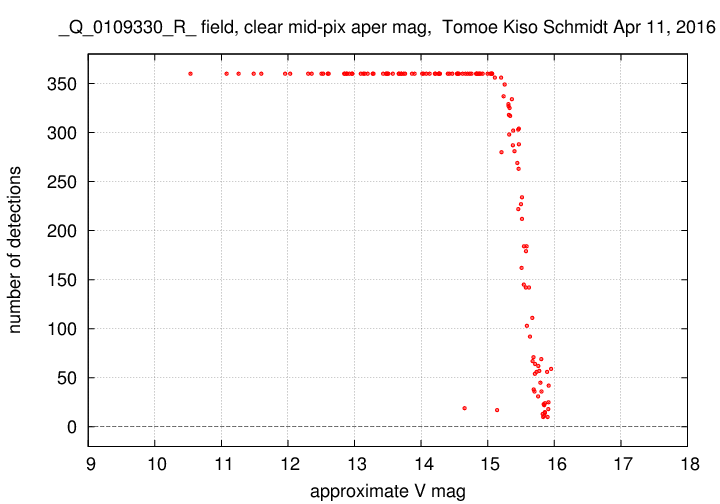
Case R: the "clean" output
This is exactly as we expect: the bright objects are detected in all 360 images, but near the faint end, objects are detected in only a fraction of the images. The very faintest objects are seen in very few images.
Note two slight outliers: the objects around V = 14.7 and V = 15.1, with only about 15 detections each.
The fainter of these is close to the edge of the field. Most of the time, the star-finding algorithm ignores it because it is too close to the edge; but in a few images, random motions of the telescope or atmosphere cause it to shift a small distance away from the edge; and then it IS detected.
The other object is a faint companion to a brighter star. In this case, the companion is about 1.7 magnitudes brighter (V = 13.0 vs 14.7). Most of the time, the star-finding algorithm ignores the faint object; but occasionally, when the seeing improves, the brighter object's light does not contaminate the fainter object, and so it is found.
We can expect real stars like these to appear as outliers in our final scientific output.
Case P: the "dirty" output
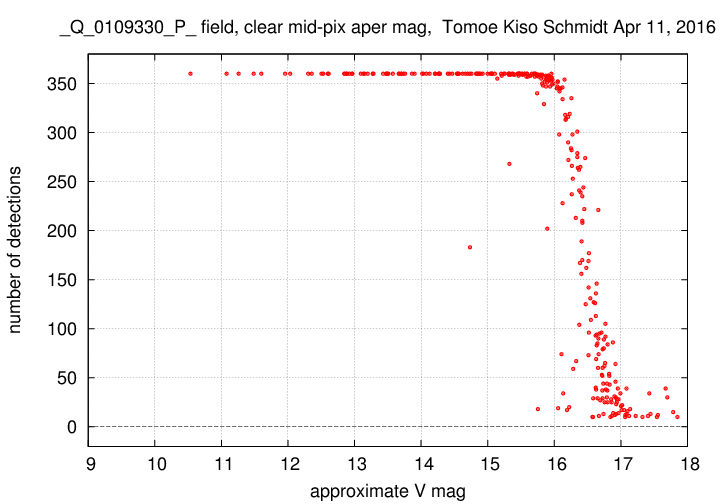
When we lower the minsig parameter from 10 to 5, we detect many more faint objects. Note that the limiting magnitude of the output here is about one magnitude fainter than the previous run.
However, many of these faint objects may not be real.
Case T: the "very dirty" output
When we also lower the num_det parameter from 10 to 5, there is a big increase in the number of very faint objects, especially those which are beyond the V = 17 limit of (probably) real stars.
Most interesting here is the clump of objects which appear at about V = 15.5, at between 5 and 10 detections each. They are far about the plate limit -- what are they?
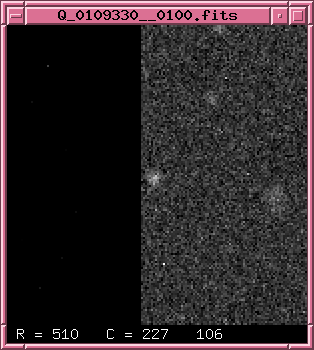
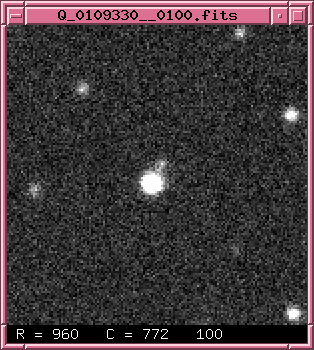
Below are cutouts of one particular image from the set, showing the locations of items in this clump.
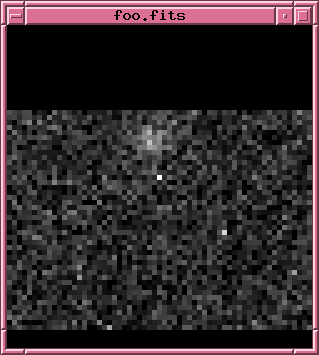
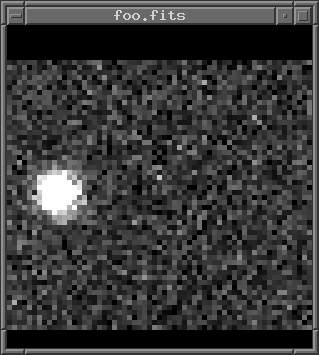
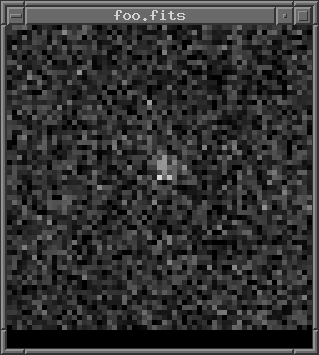
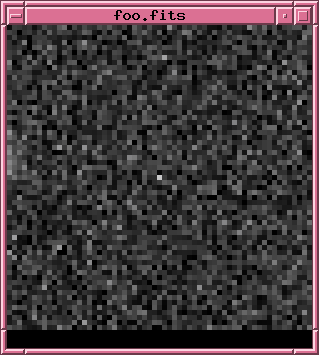
It turns out that all these objects are single bright pixels. However, the pixels do not appear bright in all images; in most images, they look normal. It is only in 5 to 10 images (out of 360) that these pixels are bright.
I do not understand this. It might be a hardware issue, it might be some sort of defect in the silicon, or ... I don't know.
However, the point remains that there are a considerable number of such single-pixel "junk" objects present in the dataset. If we wish to search for faint transient objects, these "junk" detections will be a source of confusion.
I modified the star-finding code in the XVista package so that it includes an optional test. When a high pixel value is discovered, it triggers a number of calculations and tests (brightness, size, shape, etc.). If the candidate passes all the tests, it is placed into the output as a star.
I added one test which does a simple check to detect single high pixels (but not multi-pixel cosmic-ray events). The calculation applies the following kernel to the (sky-subtracted) pixel values centered on the peak pixel:
               0    -1    0
              -1     1   -1
               0    -1    0
In other words, it subtracts the sum of the four-closest neighboring pixels from the value of the peak pixel itself.
Roughly speaking, a real star -- with a typical FWHM of several pixels -- will yield a value of the sum which is negative: the neighbors are close to the value of the peak. But an isolatd hot pixel will yield a positive result: it is much larger than the zero-ish values of the pixels around it.
The exact threshold at which objects are classified as "stars" or "junk" can be adjusted. I set the threshold to zero, and re-ran the pipeline to produce output in the set called "U".
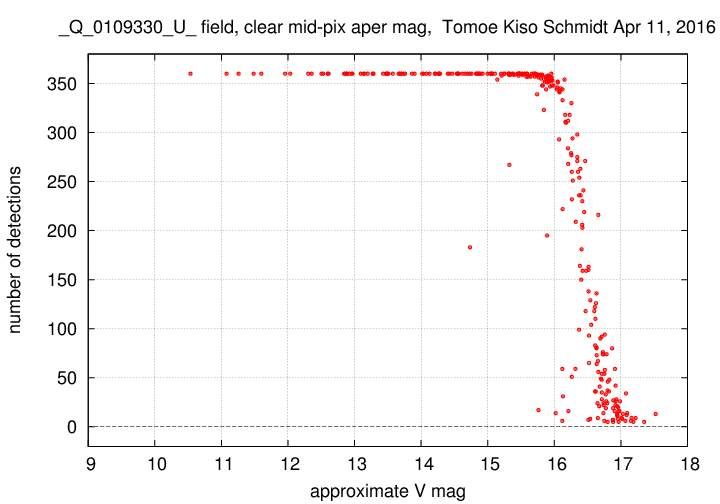
This simple additional test has eliminated the entire clump of "junk" objects at V = 15.5. It makes very little change to other objects: the bright objects are still detected in all 360 images, and the objects fainter than V = 16.0 typically lose 1 or 2 detections each.
I suggest adopting this additional test for all future Tomoe analysis.
In the graph above, there are several objects brighter than V = 16.0 which are detected fewer times than most; for example, one at V = 14.7 which is detected about 180 times. These are the same objects that appeared down near the bottom of the graph in the "clean" run R; when the minsig parameter is decreased from 10 to 5, they are detected in many more frames.