The "pdm" program was written by Patrick Wils. It uses a technique called "Phase Dispersion Minimization" to look for periodic signals in a light curve.
Here is how to call Patrick's program (written in C) directly from the shell:
          pdm   min_freq  max_freq  freq_step   datafile

where
              min_freq      is the minimum frequency (cycles per day)
                                for which to perform calculations

              max_freq      is the maximum frequency (cycles per day)
                                for which to perform calculations

              freq_step     is the change in frequency by which the
                                program iterates from min_freq to max_freq

              datafile      is the name of a file with measurements of
                                a star, in a format described below
The "datafile" must have lines with exactly two columns of numbers, like this:
      605.720 9.464
      605.721 9.462
      605.723 9.471
where the first column is Julian Day, and the second column is the magnitude in one band.
So, for example, if you have a datafile with measurements of X Ceti in V-band called "xceti_v.dat", you might run the program like so:
pdm 0.001 0.005 0.0001 xceti_v.dat
which would search for periodic signals with
               frequency             period
               (cycles per day)      (days)
-------------------------------------------------------
 starting at       0.001             1000  (= 1/0.001)

 ending at         0.005              200  (= 1/0.005)

 in steps of       0.0001            (see below)
-------------------------------------------------------
The first few frequencies checked would be
             0.001  cycles/day   =    1000  day period
             0.0011              =     909
             0.0012              =     833
and so forth. Notice that the program checks regular intervals of frequency, which means UN-equal intervals of period.
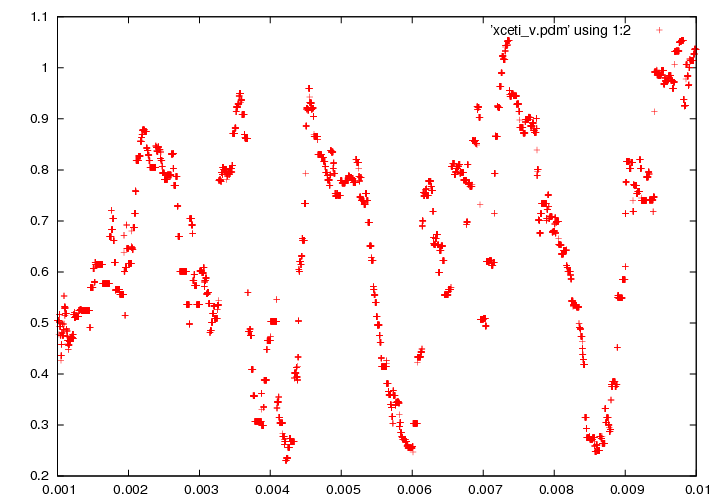
The output of this program is a simple two-column series of numbers, like this:
       0.000319 0.916
       0.000354 0.916
       0.000390 0.947
       0.000425 0.660
       0.000461 0.624
       0.000496 0.624
The first column is the frequency of oscillation (cycles per day), and the second number is a measure of the goodness-of-fit of the signal. SMALL values mean a GOOD FREQUENCY. The minimum value in the output is (in theory) the best frequency. So, in the example above, the best values are
     best frequency about 0.00048 cycles/day
  or
     best period about 1/0.00048 = 2083 days
The C program runs quickly. Example:
         xceti_v.dat            71 measurements

  $  time ./pdm 0.001 0.010 0.000001 xceti_v.dat > xceti_v.pdm
  0.11user 0.00system 0:00.15elapsed 75%CPU (0avgtext+0avgdata 0maxresident)k
In other words, checking for 9000 frequencies (9000 periods) between 0.001 and 0.010 cycles/day (period between 1000 and 100 days) took only 0.15 seconds of clock time. No problem.
The result

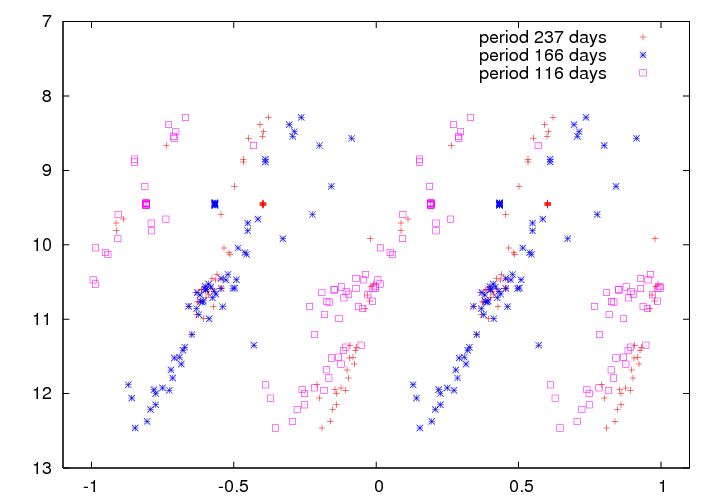
Based on this analysis, we see that there are three possibilities for the period of the star:
       frequency  0.004216   -> period  237 days

       frequency  0.006010   -> period  166 days

       frequency  0.008574   -> period  116 days
If we compute the phase of the data with each of these periods, then make a graph which shows two full cycles of each trial period, we see that it's not exactly clear which is the best choice:

I'd probably go with the 166 day period....
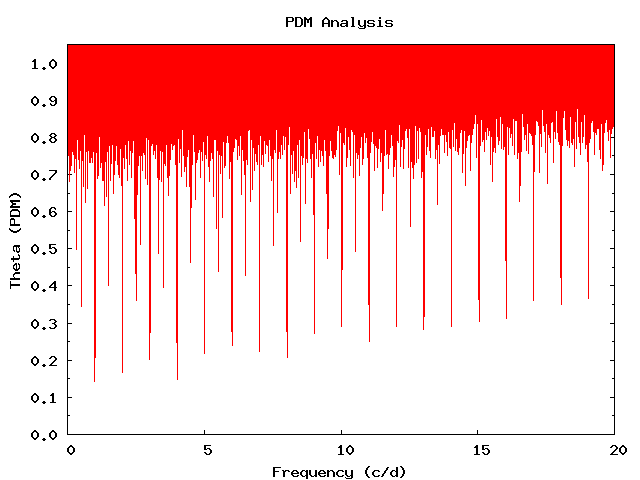
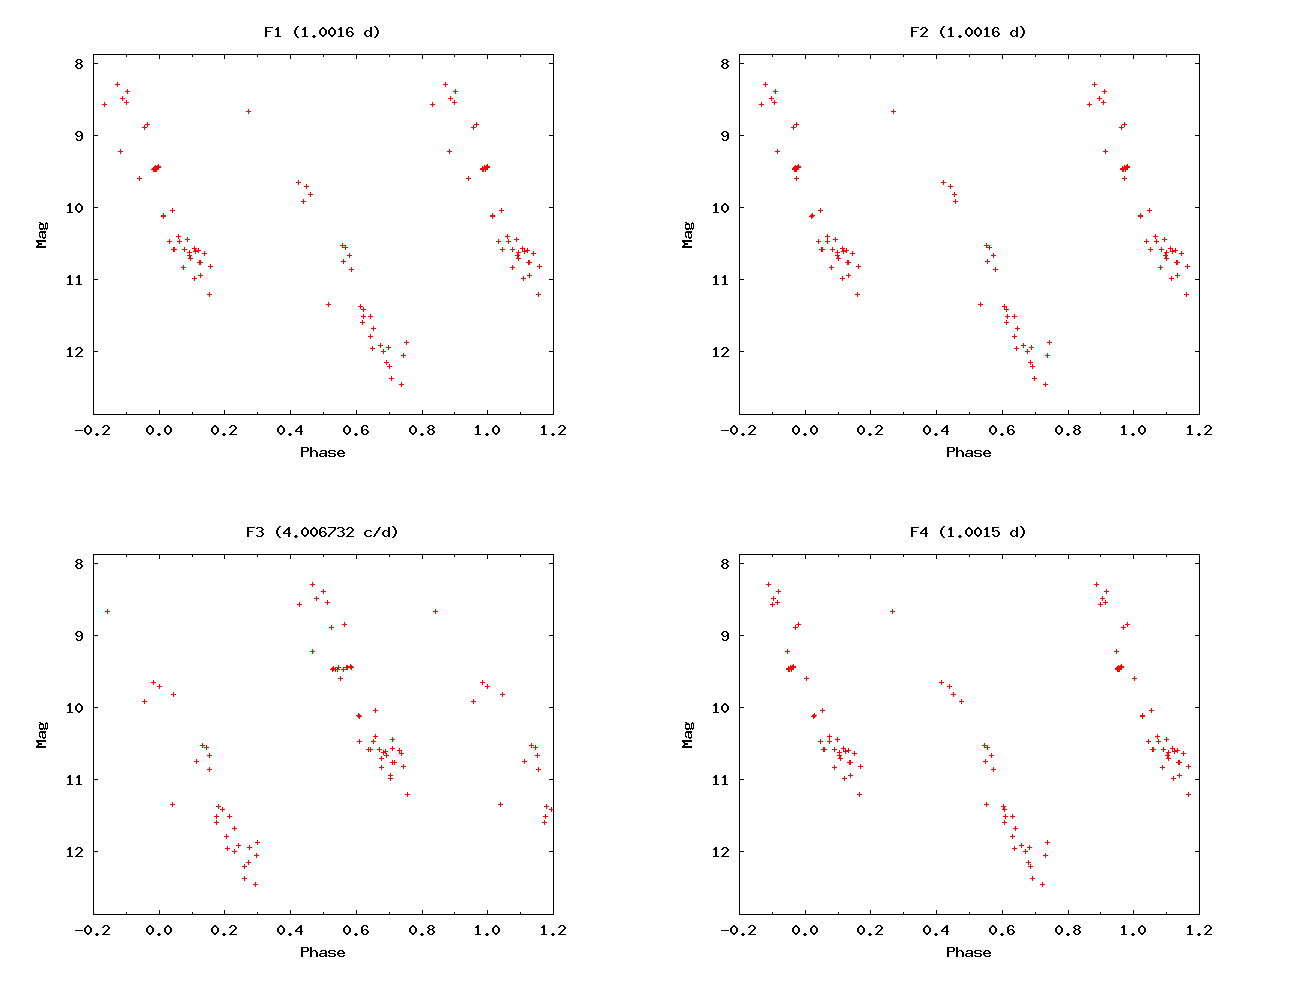
Patrick wrote a good deal of Perl code which will take the output of this program and produce some nice graphs. If you want to use this additional code, I suggest that you use a little Perl script I wrote to invoke it. My Perl script is in this directory, called my_period.pl.
If you edit this file, you'll right at the top two items that you need to change:
# this is the name of the star, used for giving names
#    to output files
$starname = "XCeti";

# this is a datafile which contains 2 columns of data
#    JD   mag
#    JD   mag
#    JD   mag
# etc.
# You must separate the V-band and I-band magnitudes
#   yourself, and present just one band at a time
#   to this script.
$stardata = "./xceti_v.dat";
Replace the string "XCeti" with the name of your target star, and replace the string "./xceti_v.dat" with the name of a file containing JD and magnitude measurements (and nothing else) for the star of interest.
Then run the Perl script like so:
perl my_period.pl
You should see several messages print out as it goes:
Star = XCeti
Data read
Analysis done
Analysis plotted
Phase plots created
This will take some time -- it took 16 seconds to complete the analysis and graphing of the X Ceti datafile I mentioned earlier.
Note that you do NOT have any control over the frequency range in this case (unless you want to hack the Perl code in Period.pl).
The results of this fancy analysis are:

