Thanks to Roger Pickard, I have fixed a mistake in the estimate of the Spink image magnitude. It is now considerably fainter than my initial value. MWR 2006 Dec 9, 10:25 PM EST.
Contents:
In late October, 2006, an ordinary star in Cassiopeia started to brighten gradually. For a list of references, see the "background material" in this article on TASS measurements of the star. There have been many reports on this star's appearance since the brightening was noticed,
Several amateur astronomers sent me pictures which they had taken themselves, or gathered from others, showing the region of Var Cas 2006 before its brightening was noticed. I provide here a short list of them, together with V-band measurements I was able to extract from four of them. Here are my best estimates at the measurements:
#  Observer       UT  Date       JD - 2,450,000         V
#---------------------------------------------------------------
  Earle          Oct 21.92         4030.42         11.2  +/- 0.3

  West           Oct 24.804        4033.304        10.6  +/- 0.4

  Spink          Oct 25.9042       4034.4042       10.9  +/- 0.4

  Davison        Oct 26.854        4035.354        11.2  +/- 0.3

  Geary          Oct 31.842        4040.342         8.72 +/- 0.15
#------------------------------------------------------------
Below is a light curve of the event, showing these measurements together with V-band values reported to the AAVSO (but not yet processed and verified).
If this event were due to gravitational microlensing, then one would expect the light curve to be symmetric around the time of maximum. If one were to guess very very very roughly that the time of maximum might be JD 2,454,040, then one could reflect the post-maximum measurements around this time to get a rough idea of what the microlensing model might predict for pre-maximum values. If you wish, you may look at such a hypothetical sketch.However, before you draw any conclusions about the reality of the microlensing model, please read these comments on the event from Doug Welch.
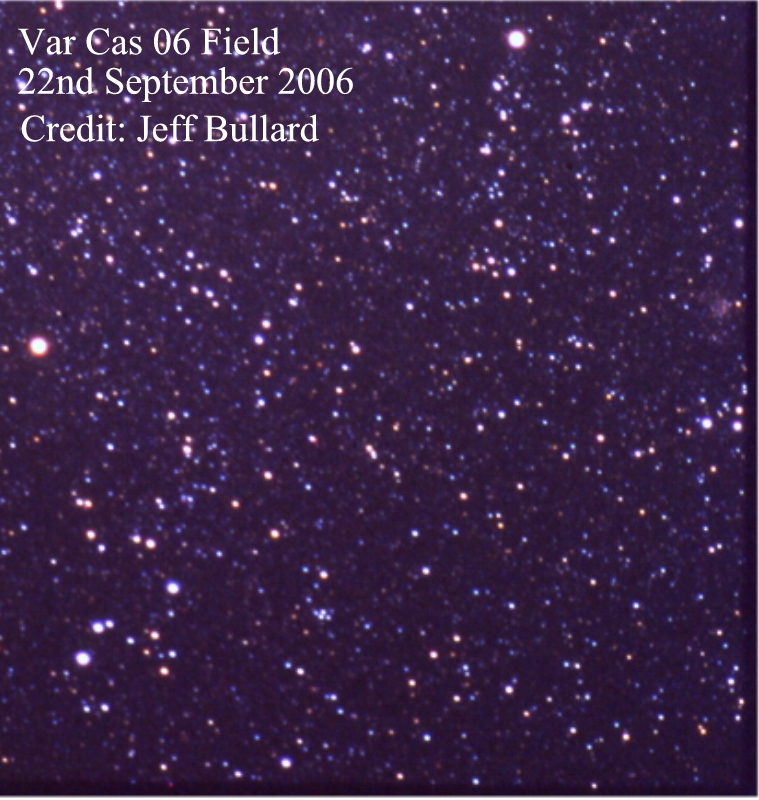
Keith Geary forwarded to me an image taken by astrophotographer Jeff Bullard.
All I know is that it was taken on film, then scanned. Here it is. The orientation is North up, East to the left. Alpha Cas is at the left edge, Beta Cas at the top, and NGC 7789 at the right edge.
The variable lies near the center of the golden box. Here's a closeup. Note the bright "triangle" of stars to the upper left, and the "circlet" of stars just to the right (west) of the variable. The location of Var Cas 2006 is marked with a pair of bars.
There is a faint, blueish object at that position, representing the merged light of Var Cas 2006 and a neighboring star. At quiescence -- as in this image -- the target (aka GSC 3656.1328 = TYC 3656-1328-1) has a magnitude of about V=11.5.
I could make no measurement from this image.
Tom Krajci forwarded to me an image taken by astrophotographer Dennis di Cicco. Di Cicco writes:
I have 24 (that's right, twenty four) 15-minute exposures from the evening of September 25/26 that show the star. Here's a small jpeg of the whole field. I've already identified the star, but it's blended with GSC 3656-1318. The images are with a large-format CCD with 12-micron pixels done with a 40mm f/4 Hasselblad lens and a 15nm wide H-alpha filter. This jpeg is a combination of all 24 frames -- obviously done so show nebulosity along the Milky Way.
A portion of the image is shown below, in the standard orientation of North up, East to the left. As in the Bullard image, Alpha Cas is at the left, Beta Cas at top, NGC 7789 on the right.
Here's a closeup of the region around the target, which lies between the green bars.
The marked position shows the merged light from the quiescent Var Cas 2006 and a neighboring star of similar brightness. Note that the total light is somewhat fainter than that of most of the members of "the circlet." Remember that this is an H-alpha picture, so it records red light; and recall that the target star is blueish (spectral type A2 or so).
I made no measurements from this image.
Keith Geary told me about an image that Thomas Earle took on photographic film. Thomas scanned the film at high resolution into a 48-bit TIFF format and sent me a copy. A small version of the entire image looks like this:
NGC 7789 is the cluster near the top right. The image is tilted by about 30 degrees relative to the standard orientation. The region around Var Cas 2006 is at the bottom right edge of the image.
I have labelled the stars used to calibration the photometry in this image below. Note that the light from Z1 is partially merged with that from Var Cas 2006, which appears between the vertical bars.
For reference, here are the magnitudes for these labelled stars from Arne Henden's work:
# Henden photometry for stars near Var Cas 2006         Earle image
#                         Henden photometry             photometry
#  RA           Dec        V    B-V    I         chart  aper G  mag
 00:08:38.76 +54:35:49.5 10.503 0.447  9.922       A     9.713  10.236
#00:10:28.83 +54:42:00.3 10.522 0.371 10.016       B
 00:08:48.46 +54:37:26.5 10.537 0.453  9.997       C     9.707  10.180
 00:08:16.15 +54:37:44.3 10.605 0.334  9.941       D     9.700  10.069
 00:08:34.32 +54:36:15.4 10.824 0.995  9.819       E     9.729  10.219
 00:08:11.58 +54:37:12.3 10.924 0.298 10.555       F     9.766  10.234
 00:08:52.43 +54:47:41.1 11.544 0.582 10.829       G     9.874  10.511
 00:08:27.48 +54:41:10.1 11.556 0.659 10.799       H     9.883  10.525
 2.2344      +54.5758    11.773 0.511 11.149       I     9.868  10.556
 2.0718      +54.6584    11.683 1.086 10.476       J     9.934  10.654
 2.0458      +54.6549    12.290 0.340 11.857       K    10.040  10.894
#2.35322     +54.66867   12.335 1.074 11.148       Z1    9.926  18.826
 2.2942      +54.6572    11.973 1.165 10.745       Z3    9.912  10.666
First, I converted the 48-bit TIFF image into 3 16-bit integer FITS images, one for each of the Red, Green and Blue channels of the TIFF image. I will analyze only the Green channel, comparing it to the standard Johnson-Cousins V band. Here's a closeup of the region in the G-band channel:
Photographic film does not record light in a linear fashion. The digitized version of this image has a PSF which looks very different from ordinary CCD images. Below are radial profiles of three stars, a relatively bright star on the left, an intermediate one (labelled "I" in the chart) in the middle, and a faint star on the right. Note how the PSF grows narrower for faint stars. On a CCD image, although the core of the PSF might saturate, the wings would be more similar for bright and faint stars.


I tried two different techniques to extract instrumental magnitudes from this digitized image.
The target, Var Cas 2006, is only partially resolved from the nearby star "Z1". One would expect that the PSF-fitting should do a better job of measuring each star's light, in theory; but if the PSF isn't the same for all stars, then it might not.
The instrumental measurements for each method are shown in the table above. We can then compare each set of instrumental magnitudes to Henden's photometry to calibrate the instrumental values (I'll leave star "Z1" out of the calibration step for now, since it is merged with the target star). I'll show the results for each method in turn.
First, the aperture photometry:
The best fit straight line has equation
V = -42.12652 + 5.434435 * (aper mag)
with a scatter of 0.16 mag, uncert in slope of +/- 0.99, correlation coefficient
r = 0.97.
I checked for the residuals as a function of V mag,
and as a function of (B-V) color,
and found no significant trends in either case.
Now, the PSF-fit photometry:
The best fit straight line has equation
V = -13.42596 + 2.36960 * (aper mag)
with a scatter of 0.17 mag, uncert in slope of +/- 0.47, correlation coefficient
r = 0.97.
I again checked for the residuals as a function of V mag,
and as a function of (B-V) color,
and again found no significant trends in either case.
When we apply these two methods to the target star, and its neighbor Z1, we find these output magnitudes:
  star           aper phot       PSF-fit phot         Henden V mag
---------------------------------------------------------------------
Var Cas 2006        10.919         11.348

Z1                  11.816         12.227              12.335

diff in mag          0.897          0.879
---------------------------------------------------------------------
Which is the better method?
I will choose to give the PSF-fit method twice the weight of the aperture photometry method, which then yields a value
V = 11.2 +/- 0.3 on JD 2,454,030.42
Keith Geary forwarded to me an image taken by astrophotographer Gary Hatfield, on Oct 22, 2006. Here's the original color JPEG image.
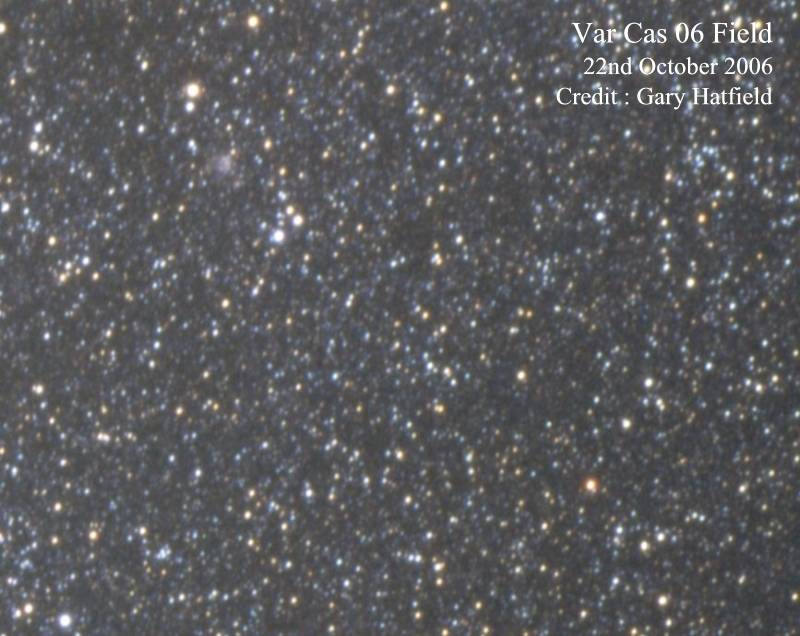
In order to put this in the standard orientation of North up, East to the left, I rotated the image by -47 degrees:
Below is a closeup of the region around the target. The signal from the target is low, but it appears roughly as it did in earlier images: somewhat fainter than most of the stars in the "circlet."

I made no measurements from this image.
Roger Pickard forwarded to me two images taken by astrophotographer James West. West wrote:
Hi Roger, I saw the request to send you pictures of Cassiopeia in October. I have some taken in very clear skies in North Yorkshire on 24th October with my Canon 300D and a 50mm F1.4 lens. Exposures were around 10 secs and between ISO 800 and 3200.
Of the two images, the one taken at a setting of ISO 800 was better than the one at ISO 3200, so I concentrated on it. I converted the original JPEG image -- alas, full of compression artifacts and only 8 bits per pixel in each of the RGB planes -- into FITS format. Because the original was a JPEG image, it had already lost much of its information; we should expect mediocre results from it. A portion of the image near the region of interest is shown below.

I isolated the G-band channel in FITS format. The image has a scale of about 29 arcseconds per pixel, and a FWHM of 3.1 pixels (or about 90 arcseconds). I used a circular aperture of radius 3.0 pixels to extract instrumental magnitudes from the stars. Using a set of 10 nearby comparison stars (largely the same set used in the Spink image, described in more detail below), I compared the instrumental magnitudes to Tycho Vt magnitudes. I found a pretty good linear fit,
Tycho Vt = -1.8755 + 0.9269065 * (G instr. mag)
with a scatter of about 0.06 magnitudes.
There was no trend in the residuals with color.
The light at the position of the target had an equivalent
magnitude of Vt = 10.31.
However, this light was a combination of the target,
plus light from three nearby comparison
stars.
I computed the contribution into the aperture of
all three neighbors;
the corrected magnitude of the target star
alone is Vt = 10.62.
If we assume that the color of the target star
was its usual color, (B-V) = 0.30, we can convert
this Tycho-2 magnitude to the standard Johnson-Cousins
system. We get
V = 10.6 +/- 0.4 at JD 2,454,033.304
Tom Krajci forwarded to me an image taken by astrophotographer Ian Spink. Spink wrote:
I have a picture (a single exposure only) of the western part of Cassiopeia, RAW format (unprocessed), centred on alpha Cassiopeiae (Schedar)taken at 2006.10.25 at 21:42 UT. Camera: Canon EOS 350D digital(8M pixels) Lens: Canon 28-135mm zoom at 135 mm Shutter sp: 30 sec Aperture: f5.6 ISO speed: 800 Piggyback on Meade CST The target star is visible, just within the frame at upper right corner.
I first used Photoshop to turn the original RAW image into a TIFF image with 48 bits per pixel, 16 bits each in Red, Green, Blue channels. This TIFF image was very large: about 47 MBytes. Next, using the libtiff library, I converted the TIFF image into 16-bit integer FITS files: one each for the Red, Green, and Blue channels of the camera. The CCD chip in this Canon camera has a green channel with spectral response sort of similar to the Johnson-Cousins V-band. I decided to restrict my analysis to the "G" channel of the image and try to convert the results to V-band.
Below is a small subsection of "G" channel of the Spink image, in the general region of the target. The original image has North to the upper-left, East to the lower-left; the "triangle" of stars appears in the upper-left portion of this subsection.
We can rotate the image to match the standard orientation and zoom in:

In this image, about 4-5 days before maximum light, Var Cas 2006 is pretty faint. It is clearly fainter than most of the stars in the "circlet" asterism; for example, the circled star "C". It is also clearly fainter than the nearby star "N", to its south.
I measured instrumental magnitudes for Var Cas 2006 and other, nearby stars on the FITS image taken from the "G" channel. Some basic properties of the image:
I found that the relative instrumental magnitudes of Var Cas 2006 and the nearby stars "C" and "N" could vary significantly, by up to +/- 0.2 mag, based on the size of the circular aperture used to extract light. I believe that this is the major source of uncertainty in the measurements.
I calibrated the instrumental magnitudes in two ways.
If we fit a linear relationship to the difference in magnitudes, we find
Vt = -7.8743 + 1.31073 * (instr G mag)
with a scatter of only 0.11 mag.
There are no strong color terms: the linear fit to residuals as a function of (Bt - Vt) yields an insignificant slope:
residuals = -0.03574 + 0.033796 * (Bt - Vt)
in which the formal uncertainty in the slope is +/- 0.13.
The first method yields a value for the source of light at the position of Var Cas of about V = 11.07; the second method yields a value of Vt = 10.89. I will adopt the second value. That source is mostly due to the light of Var Cas 2006, but there is a small contribution from the nearby star at (RA = 2.3528, Dec = +54.6691), with V = 12.335 in Henden's photometry. I estimate that the contribution of that contaminating star's light to the 2-pixel aperture around Var Cas 2006 is about 0.04 mag, so I conclude that the Vt mag of the star was 10.93.
If we assume that its color was (Bt - Vt) = 0.30, as measurements after maximum indicate, then the conversion from Tycho-2 Vt to Johnson-Cousins V is
V = Vt + 0.008 - 0.0988 * (Bt - Vt)
which yields V = 10.91.
I assign a large uncertainty to this measurement, however,
due to the pixel-to-pixel artifacts in the image,
and due to the inconsistency of about 0.20 mag from the
two different methods of calibration.
I conclude that for the Spink image,
V = 10.9 +/- 0.4 on JD 2,454,034.4042
Roger Pickard alerted me to an image taken by astrophotographer Stuart Davison. You can find the image and some discussion at (registration required)
Stuart wrote:
I was browsing the UKAI bulletin board when I saw your request, forwarded by Duncan Miller (aka Dogman on the site). I'm attaching a jpg showing an image I took on the 26th of October. It is a crop of a widefield using a canon 10D DLSR with a 28mm lens. I've noted Cassiopeia Alpha and Beta for reference and I believe you can see stars down to the magnitude you require. I think that the star you are looking for is directly across from Cass Beta just to the right of centre.The image represents approximately 6 minutes of exposure at iso1600. It was taken in the village of Ulleskelf in North Yorkshire.
I started with the TIFF version of Davison's image. The first step was to extract the G-channel data and convert it to 16-bit integer FITS format. The resulting image looks like this:
Zooming in to the region near the variable, we see
The image has
I decided to use a small aperture to extract instrumental "G-channel" magnitudes, in order to avoid as much contamination from neighboring stars as possible. I chose an aperture radius of 2.0 pixels = 105 arcsec.
I followed a procedure very much like that described above for the Spink image to turn the instrumental magnitudes into Johnson-Cousins V. First, I compared the extracted magnitudes of a number of stars in the image to their Tycho Vt magnitudes. I made several passes through this procedure with different subsets of stars, discarding the brightest stars in turn, because they tended to have the largest residuals and peak pixel values near the saturation limit. In the graphs below, I show one typical run through the procedure.
The best linear fit yielded
Tycho Vt = -5.28728 + 1.191833 * (instr G mag)
with a scatter of 0.07 mag and uncertainty in slope of +/- 0.10. Here are the residuals as a function of Vt magnitude
and as a function of (Bt - Vt) stellar color.
The weak trend visible in this diagram was
(Vt - model Vt) = 0.06998 - 0.081170 * (Bt - Vt)
The uncertainty in the slope was +/- 0.099. I decided to make the correction implied by this color term, using an assumed color (Bt - Vt) = 0.30 for the variable.
I derived a Vt magnitude for the light at the star's position of Vt = 10.71, with a formal scatter of about +/- 0.10 mag, based on two calibrations with different subsets of stars.
Now, in this image, the pixels were so big that the light I measured was a mixture of light from four stars. The chart below is a very nice color composite from POSS images which was made by Bela Hassforther.

I estimated the fraction of their light that each of these three neighbors would contribute into the 2-arcsec aperture of the variable, then solved for the apparent magnitude of Var Cas 2006 which would yield the measured Vt = 10.71. The result was that the variable should have had approximately Vt = 11.26 (0.55 mag fainter than the combined total light).
Finally, assuming a color (Bt - Vt) = 0.30 for the variable again, I converted the Tycho Vt magnitude to the standard Johnson-Cousins scale. The final result is V = 11.2, with a pretty large uncertainty.
I'm not sure exactly when this image was taken. Davison writes that the approximate time of the exposure was 10 PM (Greenwich) on Oct 26, 2006, from his site in Yorkshire, England. We may be able to improve this time later.
V = 11.2 +/- 0.3 on JD 2,454,035.354
Astrophotographer Keith Geary posted to several newsgroups and mailing lists an image he took very close to the time of maximum light. He wrote:
An AAVSO alert came to my mobile phone at 1919UT, I was able to image this field with a 135mm lens at f2.8, 60 seconds exposure at ISO 800 with a Canon 300D at 2012UT, 31/10/2006.
Keith sent me a copy of the original RAW image, which I was able to convert into 48-bit TIFF, and thence to 16-bit integer FITS, one image each for the Red, Green, Blue channels. Again, I chose to concentrate on the Green channel only, and try to extract a V-band measurement.
Below is a portion of Geary's full image; North up, East left. NGC 6689 is visible near the top right. A box surrounds the field of the variable.

Below is the G-band channel alone, displayed in reverse video, zoomed in just a bit.

We can zoom in even farther; this time, the target star is circled.

Var Cas 2006 is clearly much brighter than any of the stars in the circlet (and specifically "C"), or the nearby star "N".
Some properties of Geary's image:
I extracted instrumental photometry for the variable and nearby stars using circular apertures of radius 5 pixels, or about 90 arcseconds. I used 3 nearby stars with good photometry from Henden to calibrate the measurements: these are labelled in the picture above. I found some evidence for a color term between the instrumental and standard magnitudes:
The linear fit is
(instr. "G" mag - Henden V) = 3.095 + 0.314 * (B - V)
with a scatter of 0.08 mag and an uncertainty in slope of +/- 1.19. If we assume that the color of the variable is (B-V) = 0.30, shown by a circle in the figure above, then we derive a magnitude for the object of V = 8.65. Now, this large aperture includes light from three nearby stars. Using Henden's photometry for these stars, I find that one must subtract about 0.07 mag from the total light. This, I derive from Geary's image
V = 8.72 +/- 0.15 on JD 2,454,040.342
The estimated uncertainty is a combination of the scatter from the color calibration, and the variations in relative instrumental magnitudes with choice of aperture size.